Durham Research Online
Deposited in DRO:
19 January 2015
Version of attached le:
Accepted Version
Peer-review status of attached le:
Peer-reviewed
Citation for published item:
Bolden, D.S. and Barmby, P. and Raine, S. and Gardner, M. (2015) 'How young children view mathematical representations : a study using eye-tracking technology.', Educational research., 57 (1). pp. 59-79.
Further information on publisher's website: http://dx.doi.org/10.1080/00131881.2014.983718
Publisher's copyright statement:
This is an Accepted Manuscript of an article published by Taylor Francis Group in Educational Research on 24/12/2014, available online at: http://www.tandfonline.com/10.1080/00131881.2014.983718.
Additional information:
Use policy
The full-text may be used and/or reproduced, and given to third parties in any format or medium, without prior permission or charge, for personal research or study, educational, or not-for-prot purposes provided that:
• a full bibliographic reference is made to the original source
• alinkis made to the metadata record in DRO
• the full-text is not changed in any way
The full-text must not be sold in any format or medium without the formal permission of the copyright holders. Please consult thefull DRO policyfor further details.
Durham University Library, Stockton Road, Durham DH1 3LY, United Kingdom Tel : +44 (0)191 334 3042 | Fax : +44 (0)191 334 2971
1
How Young Children View Mathematical Representations:
A Study Using Eye-Tracking Technology
David Bolden
1, Patrick Barmby
2, Stephanie Raine
1, and Matthew Gardner
11
2
Abstract
Background
It has been shown that mathematical representations can aid children’s understanding of mathematical concepts (Greeno and Hall 1997) but that children can sometimes have difficulty in interpreting them
correctly (Vosniadou 2010). New advances in eye-tracking technology can help in this respect because it
allows data to be gathered concerning children’s focus of attention and so indicate what aspects of the
representations they are focussing on. However, recent eye-tracking technology has not been used to any
great degree in investigating the way children view and interpret mathematical representations.
Purpose
This research explored the use of new advances in eye-tracking technology in investigating how young
children view and interpret mathematical representations of multiplication.
Sample
Nine Year 5 children (four boys, five girls, aged 9-10 years of age) from a local primary (elementary)
school in the North-East of England were asked to complete the test during school time. The children
represented a range of attainment levels across the mathematical domain (three higher, three middle and
three lower attaining children) and were selected accordingly by their class teacher. We recognise that
this study was only based on a small sample of children, however, this number still allowed us to make
meaningful comparisons in particular between the different types of representations presented.
Design and methods
The study consisted of each child looking at eighteen static slides, one after the other, with each slide
presenting a symbolic and a picture representation of multiplication problems. The data that was captured
by the eye-tracker and recorded was then analysed quantitatively (e.g. time on each slide, time on each
area of interest specified within the software) and qualitatively (video recordings of each child’s gaze
trajectory during each representation was carried out, thereby allowing a categorisation of the different
approaches adopted).
3 The study showed that a) the particular form of the number line representation used in this study was less
successful than the other picture representations used (equal groups, array) in promoting multiplicative
thinking in children, and b) the success of children to think multiplicatively with the ‘groups’ and the
array representation was related to their general mathematics attainment levels.
Conclusion
These findings have implications for teacher practice in that teachers need to be clear about the possible
drawbacks of particular representations. Even in using more successful representations, for lower
attaining children, the progression in their understanding of the representation needs to be taken into
account by the teacher. The study also highlighted that the eye-tracking technology does have some
limitations but is useful in investigating young children’s focus of attention whilst undertaking a
mathematics assessment task.
4
Introduction
In agreement with Shulman (1986, 4) we define mathematical representations as ‘… analogies, illustrations, examples, explanations, and demonstrations – in a word, the ways of representing and formulating the subject that make it comprehensible to others’. Such representations can be both internal and external. We, like others (Kaput 1991, Pape and Tchoshanov 2001), make the distinction between internal and external mathematical representations. We view internal representations as the way in which concepts are stored mentally (Davis 1984) . External representations are ‘materially instantiated’ entities (Kaput 1991, 56) which ‘serve to denote or to exemplify’ mathematical concepts (Perkins and Unger 1994, 2). These representations can be physical apparatus (e.g. Dienes blocks, an abacus), symbols (e.g. written symbols), pictures (e.g. diagrams such as the number line), sounds and spoken words, and computerised objects (Kaput 1991). Zhang (1997) highlights that information in external representations can be internalised through perceptual processes alone; however, existing conceptual knowledge from internal representations may facilitate or hinder these processes.
Representations of mathematical concepts play an important role in understanding. They help both students grasp the mathematical ideas required (Greeno and Hall 1997) and teachers in their explanations of those concepts (Hall 1998), thus benefitting the students in their learning (Leinhardt et al. 1991, Brophy 1991). However, representations themselves do not necessarily convey the mathematical concept and so children are not guaranteed to extract the required mathematical knowledge (Cobb, Yackel, and Wood 1992, Pape and Tchoshanov 2001). That is, the ways in which children access and interpret mathematical representations can be problematic (see for example, Vosniadou 2010). New advances in eye-tracking technology can help in this respect because they allow data to be gathered concerning children’s focus of attention and so indicate what aspects of the representations they are
5
focussing on. However, recent eye-tracking technology has not been used to any great degree in investigating the way children view and interpret mathematical representations. This paper describes a study which explores the use of eye-tracking technology in investigating how young children view and interpret particular mathematical representations.
Benefits of and Drawbacks to External Representations
We have previously set out our views concerning the benefits of external mathematical representations in developing conceptual understanding in the mathematical domain, both with young children (Barmby et al. 2009) and with pre-service teachers (Bolden, Barmby, and Harries 2013). We and others have shown that external representations play a variety of roles in the teaching and learning of mathematics. Students of mathematics need to be able to interpret a large variety of these representations (Verschaffel et al. 2010) and are an important part of their mathematical understanding (Hiebert and Carpenter 1992, Greeno and Hall 1997). External representations provide students with insight into abstract mathematical ideas (Duval 1999) and also play an important part in problem solving processes (Lesh, Landau, and Hamilton 1983). External representations support students’ reasoning processes (Verschaffel et al. 2010), supporting the connections that they make between their existing knowledge and mathematical knowledge (Post and Cramer 1989). Related to these roles, representations are also important for teachers of mathematics. They are used by teachers in explaining mathematical concepts to students (Leinhardt et al. 1991, Brophy 1991) and support teachers in making these explanations (Hall 1998). As such, knowledge of representations can be used in the teaching of mathematics and constitute an important part of teachers’ pedagogical content knowledge within the subject (Shulman 1986, Ball, Thames, and Phelps 2008).
6
However, the use of external representations in the mathematics classroom can be problematical. A variety of authors (for example, Cobb, Yackel, and Wood 1992, Pape and Tchoshanov 2001) have called into question whether students would necessarily extract the intended mathematical concept from the representations presented to them. For example, Vosniadou (2010) has highlighted the difficulties faced by young children in interpreting the number line. She proposes two possible reasons for the difficulties faced by children with external representations. She differentiates between perceptually based representations and more abstract conceptual models, with representations in science and mathematics often being the more theory-based conceptual models. These conceptual models are more difficult for students to understand as they require more domain-specific knowledge for understanding. Also, students’ epistemological views, in terms of being over-reliant on realistic, perceptually based representations, rather than understanding the role played by conceptual models in mathematical reasoning and understanding, can hinder the students’ use of external representations.
Multiplicative Thinking and Different Contexts and Ways of Representing Multiplication
Focussing on the specific area of multiplication, Mulligan (2002) highlights the importance of children developing multiplicative thinking for their future learning of mathematics. Steffe (1994) identifies this development of multiplicative thinking as a move from ‘pre-multiplicative’ thinking where a multiplication situation is viewed in a unitary way (i.e. involving one kind of unit as in addition and subtraction where similar units are added/subtracted), to multiplicative thinking involving the coordination of different types of units within a situation. In the latter case, pupils can reason about more abstract composite groups, which in turn contain a certain number of elements. Multiplicative thinking therefore involves a binary view involving the different units of groups and elements (Anghileri 2000),
7
with thinking moving from perceptual counting to abstract composite groups which are involved in repeated addition, combining and partitioning (Mulligan 2002). This concept of iterating the groups of elements is therefore essential for the understanding multiplication and division (Steffe 1994).
Greer (1992) also highlighted the different possible ‘situations’ which require multiplicative thinking, highlighting the iterations of different kinds of groups. For example, we have ‘equal groups’ situations (e.g. I have four bags, each containing 5 apples), ‘multiplicative change’ situations (e.g. the sunflower plant was only two centimetres long a fortnight ago, but it has grown to three times that size now), and ‘Cartesian product’ situations (e.g. If I have four sizes of shirts and 5 possible colours, how many different kinds of shirts could I possibly have?) amongst others. Greer (1992) also highlighted different external representations, in particular picture representations, which can be used to support understanding of these different situations. For example, an ‘equal groups’ situation can be represented by a ‘groups’ representation; alternatively, a ‘Cartesian product’ situation can be represented by an array, showing in diagrammatic form the number of possible combinations in a Cartesian product situation. These representations can support children’s multiplicative thinking. For example, Anghileri (2000) highlighted the importance of the ‘groups’ representation for children viewing multiplication as repeated addition. Greer (1992) also highlighted the number line for highlighting the repeated addition aspect of multiplication, with jumps of equal size repeated a given number of times (see Figure 2 for examples of the groups, array and number line representations). Battista, Clements, Arnoff, Battista and Borrow (1998) emphasised the importance of the array as a major model for and application of multiplicative thinking. Anghileri (2000) and Skemp (1986) have also emphasised the importance of the array for children’s understanding of the commutative and distributive laws of multiplication.
8
However, as highlighted generally, these representations will not necessarily support multiplicative thinking in children. Alongside the possible difficulties of the number line for children highlighted above, studies have also found that young children do not understand the array representation for multiplication (Barmby et al. 2009). Battista, et al. (1998) highlighted the need for students’ ‘structuring’ of arrays, with this structuring being a form of abstraction when looking at an object. Mulligan (2002) found that low attaining students were less likely to show this structuring of objects, not identifying equal groups within a representation. Alternatively, Battista et al. (1998) found that these students did not make use of the rows or columns within an array as a composite unit. More generally, Alseth (1998) found that the total number of items in a multiplication picture was more important for low attaining students than the way that the picture was organised. These students may not therefore extract the mathematical structure within the picture without the appropriate conceptual knowledge.
Eye Tracking Technology
Eye-tracking research has a long history dating back over 100 years (Duchowski 2002, Rayner 1992, 1998). However it is only relatively recently, with the availability of technologically advanced eye recording computer systems, that the data produced has become more accurate and objective. Rayner (1998) describes the following processes as taking place when we take in information with our eyes. The eyes make rapid movements, referred to as saccades, and between these movements, the eyes remain relatively still during fixations. We do not take in any new information during the saccades – this only takes place during the fixations. During these fixations, our visual field consists of the foveal, parafoveal and periphery regions. The foveal region is at the centre of our visual field and is the area of greatest acuity. Around this is the parafoveal region with poorer acuity. The periphery region
9
is around the parafoveal region with even poorer acuity. Information can be taken in from the parafoveal and foveal regions, but to see a stimulus more clearly, a saccade is made to place the stimulus in the foveal region of the visual field. Eye-tracking technology, through the measurement of where the observer is looking at any given time, has become a much used tool to gather information about the direction of the observer’s visual attention (gaze trajectory) at a given point in time as well as the time spent gazing at a particular stimulus (fixation duration). This allows researchers to make inferences about what the observer views as important whilst observing the stimuli. Past research has shown that there are particular patterns of eye movements when individuals are reading text but there has been no such pattern found when individuals simply look at a scene or picture (Kennedy 1992). Related to mathematics, it has been found, unsurprisingly, that more complicated aspects of problems lead to more and longer fixations (Duchowski 2007). Also, quite recent research using exactly this methodology has shown that it can be used to identify different eye-movement profiles between expert and novice mathematicians when observing the same mathematical problems (for example, experts more quickly focus on important information when extracting information from problems) (Andrà et al. 2009).
The extant research, until quite recently, was predominantly centred round a limited number of disciplines, including neuroscience, psychology, and computer science. However, this is now changing and eye-tracking technology is increasingly being used in other fields, including marketing and the evaluation of and training for work-based environments. The interested reader is directed to Rayner (1998) and Duchowski (2002) for a fuller review of the evidence in the various domains. In comparison to the amount of research in the domains mentioned above, the research in the field of mathematics education is rather sparse. Eye-tracking studies having a mathematics focus include investigations of students’ approaches to arithmetic (Suppes 1990, Suppes et al. 1983), the comprehension of word problems (De
10
Corte, Verschaffel, and Pauwels 1990, Verschaffel, De Corte, and Pauwels 1992, Hegarty, Mayer, and Green 1992, Hegarty, Mayer, and Monk 1995), dyscalculia (Moeller et al. 2009, Sophian and Crosby 2008) and geometry (Epelboim and Suppes 2001). There have also been some recent eye-tracking studies examining the role of representations in mathematical learning (Shvarts and Cumachenko 2013, DeWolf et al. 2013). More specifically, Andrà et al. (2014) examined undergraduate students comparing different representational forms for algebraic expressions. However, research on eye-tracking involving mathematical representations is still very limited, and research in the field of primary (elementary) mathematics education is sparser still.
Aims
This research uses an eye-tracking system to record children’s visual attention with a variety of mathematical representations of multiplication. The aims of the research are two-fold. First, it is hoped that the results may shed some light on how young children view and interpret the different mathematical representations and the elements within, i.e. do young children find some representations easier to interpret and work with? Second, although eye-tracking technology has been used in the field of mathematics education in the past (Hegarty, Mayer, and Green 1992, Verschaffel, De Corte, and Pauwels 1992), in its most recent form and with primary (elementary) age children, it is a relatively new technology in the field. The second aim of the research is therefore to test whether the technology can be successfully used with young children.
Method
11
A table-mounted video-based corneal reflection eye-tracker was used (Duchowski 2007). The camera and infra-red optics for detecting a child’s gaze was located in a bar situated beneath the computer monitor used (see Figure 1), with both the monitor and the eye tracker bar connected to a laptop. The eye-tracker hardware used was an EyeTech VT2 and the monitor had a 21.5 inch screen. Mangold Vision eye-tracker software was used on the laptop to display the stimuli and to record the eye-tracking data. The data was recorded at a rate of approximately 70 recordings per second. Duchowski (2007) highlights the ease of transport, installation and use of this type of table-mounted set-up. This meant that unlike most eye-tracking studies, the present study was not carried out in the clinical environment of a laboratory, but rather set up in a vacant classroom in the school participating in the study. There were two reasons for this. First, the less formal nature of the setting was, we felt, more comfortable for the children involved in the study. Second, transporting the students to the equipment was made easier by bringing the equipment to the students, and this lessened the disruption caused by the study to the school and the children involved. The portable nature of the eye-tracking equipment facilitated this set up. Children were asked to sit and view static slides (see below) on the monitor located at about 60cm away from their seated position. Despite being in a classroom location, it was arranged that the classroom would not be in use to reduce distractions.
(Insert Figure 1 here)
Materials Shown to Children
The study consisted of each child looking at eighteen static slides, one after the other, with each slide presenting two mathematical representations of multiplication problems. One was a picture representation of multiplication (either a ‘groups’, ‘array’ or ‘number line’ representation) and the other was a symbolic representation, e.g. 6x7, etc. Examples of each
12
of these are given in Figure 2 below. The details for each slide (representation type, numbers involved in the calculation, whether the symbolic and picture representations matched) are given in Table 1. In each case, the slides were constructed so that the symbolic calculations presented were randomly chosen from 6×7, 7×8 or 8×9. The magnitude of the numbers was chosen so that they were large enough to involve close examination by the pupils (for example, minimising subitising processes which are limited to around a maximum of 4 objects (Butterworth 1999)), but not too large to make the calculations overly complex. Within each type of picture representation, slides were presented where a) either the calculation and the picture matched, or b) the picture was mismatched by either one above or one below the dimensions of the calculation, but avoiding both dimensions being the same in the picture (see Figure 2 below). Within each of these conditions, two possible ‘orientations’ of the picture were included. First, reading the calculation as multiplicand x multiplier (which we termed the ‘traditional’ view). Second, the multiplier x multiplicand reading of the calculation (commonly referred to in classrooms as ‘so many lots of something’). In the case of the array where this made little difference, we treated each column as a group which was repeated, and so two orientations were still presented. This gave a total of eighteen possible slides as shown in Table 1, the important issue being that there were equal numbers of types of representations, matching and mismatching slides, and also orientation types. The order of presentation of the eighteen slides were randomized, but kept consistent across all the children. Children were asked to determine whether the picture matched the calculation, simply answering yes or no, before clicking on to the next slide. Prior to being presented with the first slide, children underwent a calibration process for the eye-tracking technology, looking at a dot at different parts of the screen. Children were then given an introduction to what was required of them and, when ready, presented with the remaining slides.
13
(Insert Figure 2 here)
(Insert Table 1 here)
Children were able to work through the slides at their own pace whilst being observed by two members of the research team. After each slide, the child indicated whether the representations on the slide matched or did not match and this response was noted. Although the slides were randomized in their presentation, it was still possible that ordering effects may have impacted on the results for individual slides (e.g. ‘priming’ with children getting used to particular representations, or speeding up or slowing down as they progressed through the slides). Therefore, we minimised the impact of these ordering effects by finding the average measures over groups of slides (e.g. either averaging over all the slides, or averaging over slides with the same type of representation – see data analysis section below).
Participants
Nine Year 5 children (four boys, five girls, aged 9-10 years of age) from a local primary (elementary) school in the North-East of England were asked to complete the test during school time. The school was a state primary school, following the same curriculum as other state schools in England. The children represented a range of attainment levels across the mathematical domain (three higher, three middle and three lower attaining children) and were selected accordingly by their class teacher. No additional incentives were provided to the children. During the primary school phase, the mathematical attainment of the children is determined by on-going formative assessment by the class teacher and attainment in standardised tests. The children in this study had had some knowledge and experience of the visual representations in their mathematics, but we are aware that this varies across schools in England (Barmby et al. 2013). We recognise that this study was only based on a small sample
14
of children, and this was partly due to trying to minimise the degree of disruption to the school concerned. However, as we can see from the next section, with each child experiencing 18 slides, this number still allowed us to make meaningful comparisons in particular between the different types of representations presented.
Ethical considerations
Prior to the study being carried out, ethical consent was obtained from through the Durham University School of Education ethics committee. In addition, the details of the study were discussed with the head teacher of the school and the class teacher of children involved in the study. Consent from both teachers was obtained for the study. With all the children involved, it was explained that they could withdraw from the study at any point if they wished to.
Data Analysis
Firstly, we examined data obtained simply from examining whether pupils correctly identified matching or non-matching representations from the slides. The proportions of correct answers were compared to their attainment level as assessed by the class teacher to examine whether the two measures correlated. Secondly, the quantitative data that was captured by the eye-tracker and recorded by the software on the laptop was then analysed. The time on each slide and also the proportion of time on each area of interest specified within the software was examined by averaging over the measures for all the children and also averaging over slides with the same type of representation. This allowed us to make comparisons between the different representation types. Finally, using the facilities present in the eye-tracking software, qualitative analysis of video recordings of each child’s gaze trajectory during each representation was carried out, thereby allowing a categorisation of the
15
different approaches adopted. The software allowed us to present the recordings as heat maps (Holmqvist et al., 2011), which show the spatial distribution of where the children looked at on the screen during a given time window (we typically used a window of around one third of a second). We ran this time window over the duration of the child looking at each slide, providing a useful ‘video recording’ showing the trajectory of each child’s gaze over time as he/she looked at each representation. Also recorded by this apparatus was pupil diameter data. This measure can be used to study cognitive states such as concentration (Holmqvist et al. 2011) but it is also identified that some commercial eye-trackers over-estimate this possibility. In this study therefore, this measure was not examined.
Results
In presenting the results, we begin by presenting the quantitative results from the study, before looking in detail at the results of the qualitative analysis.
With the quantitative data, we first look at whether pupils obtained the correct answer for each slide. The proportion of correct answers achieved by each child across all the slides closely matched the teacher assessment of the children’s attainment, as shown in Table 2. The correlation (Spearman ρ) was 0.77, which was statistically significant at the 5% level.
In England, attainment is measured against descriptions of performance which are known as ‘levels’, increasing through levels 1-8 in mathematics. Levels are often sub-divided into a, b,and c (ranked high to low respectively) for teacher assessment purposes with the expected level of attainment at age 11 years set at 4b.
16
In order to compare the impact of different types of representations, Figure 3 shows the average proportion of correct answers for each type of representation. With six slides for each representation and nine children in the sample, each average was calculated over 54 cases.
(Insert Figure 3 here)
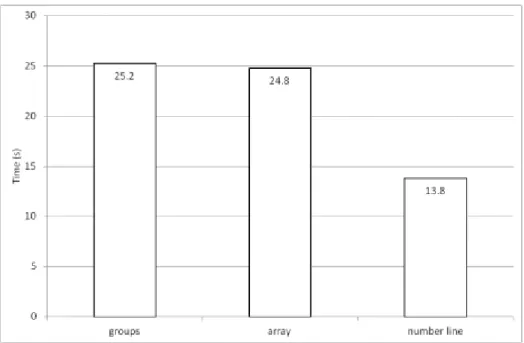
In addition to examining the proportion of correct answers, we also examined the time spent on the different slides by each child. Figure 4 below shows the time spent on each slide averaged over the nine children and averaged over the slides containing a given representation.
(Insert Figure 4 here)
Using one-way ANOVA, we found that the variation over the types of representations was significant at the 5% level (F=8.54, df = 2, p < 0.001). A Bonferroni t comparison was carried out between the three different types of representations which showed that the time for the number lines was significantly different at the 5% level to that of the groups and array representations. There was no significant difference between the groups and the array representations.
Using the eye-tracking software, we could also record the amount of time children spent looking at particular areas of interest (AOI). This allowed us to compare the relative times spent by children on the symbolic representation within each slide (left hand side of the example in Figure 5 – AOI 1) and the time spent on the picture representation (right hand side of the example – AOI 2).
17
The AOIs covered all of each part of the slide so that the sizes of the AOIs could remain the same from slide to slide to aid comparison. Using these AOIs, the percentage of time spent by children on the picture representation in each slide could be calculated. Figure 6 shows the average percentage figure for different slides, averaged over the different children and averaged over the slides containing a given representation.
(Insert Figure 6 here)
Using one-way ANOVA, we found that the variation over the types of representations was significant at the 5% level (F=9.05, df = 2, p < 0.001). A Bonferroni t comparison was carried out between the three different types of representations which showed that the percentage time for the number lines was significantly different at the 5% level to that of the groups and array representations. There was no significant difference between the groups and the array representations.
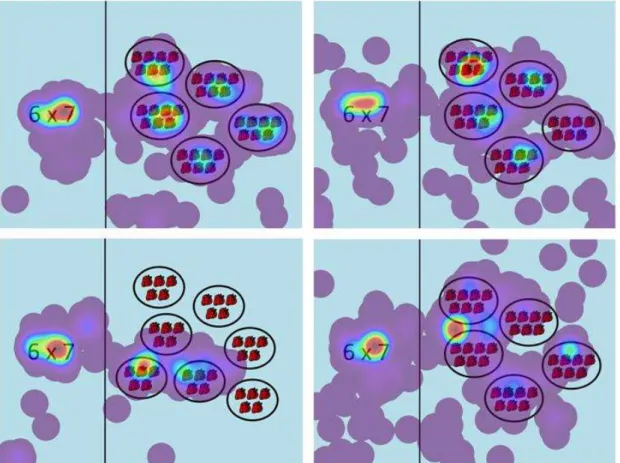
In addition to the quantitative data obtained from the eye-tracking sessions, we examined the results qualitatively by analysing the recordings of the children’s gaze trajectories during each slide. This analysis was carried out collaboratively amongst the researchers and agreement concerning the strategies adopted by children in determining whether the symbolic and the picture representations matched was obtained. The groups representations seemed to elicit three strategies. First, some children counted all the items in each of the groups to determine the total being represented and whether this matched with the total from the symbolic representation (top left of Figure 7 – we present in the paper only static images of heat maps, but the strategies were determined from the videos of heat maps over time of the children examining the representations). Second, some children used a more efficient method where they counted the number of items in one group and then counted the number of groups
18
(top right of Figure 7). Third, some children appeared to first count the items in one group, and if this number did not match either number in the symbolic representation, they knew that the representations did not match and stopped counting (bottom left of Figure 7). Some children used no clear method of discerning what was being represented in the diagrams. Figure 7 below shows examples of heat maps associated with each of these approaches.
(Insert Figure 7 here)
Although the differences between the methods may be difficult to discern from a static heat map, watching a video recording of how the area of focus changes over time easily discriminates between these methods. Table 3 summarises the different approaches used by children for the groups representations. It can be seen that in twenty-six of the cases (48%) children used the counting groups approach, eighteen of the cases were count all (33%), ten (19%) were unclear in the approach and three cases were where the children counted just one group. Three children (3, 4 and 8) used the ‘count all’ approach in the majority of cases, and one child (child 9) was unclear in their approach. It is noted that the higher attaining children (children 1, 2 and 7) seemed to favour the counting groups approach, although this was also the case for the student ranked 7. Only the highest attaining child stayed consistently with the counting groups approach.
(Insert Table 3 here)
We also analysed the approaches adopted by the children while viewing the array representations. First, as was the case for the groups representations, some children counted all the elements in the array whilst trying to match the diagram with the symbolic
19
representation (top left of Figure 8). Second (and more efficiently), some children counted only the elements in the axes – sometimes counting both axes, but also on some occasions counting just one axis when that indicates whether the two representations did not match (top right of Figure 8). Third, as before, in some cases, some children used no clear method whist looking at the arrays. Again, examples of heat maps illustrating these three different approaches are shown in Figure 8. Table 4 summarises the different approaches used by the children with the array representations.
(Insert Figure 8 here)
(Insert Table 4 here)
As can be seen in Table 4, one child used both the counting axes method and the counting all method for a particular array. Overall, children used the efficient counting the axes method in twenty-seven out of fifty-four cases (50%). They also used counting all in sixteen cases (30%) and there was no clear method in twelve cases (22%). Once again, the three highest attaining children (children 1, 2 and 7) were more likely to use the efficient counting axes method although this was also true for child 5. The lower attaining children (6 and 9) in general showed no clear approach in interpreting the arrays.
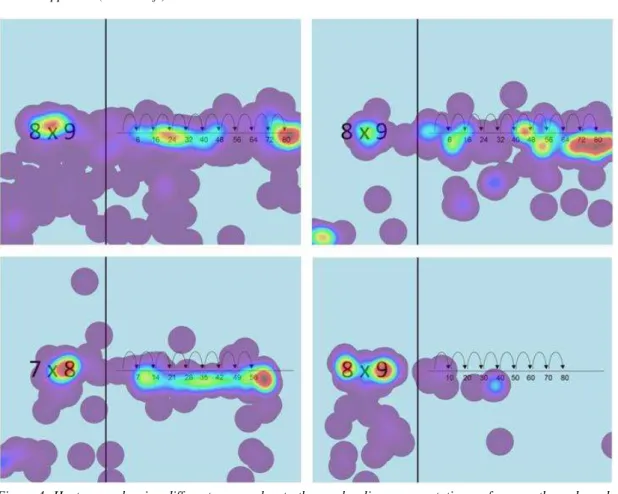
Finally, we looked at data for the number line representations. Three different approaches were identified for the number line. Firstly, children focussed mainly on the final number on the number line and worked out whether this matched the symbolic representation. For one representation, this also included focussing on the number below which did match the symbolic representation. Alternatively, some examined the steps in the number line as well. Finally, in some cases, no clear approach was shown. The heat maps illustrating examples of
20
these different approaches are given in Figure 9. Table 5 provides a summary of the different approaches used by children with the number line.
(Insert Figure 9 here)
(Insert Table 5 here)
From Table 5, we can see that in most cases, children mainly focussed on the last number in the number line, with thirty-six out of fifty-four cases (67%). Alternatively, there were thirteen cases (24%) where children examined the steps involved in the representation, and five cases (9%) where there was no clear strategy used with the number line. There was no clear pattern relating strategy to the attainment of the child.
Discussion
This research explored the use of eye-tracking technology in investigating the way young children view and interpret mathematical representations of multiplication. We discuss the findings below but we first suggest that these need to be considered in the light of a number of important caveats. First, the use of eye-tracking technology is relatively new in the field and so the technology is largely untested, especially with young children. Indeed, one of our aims was to explore the feasibility of this approach in investigating children’s mathematical knowledge and understanding. We discuss the relative strengths and weaknesses of the approach a little later. Second, the sample was small. The children were selected according to their attainment level assessed by their class teacher and only came from one school in the North-East of England. Despite this, based on our experience, we feel that they were not untypical of many children in many other schools in the UK.
21
We begin by reflecting on the previous results and thinking about what they tell us about the different representations of multiplication and whether they support or hinder multiplicative thinking in children. Firstly, the results suggested that the children involved found the number line a more difficult representation to interpret, with a lower average percentage of correct answers. In our results, the analysis of the qualitative data allows us to explain some of the findings from the quantitative data. For example, our analysis of the children’s number line approaches showed that most children focussed mainly on the last number only. This may explain why the average time spent viewing the number lines was lowest of all the representation types. This may also explain the smaller proportion of time spent on the picture representation. Looking more carefully, we could see that this lower percentage of correct answers was due to two particular slides (slides 4 and 17) which the children found most difficult. These are shown in Figure 10.
(Insert Figure 10 here)
It was not clear from the results why there was a lower proportion of correct answers for slide 17. For slide 4 however, there was a clearer possible explanation that emerged. In viewing the number lines, children tended to focus on the last number as a way of deciding whether the symbolic and picture representations matched (see Table 5). For slide 4 however, there was the additional confusion that the correct answer for the symbolic representation (72) was adjacent to the last number. As we saw in Table 5, it was clear from the qualitative results that a number of children focused on the 72, and this may have led to confusion over whether the representations matched or not. We note from Table 5 that almost all of the incorrect responses for this first slide resulted from the strategy that focussed on the last
22
number. This confusion was also reflected in the average length of time spent on slide 4 which was found to be much longer than for the other number lines.
Despite this possible difficulty with the number line, the results suggested that on average, the children spent less time on the number line representations. This impies that possibly in some way, the cognitive load for the pupils had been somehow reduced. This, though, may seem contradictory. However, the analysis of the qualitative data allowed us to explain some of the findings from the quantitative data. For example, our analysis of the children’s number line approaches showed that most children focussed mainly on the last number only. This may explain why the average time spent viewing the number lines was lowest of all the representation types. This may also explain the smaller proportion of time spent on the picture representation. Alseth (1998) highlighted this tendency for children to simply concentrate on the totals represented in a given picture, rather than the mathematical structure represented. This issue seemed to be made more acute with the number lines that we used since they included numbers for each of the jumps. Children therefore were more likely to look simply at the last number, rather then the steps involved in the number line which related to the mathematical structure. For the first of the number line representation however (slide 4), children were focussing on both the final number, and the second to last number which happened to match the symbolic representation. Therefore, some confusion could occur in terms of interpreting the number line in this case. This could explain why this was the item where children obtained the most incorrect answers, and why they took much longer than for the other number lines to identify whether the picture and the symbolic representations matched.
This identification of how children looked at the number line representation also leads us to consider the extent to which the different representations encouraged multiplicative thinking. Given the previous work of Steffe (1994) and Mulligan (2002), we might expect to
23
see some evidence of the children taking into account the iterative groupings within the different representations. In the case of the number line, however, the presence of the numbers seemed to result in children being less likely to consider the iterative steps in the representation. Therefore, the particular format of the number line used in this study appeared not to be a particularly successful representation for encouraging mathematical thinking, with only 24% of the cases where the children possibly considering the iterative steps in the number line.
The other two types of representation were more successful in terms of children considering the iterative groupings within the pictures. In the case of the groups representation, 48% of the cases seemed to involve children taking into account the grouping structure within. For the array, 50% of the cases involved recognition of the column/row grouping within the representation. However, what was clear from analysing the results for these representations was the variation in approaches between children. Battista et al. (1998) and Mulligan (2002) highlighted the issue of lower attaining children being less able to structure representations to emphasise the grouping within multiplication representations. This finding was seemingly confimed in our study, with the higher attaining children more likely to identify the grouping structures within the groups and the array representations. This variation between children was not so apparent for the number line. Once again, this may be because of the tendency for pupils to look for the total number in the representation, so this variation in multiplicative thinking between children may have been overidden by this further tendency with the number line.
The tendency highlighted by Alseth (1998) was also present in the other representations of groups and the array, in the fact that some children, in particular the lower attaining children, counted all the individual elements within the representations. This issue of focussing on the total was not something we set out to examine at the start of the study. Therefore, we did not
24
include slides where the total of the symbolic and picture representations matched, but the mathematical structure differed. However, we can summise from the different approaches adopted by children that this focus on the total rather than the mathematical structure would have been present for some children if we had included these slides as well. What will be interesting to explore in further work will be whether the higher attaining children, when faced with matching totals but non-matching mathematical structures, are confused in any way and which characteristic they choose in deciding whether representations match.
The use of eye-tracking technology alone to investigate children’s reasoning whilst undertaking any mathematical assessment has some limitations. The data produced by the software can only reveal so much concerning children’s different strategies in viewing and interpreting representations. We can observe only where children are looking, not directly examine what they are thinking. Another limitation of eye-tracking research has become known as the dissociation problem. This refers to the phenomenon where one can visually fixate on a specific area of a stimulus whilst also simultaneously paying attention to another area. This means we can never fully know what the brain is taking in simply by tracking and analysing eye movement (see Posner, Snyder, and Davidson 1980). Consequently, we feel it will be important in future studies to supplement the eye-tracking data with additional questions during the research. This obviously has to be balanced against the need for such questions to be as unobtrusive as possible so as not to interfere with performance on the task at hand. Despite these limitations, we feel that eye-tracking technology holds much promise for research in the field of mathematics education. The ability to capture and record a child’s focus of attention whilst undertaking an assessment task will have a multitude of uses in many areas of mathematics education. We highlight two specific advantages of this approach both from a research and an educational perspective. Firstly, in trying to gain access to children’s mathematical thinking during tasks, the most common approach has been the use
25
of task-based interviews. However, Davis (1984) highlighted the difficulties with task-based interviews that interviewers might unconsciously encourage pupils to succeed in the task given. In addition, although task-based interviews do allow us to probe deeply into children’s understanding, this probing may result in the children reflecting the researcher’s ideas rather than their own. The use of eye-tracking technology allows us to largely avoid these difficulties, therefore providing an alternative approach to examining mathematical thinking. As highlighted above, in future studies, we can combine eye tracking and interviews in order to triangulate our findings. A second advantage is the possibilities of presenting the findings in a visual format, particularly with teachers. The video recordings showing the movement of children’s attention through heat maps over time can be used to illustrate in a visual way the possible difficulties that children may have with their mathematical thinking, in this case with the interpretation of representations of multiplication. Therefore, the results of eye-tracking studies can also be used to enhance teacher training and professional development in mathematics education, in this particular case around children’s interpretations of mathematical representations.
In addition to the use of eye-tracking technology generally in mathematics education research, we propose that this study has also demonstrated the use of modern eye-tracking technology outside the clinical environment of the laboratory, and in the more informal environment of the school classroom. For use with younger children as was the case in this study, the table-mounted system proved to be easy to set up and use, as highlighted by Duchowski (2007). However, there is one note of caution that we would bring to the attention of other researchers. One child in the study had a strong tendency to lean towards the monitor screen when viewing the representations and we were concerned that this might affect the accuracy of the calibration carried out for the eye-tracking. As it was, this was not the case and so did not affect the results of our study, particularly with the general categorisation of
26
the types of strategies adopted by children when looking at the representations. However, for studies requiring more precision concerning the focus of children’s gaze (e.g. with any study involving reading), it may be necessary to have greater control over the movement of the head. In future studies, we may do this in an informal way (e.g. with children resting their chins on their hands as they lean on the table), and assess the effectiveness of such an approach.
Conclusion
We have shown that eye-tracking technology can be a useful tool in helping investigate young children’s focus of attention whilst undertaking a mathematics assessment task. Specifically, we have shown how the approach can help in discovering how young children view and interpret mathematical representations of multiplication. The data suggested that the particular form of the number line used in this study was less successful than the other picture representations for promoting mathematical thinking in children. Also, the success of children to think multiplicatively with the groups and the array representation was related to their general mathematics attainment levels. These findings have implications for teacher practice in that teachers need to be clear about the possible drawbacks to particular representations. Even in using more successful representations, for lower attaining children, the progression in their understanding of the representation needs to be taken into account by the teacher (Barmby et al., 2013). For example, in presenting the picture representations to children, the teacher can emphasise strongly the grouping within the pictures, and therefore support children to progress in terms of their multiplicative thinking.
The study also gives implications for future research in this area. Firstly, the study has provided evidence that eye-tracking technology, even in the informal setting of a school classroom, can be successfully used with younger children. However, we have identified
27
possible improvements to this set up, and this will provide the basis for further eye-tracking studies with young children in the primary (elementary) school context. This will not only be in relation to representations of multiplication (with a proposed study to look at representations with equal totals but different mathematical structures), but also looking at other relevant areas of the early school curriculum that lend themselves to a visual context, for example number patterns, geometry and fractions.
References
Alseth, B. 1998. “Children’s perception of multiplicative structure in diagrams”. In
Proceedings of the 37th Conference of the International Group for the Psychology of Mathematics Education (Vol. 2), edited by A. Olivier and K. Newstead, 9-16. Stellenbosch. South Africa: PME
Andrà, C., F. Arzarello, F. Ferrara, K. Holmqvist, P. Lindström, O. Robutti, and C. Sabena. 2009. “How students read mathematical representations: An eye tracking study”. In
Proceedings of the 33rd Conference of the International Group for the Psychology of Mathematics Education, edited by M. Tzekaki, M. Kaldrimidou and C. Sakonidis, 123-131. Thessaloniki, Greece: PME.
Andrà, C., P. Lindström, F. Arzarello, K. Holmqvist, O. Robutti, and C. Sabena. 2014. "Reading mathematics representations: An eye-tracking study." International Journal of Mathematics and Science Education 12 (2): 1-23.
Anghileri, J. 2000. Teaching number sense. London: Continuum.
Ball, D. L., M. H. Thames, and G. Phelps. 2008. "Content knowledge for teaching: What makes it special?" Journal of Teacher Education 59 (5): 389-407.
Barmby, P., D. S. Bolden, S. Raine, and L. Thompson. 2013. "Developing the use of diagrammatic representations in primary mathematics classroom through professional development." Educational Research 55 (3): 263-290.
Barmby, P., T. Harries, S. Higgins, and J. Suggate. 2009. "The array representation and primary children's understanding and reasoning in multiplication." Educational Studies in Mathematics 70 (3): 217-241.
Battista, M. T., D. H. Clements, J. Arnoff, K. Battista, and C. V. A. Borrow. 1998. "Students' spatial structuring of 2D arrays of squares." Journal for Research in Mathematics Education 29: 503-532.
Bolden, D, P. Barmby, and T. Harries. 2013. "A representational approach to developing primary ITT students' confidence in their mathematics." International Journal of Mathematical Education in Science and Technology 44 (1): 70-83.
Brophy, J. 1991. "Conclusion." In Advances in research on teaching, edited by J. Brophy, 349-364. Greenwich, CT.: JAI Press.
28
Cobb, P., E. Yackel, and T. Wood. 1992. "A constructivist alternative to the representational view of mind in mathematics education." Journal for Research in Mathematics Education 23 (1): 2-33.
Davis, R. B. 1984. Learning mathematics: The cognitive approach to mathematics education. London: Croom Helm.
De Corte, E., L. Verschaffel, and A. Pauwels. 1990. "Influence of the semantic structure of word problems on second graders' eye movements." Journal of Educational Psychology 82(2): 359-365.
DeWolf, T., W. Van Dooren, F. Hermens, and L. Verschaffel. 2013. “Do students attend to and profit from representational illustrations of non-standard mathematical word problems?” In Proceedings of the37th Conference of the International Group for the Psychology of Mathematics Education (Vol. 2), edited by A. M. Lindmeier and A. Heinze, 214-224. Kiel, Germany: PME.
Duchowski, A. T. 2002. "A breadth-first survey of eye-tracking applications." Behavior Research Methods, Instruments, & Computers 34 (4): 455-470.
Duchowski, A. T. 2007. Eye Tracking Technology. London: Springer.
Duval, R. 1999. “Representation, vision and visualization: Cognitive functions in mathematical thinking”. In Proceedings of the 21st North American PME Conference
(Vol. 1), edited by F. Hitt and M. Santos, 3-26.
Epelboim, J., and P. Suppes. 2001. "A model of eye movements and visual working memory during problem solving in geometry." Vision Research 41 (12): 1561-1574.
Greeno, J. G., and R. P. Hall. 1997. "Practicing representation: Learning with and about representational forms." Phi Delta Kappan 78 (5): 361-367.
Greer, B. 1992. "Multiplication and division as models of situations." In Handbook of research on mathematics teaching and learning, edited by D.A. Grouws, 276-295. New York: Macmillan.
Hall, N. 1998. "Concrete representations and procedural analogy theory." Journal of Mathematical Behavior 117 (1): 33-51.
Hegarty, M., R. E. Mayer, and C. E. Green. 1992. "Comprehension of arithmetic word problems: Evidence from students' eye fixations." Journal of Educational Psychology
84 (1): 76-84.
Hegarty, M., R. Mayer, and C. Monk. 1995. "Comprehension of arithmetic word problems: a comparison of successful and unsuccessful problem solvers." Journal of Educational Psychology 87 (1): 18-32.
Hiebert, J., and T. P. Carpenter. 1992. "Learning and teaching with understanding." In
Handbook of Research on Mathematics Teaching and Learning, edited by D. A. Grouws, 65-97. New york: Macmillan.
Holmqvist, K., M. Nyström, R. Andersson, R. Dewhurst, H. Jarodzka and J. Van de Weijer. 2011. Eye tracking: A comprehensive guide to methods and measures. Oxford: Oxford University Press.
Kaput, J. J. 1991. "Notations and representations as mediators of constructive process." In
Radical Constructivism in Mathematics Education, edited by E. von Glasersfeld, 53-74. Dordrecht: Kluwer.
Kennedy, A. 1992. "The spatial coding hypothesis." In Eye movements and visual cognition: Scene perception and reading, edited by K. Rayner, 379-396. New York: Springer-Verlag.
Leinhardt, G., R. T. Putnam, M. K. Stein, and J. Baxter. 1991. "Where subject knowledge matters." In Advances in Research on Teaching: Vol. 2. Teachers' Knowledge of Subject matter as it Relates to their Teaching Practice, edited by J. Brophy, 87-113. Greenwich: JAI Press.
29
Lesh, R., M. Landau, and E. Hamilton. 1983. "Conceptual models and applied mathematical problem-solving research." In Acquisition of Mathematics Concepts and Processes, edited by R. Lesh and M. Landau, 263-343. Orlando, Florida: Academic Press.
Moeller, K., S. Neuburger, L. Kaufmann, K. Landerl, and H-C. Nuerk. 2009. "Basic number processing deficits in developmental dyscalculia: Evidence from eye tracking."
Cognitive Development 24 (4): 371-386.
Mulligan, J. T. 2002. “The role of structure in children’s development of multiplicative reasoning”. In Proceedings of the 25th Annual Conference of the Mathematics Education Research Group of Australasia, edited by B. Barton, K. C. Irwin, M. Pfannkuch, and M. O. J. Thomas, 497-503. Auckland, New Zealand: MERGA.
Pape, S. J., and M.A. Tchoshanov. 2001. "The role of representation(s) in developing mathematical understanding." Theory into Practice 40 (2): 118-127.
Perkins, D. N., and C. Unger. 1994. "A new look in representations for mathematics and science learning." Instructional Science 22 (1): 1-37.
Posner, M. I., C. R. R. Snyder, and B. J. Davidson. 1980. "Attention and the detection of signals." Journal of Experimental Psychology 109 (2): 160-174.
Post, T. R., and K. A. Cramer. 1989. "Knowledge, representation, and quantitative thinking." In Knowledge Base for the Beginning Teacher, edited by M. C. Reynolds, 221-232. New York: Pergamon.
Rayner, K. 1992. Eye movements and visual cognition: Scene perception and reading. New York: Springer-Verlag.
Rayner, K. 1998. "Eye movements in reading and information processing: 20 years of research." Psychological Bulletin 124 (3): 372-422.
Shulman, L. S. 1986. "Those who understand: Knowledge growth in teaching." Educational Researcher 15 (2): 4-14.
Shvarts, A., and D. Cumachenko. 2013. “Eye tracking research of novice expert difference in multi-representational learning”. Poster presented at the 37th Conference of the International Group for the Psychology of Mathematics Education. Kiel, Germany. Skemp, R. 1986. The psychology of learning mathematics. Harmondsworth: Penguin Books. Sophian, C., and M. E. Crosby. 2008. "What eye fixation patterns tell us about subitizing."
Developmental Neuropsychology 33 (3): 394-409.
Steffe, L. 1994. "Children's multiplying schemes." In The development of multiplicative thinking in the learning of mathematics, edited by G. Harel and J. Confrey, 3-40. New York: State University of New York Press.
Suppes, P. 1990. "Eye-movement models for arithmetic and reading performance." In Eye movements and their role in visual and cognitive processes, edited by E. Knowler, 455-477. Amsterdam: Elsevier.
Suppes, P., M. Cohen, R. Laddaga, J. Anliker, and R. Floyd. 1983. "A procedural theory of eye movements in doing arithmetic." Journal of Mathematical Psychology 27 (4): 341-369.
Verschaffel, L., E. De Corte, T. de Jong, and J. Elen. 2010. Use of representations in reasoning and problem solving: Analysis and improvement. Abingdon, Oxon: Routledge.
Verschaffel, L., E. De Corte, and A. Pauwels. 1992. "Solving compare problems: An eye movement test of Lewis and Mayer's consistency hypothesis." Journal of Educational Psychology 84 (1): 85-94.
Vosniadou, S. 2010. "Instructional considerations in the use of external representations: The distinction between perceptually based depictions and pictures that represent conceptual models." In Use of representations in reasoning and problem solving:
30
Analysis and improvement, edited by L. Verschaffel, E. De Corte, T. de Jong and J. Elen, 36-54. Abingdon, Oxon: Routledge.
Zhang, J. 1997. “The nature of external representations in problem solving”. Cognitive science 21 (2): 179-217.
31 Figure 1: A picture of the set up – the eye-tracker bar was located beneath the monitor
Figure 2: Slides with different types of picture representations (left to right: ‘groups’, ‘array’, ‘number line’ representations)
32 Figure 4: Average time per type of representation
33 Figure 6: Percentage of time spent on each type of picture representation
Figure 3: Heat maps showing different approaches to groups representations - count all (top left), count groups (top right), count one group (bottom left) and no clear approach (bottom right)
34 Figure 8: Heat maps showing different approaches to array representations - count all (top left), count axes (top right), and no clear approach (bottom left)
Figure 4: Heat maps showing different approaches to the number line representations – focus on the end number (top left and including the second to last number (top right), looking at the steps (bottom left) and no clear approach (bottom right)
35 Figure 10: Slides 4 and 17 containing number lines
36 Table 1: Details of the slides used
Type Match? Orientation Calculation Slide no.
groups Above Lots of 7 × 8 18
groups Above Traditional 8 × 9 14
groups Below Lots of 6 × 7 2
groups Below Traditional 6 × 7 15
groups Match Lots of 8 × 9 5
groups Match Traditional 7 × 8 8
Array Above Lots of 7 × 8 6
Array Above Traditional 7 × 8 11
Array Below Lots of 6 × 7 9
Array Below Traditional 6 × 7 3
Array Match Lots of 8 × 9 19
Array Match Traditional 8 × 9 12
number Above Lots of 8 × 9 13
number Above Traditional 8 × 9 4
number Below Lots of 7 × 8 17
number Below Traditional 6 × 7 16
number Match Lots of 6 × 7 10
number Match Traditional 7 × 8 7
Table 2: Proportion of correct answers against teacher assessment of attainment
Child Level Ranking (from teacher levels) Proportion of correct answers
1 5c 1 0.94 2 4a 2 0.78 3 4c 4 0.94 4 3a 5 0.72 5 3b 7 0.89 6 2a/3c 9 0.33 7 4a 2 0.94 8 3b/3a 6 0.78 9 3c 8 0.39
37 Table 3: Approaches used by children to examine the groups representations – incorrect responses are shaded
Child Ranking (teacher levels) 6x7 with 7x5 8x9 with 9x8 7x8 with 7x8 8x9 with 8x10 6x7 with 5x7 7x8 with 9x7
1 1 Groups Groups Groups Groups Groups Groups
2 2 Groups All All Groups Groups Groups
3 4 All All All All Groups One group
4 5 All All All All Groups All
5 7 Unclear Groups Groups Groups One group All
6 9 Groups Unclear Groups Unclear All One group
7 2 Groups Groups Groups All Groups Groups
8 6 Groups All All Groups All All
9 8 Groups Unclear Groups Unclear Unclear Unclear
Table 4: Approaches used by children to examine the array representations – incorrect responses are shaded
Child Ranking (teacher levels) 6x7 with 5x7 7x8 with 9x7 6x7 with 7x5 7x8 with 7x9 8x9 with 8x9 8x9 with 9x8
1 1 Axes Axes Axes Axes Axes Axes
2 2 All Axes Axes Axes Axes Axes
3 4 All All All All All All
4 5 All All Axes All All Axes/All
5 7 Axes Axes Axes Axes Axes Axes
6 9 Unclear Unclear Axes Unclear Unclear Unclear
7 2 All Axes Axes Axes Axes Axes
8 6 All All Axes Axes All Unclear
9 8 Unclear Unclear Unclear Unclear Unclear Unclear
Table 5: Approaches used by children to examine the number line representations – incorrect responses are shaded
Child Ranking (teacher levels) 8x9 with 8x10 7x8 with 7x8 6x7 with 7x6 8x9 with 10x8 6x7 with 5x7 7x8 with 8x6
1 1 Last Last Last Last Last Last
2 2
Last (and
second to last) Steps Steps Steps Steps Steps
3 4 Last Steps Last Last Last Last
4 5 Last Last Last Last Last Last
5 7 Last Unclear Last Steps Last Last
6 9 Steps Unclear Unclear Steps Steps Steps
7 2 Last Last Last Last Steps Last
8 6
Last (and
second to last) Last Last Last Last Unclear