CONTROL CHARTS WITH ESTIMATED
PROCESS PARAMETERS AND A PROPOSED
COEFFICIENT OF VARIATION CHART
YOU HUAY WOON
UNIVERSITI SAINS MALAYSIA
2015
CONTROL CHARTS WITH ESTIMATED
PROCESS PARAMETERS AND A PROPOSED
COEFFICIENT OF VARIATION CHART
by
YOU HUAY WOON
Thesis submitted in fulfillment of the requirements for the degree of
Doctor of Philosophy
ii
ACKNOWLEDGEMENTS
First and foremost, I wish to acknowledge my deepest gratitude to my supervisor, Professor Michael Khoo Boon Chong from the School of Mathematical Sciences, Universiti Sains Malaysia (USM) who has guided me throughout my Ph.D. study with his constant supervision and insightful comments. I have acquired invaluable knowledge on Statistical Quality Control and useful research skills from Professor Michael Khoo Boon Chong. His encouragement and guidance has contributed to the completion of this thesis. I am also grateful to Professor Michael Khoo Boon Chong for providing me with the opportunity to work as a graduate research assistant before I was awarded the MyBrain15 scholarship.
I would like to express my sincere thanks to the Ministry of Education Malaysia (KPM) for providing me with the financial support under the MyBrain15 program throughout my Ph.D. study, which has allowed me to fully concentrate on my research.
My cordial thanks is extended to the Dean of the School of Mathematical Sciences, USM, Professor Ahmad Izani Md. Ismail for his assistance and support towards my postgraduate study. In addition, I am appreciative of the lecturers and staff of the School of Mathematical Sciences for providing useful advice and technical support.
I am grateful to my beloved family members for always standing by me through thick and thin. They have always supported me with their words of encouragement and best wishes during my study.
iii
I also wish to express my gratefulness to all my friends for their kindness and moral support during my study. Last but not least, I thank all who have indirectly contributed to the completion of this thesis. Thank you very much.
iv
TABLE OF CONTENTS
Page
ACKNOWLEDGEMENTS ii
TABLE OF CONTENTS iv
LIST OF TABLES vii
LIST OF FIGURES ix
LIST OF ABBREVIATIONS x
LIST OF NOTATIONS xii
LIST OF PUBLICATIONS xvii
ABSTRAK xviii
ABSTRACT xx
CHAPTER 1: INTRODUCTION
1.1 Background of Statistical Quality Control 1 1.2 Control Charts and their Applications 3
1.3 Problem Statement 9
1.4 Objectives of the Thesis 11
1.5 Organization of the Thesis 11
CHAPTER 2: A REVIEW ON RELATED CONTROL CHARTS AND THEIR PERFORMANCE MEASURES
2.1 Introduction 14
2.2 Synthetic Type Control Charts 15
2.3 Group Runs Type Control Charts 18
2.4 Double Sampling Type Control Charts 21
v
2.6 Performance Measures for a Control Chart 25 2.6.1 Average Run Length (ARL) 25 2.6.2 Standard Deviation of the Run Length (SDRL) 26 2.6.3 Average Number of Observations to Signal (ANOS) 27
CHAPTER 3: A REVIEW ON SSGR, SDS AND EXISTING CV CONTROL CHARTS WHEN PROCESS PARAMETERS ARE KNOWN
3.1 Introduction 29
3.2 A Review on Side Sensitive Group Runs (SSGR) Chart 30 3.3 A Review on Synthetic Double Sampling (SDS) Chart 38 3.4 A Review on Coefficient of Variation (CV) Charts 43
3.4.1 Shewhart CV Chart 44
3.4.2 Runs Rule CV (RR CV) Chart 47 3.4.3 Synthetic CV (Syn CV) Chart 50 3.4.4 Exponentially Weighted Moving Average CV (EWMA CV)
Chart
52
CHAPTER 4: PROPOSED OPTIMAL DESIGNS AND PERFORMANCE EVALUATIONS OF THE SSGR AND SDS CONTROL CHARTS WHEN PROCESS PARAMETERS ARE ESTIMATED
4.1 Introduction 55
4.2 SSGR Chart 57
4.3 SDS Chart 69
4.4 Example of Applications 84
4.4.1 An Illustrative Example for the SSGR Chart 85 4.4.2 An Illustrative Example for the SDS Chart 92
vi
CHAPTER 5: THE PROPOSED SSGR CV CHART
5.1 Introduction 99
5.2 Implementation of the SSGR CV Chart 101
5.3 Optimal Design of the SSGR CV Chart 106
5.4 A Performance Comparison of the SSGR CV Chart with Existing CV Charts
110
5.5 An Example of Application 116
CHAPTER 6: CONCLUSIONS
6.1 Introduction 121
6.2 Contributions of the Thesis 122
6.3 Suggestions for Further Research 124
REFERENCES 128
APPENDIX A 135
vii
LIST OF TABLES
Page Table 3.1 Description of the outcome of a sample 35 Table 3.2 The states of the SSGR chart when J12 36 Table 4.1
ARL ,SDRL1 1
for the SSGR chart with estimated processparameters for different combinations of ( , , )m n using the optimal charting parameters
K J, 1
of the SSGR chart with known process parameters, based on minimizing ARL1, when0
ARL 370.4
62
Table 4.2 Optimal charting parameters
K , J1
of the SSGR chart with estimated process parameters and the corresponding
ARL ,SDRL1 1
for different combinations of ( , , ),m n based on minimizing ARL1, when ARL0 370.467
Table 4.3
ANOS , ARL ,SDRL1 1 1
for the SDS chart with estimated process parameters, for different combinations of ( , , )m n using the optimal charting parameters
n n L L L J1, 2, 1, 2, 3, 2
of the SDS chart with known process parameters when0
ANOS 370.4
76
Table 4.4 Optimal charting parameters
n n L L L J1 , 2, 1, 2, 3, 2
of the SDS chart with estimated process parameters and the corresponding
ANOS , ARL ,SDRL values when 1 1 1
ANOS0 370.482
Table 4.5 Summary statistics of the Phase-I data for an illustrative example for the SSGR chart
86
Table 4.6 Summary statistics of the Phase-II data for an illustrative example for the SSGR chart
90
Table 4.7 Summary statistics of the Phase-I data for an illustrative example for the SDS chart
94
Table 4.8 Summary statistics of the Phase-II data for an illustrative example for the SDS chart
97
viii
Table 5.2 Optimal control limits of the SSGR CV chart when n = 5,
0 {0.05, 0.10, 0.15, 0.20}
and ARL0 370.4
109
Table 5.3 Optimal control limits of the SSGR CV chart when n = 10,
0 {0.05, 0.10, 0.15, 0.20}
and ARL0 370.4
109
Table 5.4 Optimal control limits of the SSGR CV chart when n = 15,
0 {0.05, 0.10, 0.15, 0.20}
and ARL0 370.4
110
Table 5.5
ARL ,SDRL1 1
for various CV charts when n = 5,0 {0.05, 0.10, 0.15, 0.20}
and ARL0 370.4
112
Table 5.6
ARL ,SDRL1 1
for various CV charts when n = 10,0 {0.05, 0.10, 0.15, 0.20}
and ARL0 370.4
113
Table 5.7
ARL ,SDRL1 1
for various CV charts when n = 15,0 {0.05, 0.10, 0.15, 0.20}
and ARL0 370.4
114
ix
LIST OF FIGURES
Page
Figure 1.1 A typical X chart 4
Figure 3.1 CRL values 32
Figure 3.2 DS sub-chart of the SDS chart 39 Figure 3.3 The interval between LCL and UCL partitioned into p2eo 1
subintervals, each with width of 2q
54
Figure 4.1 Bonferroni adjusted X chart for the SSGR chart 88 Figure 4.2 Bonferroni adjusted S chart for the SSGR chart 89 Figure 4.3 Shewhart X sub-chart of the SSGR chart 90
Figure 4.4 CRL sub-chart of the SSGR chart 91
Figure 4.5 Bonferroni adjusted X chart for the SDS chart 95 Figure 4.6 Bonferroni adjusted S chart for the SDS chart 95
Figure 4.7 DS sub-chart of the SDS chart 98
Figure 4.8 CRL sub-chart of the SDS chart 98
Figure 5.1 CV sub-chart of the SSGR CV chart for the Phase-I data 118 Figure 5.2 CV sub-chart of the SSGR CV chart for the Phase-II data 119 Figure 5.3 CRL sub-chart of the SSGR CV chart for the Phase-II data 120
x
LIST OF ABBREVIATIONS
The abbreviations used in this thesis are presented as follows: Abbreviations Details
AEQL Average extra quadratic loss
ANOS Average number of observations to signal
0
ANOS In-control average number of observations to signal
1
ANOS Out-of-control average number of observations to signal ARL Average run length
0
ARL In-control average run length
1
ARL Out-of-control average run length ASS Average sample size
ATS Average time to signal
cdf Cumulative distribution function
CL Center line
CRL Conforming run length CUSUM Cumulative sum CV Coefficient of variation
2
CV Coefficient of variation squared
DS Double sampling
DSVSI Double sampling variable sampling interval EWMA Exponentially weighted moving average FAP False alarm probability
GR Group runs
xi LCL Lower control limit LWL Lower warning limit MGR Modified group runs MRL Median run length
pdf Probability density function RR CV Runs rule coefficient of variation SAS Statistical Analysis System
SDRL Standard deviation of the run length
0
SDRL In-control standard deviation of the run length
1
SDRL Out-of-control standard deviation of the run length SDS Synthetic double sampling
SPC Statistical Process Control SQC Statistical Quality Control SSGR Side sensitive group runs
SSMGR Side sensitive modified group runs Syn CV Synthetic coefficient of variation tpm Transition probability matrix TS Triple sampling
TV Time variant
UCL Upper control limit UGR Unit and group runs UWL Upper warning limit VP Variable parameters
xii
LIST OF NOTATIONS
The notations used in this thesis are presented as follows: Notations Details
m Number of in-control Phase-I samples
n Sample size
Size of a standardized mean shift
0
In-control mean
0
ˆ
An estimator of the in-control mean
1
Out-of-control mean
0
In-control standard deviation
0
ˆ
An estimator of the in-control standard deviation Size of a coefficient of variation shift
0
In-control coefficient of variation
1
Out-of-control coefficient of variation
0 ˆ
Mean of the sample coefficient of variation
0 ˆ
Standard deviation of the sample coefficient of variation
0
Type-I error probability
( ) Cumulative distribution function of a standard normal random variable
( )
Probability density function of a standard normal random variable
. ,
t
F a Cumulative distribution function of a noncentral t random
variable with a degrees of freedom and noncentrality parameter
xiii
1 . , t
F a Inverse cumulative distribution function of a noncentral t
random variable with a degrees of freedom and noncentrality parameter
Q Transition probability matrix for the transient states ˆ
Q Transition probability matrix for the transient states with estimated process parameters
q Initial probability vector
G Transition probability matrix with transient and absorbing states
I Identity matrix
0 A vector with all elements of zeros 1 A vector with all elements of ones SSGR Chart
K Design constant of the Shewhart X sub-chart for the SSGR
chart
K Design constant of the Shewhart X sub-chart for the SSGR chart with estimated process parameters
1
J Lower control limit of the extended version of the CRL sub-chart for the SSGR chart
1
J Lower control limit of the extended version of the CRL
sub-chart for the SSGR chart with estimated process parameters
1
Probability of a conforming sample on the Shewhart X
sub-chart for the SSGR chart
1 ˆ
Probability of a conforming sample on the Shewhart X
sub-chart for the SSGR chart with estimated process parameters
1
P Probability of a nonconforming sample on the Shewhart X
sub-chart for the SSGR chart
1 ˆ
P Probability of a nonconforming sample on the Shewhart X
sub-chart for the SSGR chart with estimated process parameters
A Probability of the event CRLr J1 for the SSGR chart
ˆ
A Probability of the event CRLr J1 for the SSGR chart with estimated process parameters
xiv
h Conditional probability of the event
X UCL X[LCL, UCL]
for the SSGR chart ˆh Conditional probability of the event
X UCL X[LCL, UCL]
for the SSGR chart with estimated process parametersSDS Chart
1
L Warning limit based on the first sample on the DS sub-chart for the SDS chart
1
L Warning limit based on the first sample on the DS sub-chart for the SDS chart with estimated process parameters
2
L Control limit based on the first sample on the DS sub-chart for the SDS chart
2
L Control limit based on the first sample on the DS sub-chart for the SDS chart with estimated process parameters
3
L Control limit based on the combined samples on the DS sub-chart for the SDS chart
3
L Control limit based on the combined samples on the DS sub-chart for the SDS chart with estimated process parameters
2
J Lower control limit of the CRL sub-chart for the SDS chart
2
J Lower control limit of the CRL sub-chart for the SDS chart with estimated process parameters
1
n Size of the first sample on the DS sub-chart for the SDS chart
1
n Size of the first sample on the DS sub-chart for the SDS chart with estimated process parameters
2
n Size of the second sample on the DS sub-chart for the SDS chart
2
n Size of the second sample on the DS sub-chart for the SDS chart with estimated process parameters
1,i
Z Standardized statistic for the first sample on the DS sub-chart for the SDS chart
1, ˆ
i
Z Standardized statistic for the first sample on the DS sub-chart for the SDS chart with estimated process parameters
xv 2,
ˆ i
Z Standardized statistic for the second sample on the DS
sub-chart for the SDS chart with estimated process parameters
i
Z Standardized statistic for the combined samples on the DS sub-chart for the SDS chart
ˆ i
Z Standardized statistic for the combined samples on the DS sub-chart for the SDS chart with estimated process parameters
1 a
Probability of declaring a conforming sampling stage based on the first sample on the DS sub-chart for the SDS chart
1 ˆ
a
Probability of declaring a conforming sampling stage based on the first sample on the DS sub-chart for the SDS chart with estimated process parameters
2 a
Probability of declaring a conforming sampling stage based on the combined samples on the DS sub-chart for the SDS chart
2 ˆ
a
Probability of declaring a conforming sampling stage based on the combined samples on the DS sub-chart for the SDS chart with estimated process parameters
2
Probability of a conforming sampling stage on the DS sub-chart for the SDS chart
2
P Probability of a nonconforming sampling stage on the DS sub-chart for the SDS chart
2 ˆ
P Probability of a nonconforming sampling stage on the DS sub-chart for the SDS chart with estimated process parameters Shewhart CV Chart
OOC
P Probability of an out-of-control signal on the Shewhart CV chart
RR CV Chart
B Charting parameter of the RR CV chart
2,3
B Charting parameter of the 2-out-of-3 RR CV chart
3,4
B Charting parameter of the 3-out-of-4 RR CV chart
4,5
xvi Syn CV Chart
3
J Lower control limit of the CRL sub-chart for the Syn CV chart
3
Probability of a conforming sample on the CV sub-chart for the Syn CV chart
3
P Probability of a nonconforming sample on the CV sub-chart for the Syn CV chart
EWMA CV Chart
Smoothing constant of the EWMA CV chart
M Design constant of the EWMA CV chart SSGR CV
4
J Lower control limit of the extended version of the CRL sub-chart for the SSGR CV chart
4
Probability of a conforming sample on the CV sub-chart for the SSGR CV chart
4
P Probability of a nonconforming sample on the CV sub-chart for the SSGR CV chart
C Probability of the event CRLr J4 for the SSGR CV chart
d Conditional probability of the event
ˆUCLˆ[LCL, UCL]
for the SSGR CV chartxvii
LIST OF PUBLICATIONS
Journals
1. You, H.W., Khoo, M.B.C., Castagliola, P. and Ou, Y. (2015). Side sensitive group runs X chart with estimated process parameters. Computational Statistics (published on-line), DOI 10.1007/s00180-015-0573-y
2. You, H.W., Khoo, M.B.C., Lee, M.H. and Castagliola, P. (2015). Synthetic double sampling X chart with estimated process parameters. Quality Technology and Quantitative Management, Vol. 12 No. 4.
3. You, H.W., Khoo, M.B.C., Castagliola, P. and Haq, A. Monitoring the coefficient of variation using the side sensitive group runs chart. Quality and Reliability Engineering International (submitted in 2015).
Proceedings
1. You, H.W. and Khoo, M.B.C. (2014). Effects of parameter estimation on the group runs control chart. AIP Conference Proceedings Series for 21st National Symposium on Mathematical Sciences (SKSM21), pp 1056-1060. 2. You, H.W., Khoo, M.B.C. and Teh, S.Y. A study on the performance of
synthetic type charts when process parameters are estimated. AIP Conference Proceedings Series for 22nd National Symposium on Mathematical Sciences (SKSM22), accepted in 2015.
xviii
CARTA KAWALAN DENGAN PARAMETER PROSES YANG DIANGGARKAN DAN CADANGAN SUATU CARTA UNTUK PEKALI
UBAHAN ABSTRAK
Carta kawalan menerima perhatian besar dalam Kawalan Proses Berstatistik (SPC) sebagai alat yang paling berguna dalam pengesanan anjakan proses supaya tindakan pembetulan boleh diambil untuk mengenal pasti dan menyingkirkan sebab-sebab terumpukkan yang hadir. Objektif utama penyelidikan ini adalah untuk menangani masalah anggaran parameter proses bagi carta larian kumpulan dengan kepekaan sisi (carta SSGR) dan carta pensampelan ganda dua sintetik (carta SDS). Kebanyakan carta kawalan memerlukan andaian bahawa nilai sasaran parameter proses dalam kawalan, iaitu min dan sisihan piawai adalah diketahui untuk pengiraan had-had kawalan serta statistik carta kawalan. Malangnya, parameter proses lazimnya tidak diketahui dalam keadaan sebenar, yang mana nilainya dianggarkan daripada set data Fasa-I dalam kawalan. Dalam penyelidikan ini, prestasi carta-carta SSGR dan SDS dengan parameter proses yang dianggarkan dibandingkan dengan prestasi carta-carta yang sepadan apabila parameter proses diketahui. Hasil kajian menunjukkan bahawa prestasi carta-carta SSGR dan SDS berbeza apabila parameter proses diketahui dan apabila parameter proses dianggarkan. Ini adalah kerana kewujudan variasi dalam anggaran parameter proses. Sehubungan ini, reka bentuk pengoptimuman untuk carta-carta SSGR dan SDS berdasarkan parameter proses yang dianggarkan telah dibangunkan untuk menyelesaikan kesan variasi akibat penganggaran parameter proses. Parameter carta optimum boleh dikira dengan menggunakan reka bentuk pengoptimuman yang baru dibangunkan supaya carta-carta SSGR dan SDS berdasarkan parameter proses yang dianggarkan mempunyai prestasi yang setara dengan carta-carta SSGR dan SDS berdasarkan
xix
parameter proses yang diketahui. Contoh-contoh diberikan untuk menunjukkan aplikasi carta-carta SSGR dan SDS optimum berdasarkan parameter proses yang dianggarkan. Satu lagi objektif penyelidikan ini adalah untuk mencadangkan carta pekali ubahan SSGR (carta SSGR CV). Dalam banyak keadaan, min dan sisihan piawai bukan malar. Sebaliknya, sisihan piawai adalah berkadaran dengan min. Dalam senario sedemikian, pemantauan pekali ubahan (CV) adalah lebih bermakna. Prosedur pelaksanaan dan reka bentuk pengoptimuman carta SSGR CV dibentangkan dalam tesis ini. Prestasi carta SSGR CV dibandingkan dengan prestasi semua carta CV sedia ada. Keputusan menunjukkan bahawa carta SSGR CV mempunyai prestasi yang lebih baik daripada semua carta CV sedia ada yang dibandingkan untuk mengesan semua saiz anjakan CV. Walau bagaimanapun, carta EWMA CV adalah lebih baik daripada carta SSGR CV untuk mengesan anjakan CV yang kecil tetapi carta yang terkemudian mempunyai prestasi yang lebih baik daripada carta yang terdahulu untuk mengesan anjakan CV yang sederhana dan besar. Ini menunjukkan bahawa carta SSGR CV memberikan prestasi yang memberangsangkan di samping mengekalkan kesenangan pelaksanaan. Penggunaan carta SSGR CV optimum digambarkan dengan suatu contoh.
xx
CONTROL CHARTS WITH ESTIMATED PROCESS PARAMETERS AND A PROPOSED COEFFICIENT OF VARIATION CHART
ABSTRACT
Control charts receive great attention in Statistical Process Control (SPC) as the most useful tool in detecting process shifts so that corrective actions can be taken to identify and eliminate the assignable causes that are present. The main objective of this research is to address the problems of estimation of process parameters for the side sensitive group runs (SSGR) chart and synthetic double sampling (SDS) chart. Most control charts require the assumption that the target values of the in-control process parameters, i.e. the mean and standard deviation are known for the computation of the control charts’ control limits and statistics. Unfortunately, process parameters are usually unknown in real situations, where they are estimated from an in-control Phase-I dataset. In this research, the performances of the SSGR and SDS charts with estimated process parameters are compared with that of their known process parameters counterparts. The findings indicate that the performances of the SSGR and SDS charts differ when process parameters are known and when process parameters are estimated. This is due to the existence of variability in the estimation of process parameters. In view of this, the optimization designs for the estimated process parameters based SSGR and SDS charts are developed to resolve the effects of variability due to estimation of process parameters. Optimal charting parameters can be computed using the newly developed optimization designs so that the estimated process parameters based SSGR and SDS charts perform as favourable as the known process parameters based SSGR and SDS charts. Examples are provided to demonstrate the applications of the optimal estimated process parameters based SSGR and SDS charts. Another objective of this research is to propose the SSGR
xxi
coefficient of variation (SSGR CV) chart. In many situations, the mean and standard deviation are not constant. Instead, the standard deviation is proportional to the mean. In such scenarios, monitoring the coefficient of variation (CV) is more meaningful. The implementation procedure and optimization design of the SSGR CV chart are presented in this thesis. The performance of the SSGR CV chart is compared with that of all existing CV charts. The results show that the SSGR CV chart outperforms all existing CV charts under comparison for detecting all sizes of CV shifts. However, the EWMA CV chart is superior to the SSGR CV chart for detecting small CV shifts but the latter surpasses the former for detecting moderate and large CV shifts. This shows that the SSGR CV chart provides promising performance yet maintaining the simplicity of implementation. The application of the optimal SSGR CV chart is illustrated with an example.
1 CHAPTER 1 INTRODUCTION
1.1 Background of Statistical Quality Control
In the 1920s when the telephone system was widespread in the United States (US), a team was established in the Bell Telephone Company with the goal to produce products in massive quantities yet with high quality. Subsequently, in 1924, Dr. Walter A. Shewhart pioneered the first control chart to monitor and determine whether a process is in a desired state to produce products having acceptable quality. This control chart was named as the Shewhart chart. The introduction of the control charting concept by Shewhart was often recognized as the official initiation of Statistical Quality Control (SQC). SQC is defined as a set of statistical analyses tools used by quality practitioners to monitor process quality and to solve quality problems. It primarily includes acceptance sampling, design of experiments, capability analysis and Statistical Process Control (SPC) (Woodall and Montgomery, 1999).
The concept of acceptance sampling is rooted in randomly inspecting a number of final products according to the requirements and deciding whether to accept or reject the entire batch based on the results. Nonetheless, W. E. Deming claimed that the acceptance sampling procedure is ineffective as it is too late to identify quality problems when the entire batch is rejected if it does not meet the desired requirements. Consequently, this phenomenon increases the production cost.
Design of experiments is an approach used to identify the factors influencing the process and final product. However, some statisticians do not recognize this method because it lacks technical and statistical concepts (Woodall and Montgomery,
2
1999). In addition, although design of experiments is able to identify the factors affecting the quality of a process, it cannot monitor the process from time to time.
Capability analysis refers to the evaluation of the competence of a process in producing quality products. Capability indices were introduced to enable a better understanding of process capability. According to Ryan (2011), a capability analysis can only be conducted on the data that are in a state of statistical control. Therefore, a statistical tool is needed to study the state of a process to ensure that it is in statistical control before a capability analysis can be carried out.
SPC consists of analytical decision making tools, which are efficient in achieving stability and improving the capability of a process via the reduction of variability. A control chart constitutes one of the most important tools in SPC. The implementation and development of control charts in the manufacturing setting have gained significant impetus after the Second World War. The awareness to use control charting techniques has expanded following wartime experience with the objective to monitor a process and produce output with high quality.
Until now, control chart remains as an important tool in SPC as it can continuously monitor a process and eventually enhance the capability of the process. To date, control charts are widely used in manufacturing and service industries. This is due to the reason that a control chart is a statistical tool which is simple to implement yet attaining significant impact on quality improvement.
3 1.2 Control Charts and their Applications
The control chart was first developed by Dr. Walter A. Shewhart. A control chart is a graphical method used to study changes in a process over a specific time sequence, where the horizontal lines on the chart aid in decision making. Descriptive statistics represent the quality characteristics plotted in time order.
Dr. Shewhart analyzed a process in terms of its variation. A process is classified as either in-control (in a state of statistical control) or out-of-control based on its variation. The sources of variation are divided into chance causes and assignable causes. Chance causes refer to the variation which is inherent in the process. This variation cannot be removed as it is incorporated into the process. Thus, a process that operates with chance causes of variation is considered as in-control. Assignable causes are the disturbances from external sources, which can be identified and eliminated, such as work made by an inexperienced operator. A process is out-of-control in the presence of assignable causes. A good control chart can differentiate between these two variations.
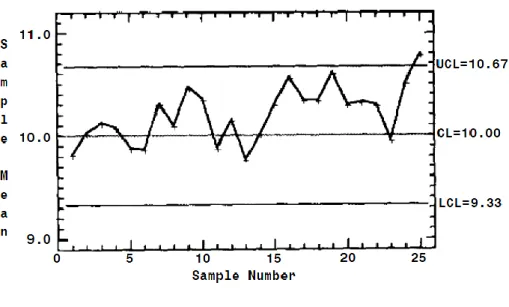
Figure 1.1 displays a typical Shewhart chart, which is also called the X
chart. There are three horizontals lines, namely the upper control limit (UCL), center line (CL) and lower control limit (LCL). From Figure 1.1, it is seen that the first fifteen points fall within the limits and are plotted randomly. Therefore, the first fifteen points suggest that the process is stable, where process variation is due to only chance causes. Consequently, no action is taken. However, the pattern observed in the last ten points indicates that assignable causes are present, as an upward trend is obvious. Furthermore, the last point plots above the UCL. Consequently, actions are
4
taken to identify and eliminate the assignable causes of this non-random pattern (Stuart et al., 1996).
Figure 1.1. A typical X chart Source: Stuart et al. (1996)
The Shewhart chart is well known among quality practitioners for its ease of construction and implementation. However, a major limitation of the chart is that it is insensitive towards small and moderate shifts in the process mean. Accordingly, the exponentially weighted moving average (EWMA) and cumulative sum (CUSUM) charts were developed by Roberts (1959) and Page (1954), respectively, for detecting small and moderate shifts in the process mean. Nevertheless, the operational and statistical procedures of the EWMA and CUSUM charts are not as easy as the Shewhart chart (Torng and Lee, 2009). Over the past years, enormous research works to develop new control charts were carried out to enhance the sensitivity of the Shewhart chart and yet maintaining the chart’s simplicity, such as through the development of the side sensitive group runs chart (Gadre and Rattihalli, 2007).
5
In general, two major categories are used to classify the different types of control charts, namely variables and attribute control charts. This classification is based on the type of data collected from a process. A variables control chart deals with the monitoring of a process coming from continuous data. Examples of continuous data are temperature, length, diameter, weight, etc. Nevertheless, there are many situations where the data cannot be represented in the continuous scale, instead taking the form of count or discrete data. In such cases, an attribute control chart is used to monitor the process by classifying each item into two groups, such as conforming and nonconforming, pass and fail, perfect and imperfect. Attribute control charts are usually implemented in service industries, where continuous data are rarely available. Variables control charts are often preferred compared with attribute control charts as the former provide more information due to the fact that the data are plotted on a continuous scale which can provide measures of central tendency and variability.
Since the inception of the control charting concept, research works on control charts have received increasing attention. With the advent of sophisticated and powerful computer technology, the implementation of control charts is becoming simpler to practitioners and shop floor personnel. This has contributed to control charts being widely used in various types of industries.
The use of control charts has been long recognized in manufacturing industries. Yang and Cheng (2008) studied the sputtering process in the thin film transistor liquid crystal display (TFT LCD) manufacturing processes using multivariate control charts. The TFT LCD process is important in an optical electrical
6
industry. The uniformity of the thickness of sputtering coating is a crucial element that determines the quality of the final products. Thus, Yang and Cheng (2008) proposed the use of the mean, standard deviation and range of the thickness as the quality characteristics, instead of solely depending on the mean. According to Yang and Cheng (2008), in comparison to the Shewhart chart, the multivariate control chart is more efficient and monitors the uniformity of the thickness more accurately. Moreover, Riaz and Muhammad (2012) employed control charts to monitor some quality characteristics of the data of a product collected from the Swat Pharmaceutical Company. For instance, the pH level was investigated using the Shewhart and range charts.
Apart from manufacturing industries, control charts have been applied in the aerospace setting. Beabout (2003) found that the use of combined p and Pareto charts can facilitate the aircraft maintenance management. Here, the p chart can be used to display the mission capable rate and flight scheduling effectiveness rate while the Pareto chart can be used to identify the factors that affect the mission capable rate and flight scheduling effectiveness rate.
Control charts also play valuable roles in health care and public-health surveillance (Woodall, 2006). A control chart acts as a significant tool for monitoring the characteristics related to health care. For illustration purpose, control charts can be employed to monitor the clinical performance and survival rate after a major surgery (Lim, 2003). Marshall and Mohammed (2003) recommended using the Shewhart charts to examine the variation in antibiotic prescriptions among different doctors. As such, an appropriate scheme can be determined and implemented.
7
Additionally, the individuals and moving range charts can be used to monitor the blood pressure of patients. By doing so, appropriate actions can be taken to stabilize the patient’s blood pressure (Mohammed et al., 2008). Rodriguez and Ransdell (2010) also examined and analyzed health care data using some control charting concepts. For example, the rate of computerized axial tomography (CAT) scans was analyzed using the u chart for each month in a clinic.
Echin and Snyder (2003) showed that the quality of the environment, such as wind speed, vapor pressure and air temperature can be assessed using the time variant (TV) control chart. The TV control chart provides an efficient method for environmental data monitoring to identify quality problems in the environment based on the data collected by a weather station. Pan and Chen (2008) suggested a control chart for autocorrelated data, based on the autoregressive fractionally integrated moving average (ARFIMA) model to administer air quality data which have the characteristic of long memory. The ARFIMA model was compared with the autoregressive integrated moving average (ARIMA) model using the air quality data from Taiwan. The study pointed out that the ARFIMA model is more appropriate than the ARIMA model.
The use of control charts has been extended into the software development life cycle (SDLC). Pandian and Puthiyanayagam (2013) conducted a case study using control charts in a software organization. Their research found that control charts were efficient in monitoring process stability and reduce the number of nonconformities. Vashisht (2014) highlighted the role of control charts in software process management (SPM) and concluded that the implementation of control charts
8
has several advantages. The advantages include cost reduction and the minimization of error and defect rates, to name a few. SPM is a crucial part in the SDLC to determine how well the execution of a software process is conducted.
Vasarhelyi (2002) reported that the frequency to publish financial reports to ensure that organizations are operating as intended is increasing. Hence, an efficient technique is required to monitor financial related data on a continuous basis. Dull and Tegarden (2004) suggested using control charts to assist auditors and decision makers to detect unusual patterns in financial data and identify inaccurate financial statements. The graphical display by means of control charts facilitates the tracking of problems for finding suitable solutions. Also, control charts are used in the field of accounting (Walter et al., 1990) to improve the performance of an organization. For example, control charts can guide accountants to systematically track errors so that corrective actions can be implemented.
As the variety and volume of data continue to grow rapidly, it is becoming increasingly difficult to monitor and improve the quality of the data. The quality of data is vital as it affects the analysis and results of the data. Deming and Geoffrey (1941) were the first to use the p chart for monitoring the accuracy of data entry in punch cards. Pierchala et al. (2009) published a detailed report on the use of p and c
charts for tracking data quality in the Fatality Analysis Reporting System (FARS) at the National Highway Traffic Safety Administration (NHTSA). Recently, Jones-Farmer et al. (2014) suggested the use of control charts for monitoring and improving data quality. Their study was based on real data from an aircraft maintenance database.
9
Service industries are among the main driving forces of a country’s economy. Scordaki and Psarakis (2005) presented the usefulness of control charting techniques using real life data from a sales department. The data deal with the weekly sales of each salesman. Control charts for individual measurements for monitoring the mean and variance of weekly sales for each salesman were plotted to examine the trend of the sales. Control charts are also used to analyze data and identify issues that highly influence the service delivery process. This information enables an organization to provide excellent customer service and allowing it to forecast customers’ demands in the future (Reid and Sanders, 2007).
1.3 Problem Statement
A primary concern when designing a control chart is that the in-control process parameters, i.e. the mean and standard deviation are assumed known so that the chart’s control limits can be computed. Unfortunately, the in-control process parameters are usually unknown in real situations and need to be estimated from an in-control Phase-I dataset. The Phase-I dataset must be in-control so that reliable estimates of the process parameters can be obtained to enable the chart’s control limits to be computed for monitoring a Phase-II process. Woodall and Montgomery (1999 and 2014) recognized the importance to investigate the effect of parameter estimation on a particular control chart’s performance. When estimated process parameters are used, instead of known process parameters, the performance of a control chart is affected because of the existence of variability in the estimation. Moreover, the impact of parameter estimation is more severe on a control chart which is sensitive toward small shifts (Jensen et al., 2006). In view of this, the performances of the side sensitive group runs (SSGR) and synthetic double sampling
10
(SDS) charts, which are efficient for detecting small and moderate mean shifts, are studied in this thesis when process parameters are estimated. To account for the impact of the process parameter estimation, optimization designs when process parameters are unknown are developed for each of the charts.
Another important point to note is that control charts for the mean or the standard deviation can be used reliably in process monitoring when the process has a constant mean or a constant standard deviation. Unfortunately, not all processes have constant means or constant standard deviations. A common relationship which exists is that the standard deviation is proportional to the mean so that the ratio of the standard deviation to the mean is constant. This ratio is referred to as the coefficient of variation (CV). The first control chart for monitoring the CV is the Shewhart CV chart developed by Kang et al. (2007). The Shewhart CV chart has the characteristics of a typical Shewhart chart, i.e. it is efficient in detecting large shifts but insensitive toward small and moderate shifts. Thus, the SSGR chart for the CV (called the SSGR CV chart) is proposed in this work. The operational procedure and optimal design of the proposed chart are discussed in detail in this thesis. To gain an in-depth understanding of the proposed chart, the performance of the SSGR CV chart is compared with that of the existing CV charts.
In short, this thesis aims to (i) derive mathematical equations and develop optimization programs for the SSGR and SDS charts when process parameters are estimated and (ii) propose the SSGR CV chart and compare its performance with existing CV charts.
11 1.4 Objectives of the Thesis
The objectives of this thesis are enumerated as follows:
(i) To derive statistics and formulae for studying the run length properties of the SSGR and SDS charts, and to propose optimal designs of these charts, when process parameters are estimated.
(ii) To compare the performances of the optimal SSGR and SDS charts when process parameters are estimated with their known process parameters counterparts.
(iii) To propose a new control charting technique for monitoring the CV, namely the SSGR CV chart. The implementation and optimization procedures of the SSGR CV chart are presented in the thesis.
(iv) To compare the average run length (ARL) and standard deviation of the run length (SDRL) performances of the SSGR CV chart with that of the existing CV charts.
1.5 Organization of the Thesis
This thesis consists of 6 chapters. It begins with an introduction in Chapter 1. In Chapter 1, the background of Statistical Quality Control (SQC) is briefly explained, followed by a discussion on control charts and their applications in various areas. The problem statement of this research is also given in this chapter. In the last part of this chapter, the objectives and organization of the thesis are provided.
Chapter 2 presents a brief review on the development of the synthetic, group runs, double sampling and coefficient of variation control charts. Numerous researchers had contributed to these types of control charts which signify their
12
importance in present research works and applications. Moreover, the performance measures of a control chart, namely the ARL, SDRL and average number of observations to signal (ANOS) are elucidated in this chapter.
Chapter 3 explains the implementation and statistical designs of the SSGR and SDS charts when process parameters are known. The SSGR and SDS charts were introduced by Gadre and Rattihalli (2007) and Khoo et al. (2011), respectively, where they assumed that the process parameters are known. In addition, the existing CV charts, namely the Shewhart CV chart (Kang et al., 2007), runs rule CV chart (Castagliola et al., 2013), synthetic CV chart (Calzada and Scariano, 2013) and exponentially weighted moving average CV chart (Hong et al., 2008) are explained in detail in this chapter.
Chapter 4 provides derivations of mathematical equations and formulae for the SSGR and SDS charts when process parameters are estimated. The performances of the SSGR and SDS charts with estimated process parameters are also evaluated using the optimal charting parameters corresponding to the known process parameters case. The proposed optimal designs of the SSGR and SDS charts with estimated process parameters are presented in this chapter. These optimal designs ensure that the proposed estimated process parameters based charts have similar in-control performances to their known process parameters counterparts. In addition, the performances of the estimated process parameters based optimal SSGR and SDS charts are compared with their respective known process parameters counterparts. To facilitate the implementation of the SSGR and SDS charts with estimated process parameters, illustrative examples are given.
13
Chapter 5 details the implementation and optimal design procedure of the proposed SSGR CV chart. The derivations of the ARL and SDRL formulae using the Markov chain approach are demonstrated. This is followed by an analysis of the SSGR CV chart and a comparison of its optimal performance with existing optimally designed CV charts. The application of the SSGR CV chart is shown through an example.
Chapter 6 concludes the thesis. It summarizes the main contributions of this thesis. Suggestions for further research involving related topics are identified in this chapter.
References and appendices are provided at the end of the thesis. Appendix A displays the computer programs used in this thesis to compute the optimal charting parameters and run length properties of the estimated and known process parameters based SSGR and SDS charts. Meanwhile, Appendix B provides the computer program to compute the ARLs, SDRLs and optimal control limits of the SSGR CV chart. As the SSGR CV chart is compared with the Shewhart CV, 2-out-of-3 RR CV, 4-out-of-5 RR CV, Syn CV and EWMA CV charts in Chapter 5, computer programs for all the charts under comparison are also provided in Appendix B.
14 CHAPTER 2
A REVIEW ON RELATED CONTROL CHARTS AND THEIR PERFORMANCE MEASURES
2.1 Introduction
The primary attention in SPC for variables control chart is to detect shifts in the process mean effectively (Stoumbos and Reynolds, 1997; Jearkpaporn et al., 2007). The first variables control chart is the Shewhart chart. It is well known that the Shewhart chart is excellent in detecting large shifts but slow in detecting small shifts. In light of this, new control charts, such as the SSGR chart, are proposed to provide improved detection abilities toward small and moderate shifts. One of the objectives of this thesis is to extend the SSGR and SDS charts with known process parameters to their estimated process parameters counterparts. Thus, reviews on the development of related charts, such as the synthetic, group runs and double sampling type control charts for monitoring the process mean will be provided in Sections 2.2, 2.3 and 2.4, respectively.
The applications of control charts have moved far beyond the manufacturing sectors into health care, accounting and so on, where the mean and standard deviation may not be constants. Instead, the standard deviation is proportional to the mean. Under this situation, the CV is used to measure the relative variation of a variable to its mean. Thus, monitoring the CV using control charts is applicable in settings where the standard deviation is proportional to the mean. In this thesis, the SSGR CV chart is proposed. In view of this, Section 2.5 reviews the existing CV type control charts.
15
Section 2.6 presents the performance measures of a control chart. Two standard measures, i.e. the ARL and SDRL are used to evaluate the performance of a control chart. Meanwhile, ANOS is used in conjunction with ARL and SDRL to measure the performance of the SDS chart, which is an adaptive control chart. An adaptive control chart is a chart that varies at least one of its parameters, such as the sample size or sampling interval according to the current process quality with the aim of enhancing the chart’s performance. For the SDS chart, the sample size is allowed to change depending on the condition of the process.
2.2 Synthetic Type Control Charts
Wu and Spedding (2000a) are the pioneers to combine the Shewhart and conforming run length (CRL) charts, for constructing the synthetic chart to monitor the process mean. The implementation of the synthetic chart is based on the approach that when a sample falls beyond the control limits of the Shewhart sub-chart, the synthetic chart does not signal an out-of-control. Instead, the synthetic chart just indicates that a nonconforming sample exists. The CRL sub-chart is needed to further determine the status of the process. It has been proven that the synthetic chart has a better detection ability compared to the Shewhart chart. In addition, the synthetic chart surpasses the EWMA and combined X -EWMA charts when the mean shift is larger than 0.8 standard deviation unit. Since the synthetic chart offers a significant improvement, in terms of the detection ability, a program in the C language to compute the optimal charting parameters of the chart was presented by Wu and Spedding (2000b).
16
Since then, numerous extensions were made to the synthetic chart. Davis and Woodall (2002) showed that the synthetic chart is similar to a runs rule chart with a head start feature. The Markov chain approach was suggested to evaluate the performance of the synthetic chart. Moreover, Davis and Woodall (2002) imposed the side sensitive feature by considering the position where a sample falls on the Shewhart sub-chart. With the side sensitive feature, the signaling procedure requires two continuous nonconforming samples to fall on the same side of the Shewhart sub-chart (both samples fall either above the UCL or below the LCL). From their study, the modified chart showed an improvement in the detection ability in comparison with the synthetic chart proposed by Wu and Spedding (2000a).
Costa and Rahim (2006) worked on a synthetic chart with non-central chi-square statistics to monitor the process mean and variance. The results showed that the synthetic chi-square chart is effective in detecting the process shift compared with the joint X and R charts. Costa et al. (2009) incorporated the two-stage testing procedure into a synthetic chart to monitor the process mean and variance. The proposed chart increases the detection power towards process changes.
For monitoring processes from skewed populations, Khoo et al. (2008) developed a synthetic chart using the weighted variance approach. The advantage of this chart is that the normality assumption of the underlying process distribution is unnecessary. Castagliola and Khoo (2009) introduced a synthetic scaled weighted variance chart which is an extension of the synthetic weighted variance chart of Khoo et al. (2008). Castagliola and Khoo (2009) concluded that the synthetic scaled weighted variance chart prevails over the synthetic weighted variance chart for
17
detecting negative mean shifts. Here, the weighted variance and scaled weighted variance are approaches used to deal with skewed populations.
Aparisi and de Luna (2009) presented a synthetic chart that considers a process as in-control when the shift detected is smaller than the predefined magnitude. The proposed chart will only generate an out-of-control signal when a large shift that is considered important to harm the process is detected. Aparisi and de Luna (2009) pointed out that this new approach is important in a real industrial environment.
Scariano and Calzada (2009) discussed the generalized synthetic chart. The concept of the generalized synthetic chart is based on integrating any control chart under consideration with the CRL chart. The synthetic EWMA and synthetic CUSUM charts were studied and compared with the standard EWMA and standard CUSUM charts. The comparison indicated that the synthetic EWMA and synthetic CUSUM charts outperform their standard counterparts. In addition, the basic formulae to compute the ARL and variance of the run length for the generalized synthetic chart are provided.
A combination of the synthetic and Shewhart charts was developed by Wu et al. (2010) to detect increases in the mean shifts. The rationale for this combination is that the synthetic chart is sensitive towards a small mean shift but it is less efficient in detecting a large mean shift in comparison with the Shewhart chart. Thus, with the addition of the Shewhart chart, the combined chart can quicken the detection of large and small shifts. The combined chart outperforms its basic counterparts, i.e. the
18
synthetic and Shewhart charts for detecting large and small mean shifts. Machado and Costa (2014) extended the work of Wu et al. (2010) by imposing the side sensitive feature to the combined synthetic and Shewhart chart. Their findings revealed that the combined synthetic and Shewhart chart performs better with the side sensitive feature.
Zhang et al. (2011) assessed the performance of the synthetic chart when the in-control process parameters, i.e. the process mean and standard deviation are unknown. In addition, the optimal charting parameters when process parameters are estimated are given to facilitate the implementation of the chart.
Khoo et al. (2012) proposed an optimal design of the synthetic chart, based on the median run length (MRL). This work complements the contributions of Wu and Spedding (2000a), who developed the synthetic chart based on the ARL criterion.
2.3 Group Runs Type Control Charts
Gadre and Rattihalli (2004) developed the group runs (GR) chart, which is an integration of the Shewhart sub-chart and an extended version of the CRL sub-chart. The design of the GR chart is almost similar to the synthetic chart, i.e. when a sample falls outside the control limits of the Shewhart sub-chart, the GR chart indicates this sample as nonconforming. A further investigation using the CRL sub-chart is required to determine the state of the process. The rth CRL value, i.e. CRLr, for r = 1, 2, … is taken as the number of conforming samples plotted on the Shewhart sub-chart, between the rth and (r-1)th nonconforming samples. The extended version of the CRL sub-chart has a superior rule to enhance the chart’s detection
19
effectiveness. This superior rule is that the GR chart declares an out-of-control when (i) CRL1E or (ii) CRLr E and CRLr1 E, for r = 2, 3, …, for the first time. Here, E is the lower control limit of the CRL sub-chart. The rationale in (ii) is that the process is deemed as out-of-control when two successive CRL values are less than or equal to E (i.e. CRLr E and CRLr1E ). Therefore, when only
CRLr E occurs, one needs to further monitor the process until CRLr1E, for r = 2, 3, …, before an out-of-control signal is issued. Gadre and Rattihalli (2004) concluded that the GR chart outperforms the Shewhart and synthetic charts.
By modifying the procedure of the GR chart, Gadre and Rattihalli (2006a) developed the modified GR (MGR) chart which consists of a np sub-chart or Shewhart sub-chart and an extended version of the CRL sub-chart. Note that the np sub-chart detects increases in the fraction nonconforming while the Shewhart sub-chart detects shifts in the process mean. Thus, the MGR chart can be used to monitor increases in the fraction nonconforming or shifts in the process mean. The MGR chart signals an out-of-control if (i) CRL1E2 or (ii) CRLr E1 and
1 2
CRLr E , for r = 2, 3, …, for the first time. Here, E1 and E2 are the lower control limits of the CRL sub-chart. Note that when E1E2, the MGR chart becomes the GR chart. The MGR chart to detect increases in the fraction nonconforming outperforms the standard np, CUSUM np, synthetic np and GR np charts (Gadre and Rattihalli, 2006a). In like manner, the MGR chart to detect shifts in the mean surpasses the Shewhart X , synthetic X and GR X charts.
20
A unit and GR (UGR) chart was proposed by Gadre and Rattihalli (2006b) to detect process mean shifts based on the monitoring of unit and group levels. The individual observations and CRL sub-charts are used to monitor the unit level, while the Shewhart X and CRL sub-charts are implemented to inspect the group level. The procedure starts with the inspection of the unit level before proceeding to the monitoring of the group level according to the rule stated. It was shown that the UGR chart has excellent performance compared with the Shewhart, synthetic and GR charts (Gadre and Rattihalli, 2006b).
Gadre and Rattihalli (2007) proposed the side sensitive GR (SSGR) chart following the desirable performance improvement by using the side sensitive feature as explained by Davis and Woodall (2002). The SSGR chart is implemented in the same way as the GR chart but with an added rule. The SSGR chart declares an out-of-control if (i) CRL1J1 or (ii) CRLr J1 and CRLr1J1, for r = 2, 3, …, and that both CRLr and CRLr1 are having shifts on the same side of the Shewhart sub-chart. Here, J1 is the lower control limit of the CRL sub-chart in the SSGR chart. With an additional rule, it is proven that the SSGR chart is more efficient in comparison with the Shewhart, synthetic and GR charts.
The side sensitive modified GR (SSMGR) chart was suggested by Gadre et al. (2010) for monitoring the process mean. The implementation of this chart is similar to the MGR chart but the SSMGR chart incorporates the side sensitive feature. A SSMGR chart proclaims an out-of-control if (i) CRL1E2 or (ii) CRLr E1 and
1 2
21
on the same side of the Shewhart sub-chart. Here, E1 and E2 are the lower control limits of the CRL sub-chart, where E2 E1. Note that when E1E2, the SSGR chart is obtained. It was found that the SSMGR chart is superior to the Shewhart, synthetic, GR, MGR and SSGR charts.
2.4 Double Sampling Type Control Charts
The concept of the double sampling (DS) procedure was pioneered by Croasdale (1974) for detecting changes in the process mean. The DS procedure suggested by Croasdale (1974) is based on the notion that the out-of-control signal is solely dependent on the information from the second sample. The first sample only gives information as to whether a second sample needs to be taken. Daudin (1992) introduced the DS chart by modifying the DS procedure, taking into account the information of the first and second samples, i.e. the combined samples to determine the state of the process. Consequently, an out-of-control can be signalled based on only the first sample if certain requirements are satisfied. Daudin (1992) studied the performance of the DS chart by minimizing the in-control average sample size. The first and second samples for both Croasdale’s and Daudin’s procedures are obtained from the same population. Irianto and Shinozaki (1998) claimed that the efficiency of Daudin’s procedure is higher than that of Croasdale’s. In addition, Irianto and Shinozaki (1998) proposed the DS chart based on minimizing the out-of-control ARL.
He et al. (2002) developed the triple sampling (TS) chart, where up to three samples could be taken from the same population under certain circumstances. He et al. (2002) compared the TS chart with the DS chart, in terms of the average sample
22
size when the process is in-control. The comparison showed that the TS chart performs better than the DS chart although the TS chart needs more time to declare whether a process is in-control or out-of-control. Optimal design for the DS chart by minimizing either the in-control average sample size or both the in-control and out-of-control average sample sizes were proposed by Teoh et al. (2013) using the MRL as an evaluation criterion.
Carot et al. (2002) developed the DS variable sampling interval (DSVSI) chart. As the name implies, the DSVSI chart consists of the DS and VSI charting procedures. Carot et al. (2002) reported that the procedure for the DSVSI chart to declare whether a process is in-control is more complicated than the other DS type charts. However, the DSVSI chart increases the detection effectiveness of small and moderate shifts in the process mean.
Costa and Machado (2011) studied and compared the performances of the DS and variable parameters (VP) charts in the presence of correlation using the Markov chain approach. The results showed that the DS chart performs better when an out-of-control is signalled only at the combined samples stage.
Khoo et al. (2011) extended the DS chart by proposing the synthetic DS (SDS) chart, which integrates the DS and CRL sub-charts. Khoo et al. (2011) pointed out that the implementation of the SDS chart is more complicated as it involves six optimal charting parameters. However, their findings showed that the SDS chart outperforms the synthetic and DS charts. Moreover, the SDS chart generally surpasses the EWMA chart, for mean shifts of larger than 0.5 standard deviation. The
23
efficient detection ability of the SDS chart justifies its use.
Khoo et al. (2013a) and Khoo et al. (2013b) evaluated the performance of the DS chart when the process parameters are unknown. In Khoo et al. (2013a), optimal charting parameters of the DS chart with estimated process parameters were provided for ease of implementation. On the other hand, Khoo et al. (2013b) studied the effects of parameter estimation on the DS chart when the in-control average sample size is minimized using the MRL criterion. Teoh et al. (2014) proposed an optimization design procedure for the DS chart with known and estimated process parameters based on minimizing the out-of-control MRL.
2.5 Coefficient of Variation Type Control Charts
Kang et al. (2007) were the first researchers to propose the monitoring of the coefficient of variation (CV) by using the Shewhart chart (Shewhart CV chart). They considered increasing CV shifts. In monitoring the CV, a process is considered as in-control as long as the CV remains constant, even though the mean and standard deviation may have shifted. Kang et al. (2007) suggested using the probability limit as the control limit of the chart, whose center line is represented by the in-control CV. The in-control CV is obtained from an in-control Phase-I dataset using the root mean square method. Kang et al. (2007) reported that the performance of the Shewhart CV chart is influenced by the sample size but is less influenced by the in-control CV value.
The Shewhart CV chart inherits the characteristics of the Shewhart chart, which has good responsiveness toward large CV shifts but is insensitive to small and
24
moderate shifts. In view of this, Hong et al. (2008) proposed an EWMA chart to monitor the CV (EWMA CV chart). The EWMA CV chart was evaluated by Hong et al. (2008) for detecting increasing shifts in the CV. Results based on the ARL clearly show that the EWMA CV chart is superior to the Shewhart CV chart. The ARL computation made by Hong et al. (2008) was based on intensive simulations, where no theoretical method was developed.
Castagliola et al. (2011) suggested two one-sided EWMA charts to monitor the CV squared
EWMA CV chart . The two one-sided EWMA 2
CV2 charts consist of two separate one-sided EWMA 2CV charts, namely a downward EWMA 2
CV chart to detect decreases in the CV2 and an upward EWMA CV2 chart to detect increases in the CV . The Markov chain approach was adopted to compute 2 the ARLs. The results show that the EWMA CV2 chart performs better than the Shewhart CV and EWMA CV charts, even though the difference between the EWMA CV2 and EWMA CV charts is small.
Calzada and Scariano (2013) developed a synthetic chart to monitor the CV (Syn CV chart). Since the Syn CV chart monitors increases in the CV, the upward EWMA CV and Shewhart CV charts were considered in the performance 2 comparison. From their analysis, the Syn CV chart outperforms the Shewhart CV chart. However, the Syn CV chart only performs better than the upward EWMA
2
CV chart when the increasing shift in the CV is large.
Castagliola et al. (2013) recommended runs rule chart to monitor the CV (RR CV chart) when practitioners prefer to implement a less complicated CV chart. In