Munich Personal RePEc Archive
Some Facts and Figures on Development
Attainments in Nagaland
Nayak, Purusottam
North Eastern Hill University
12 October 2013
Online at
https://mpra.ub.uni-muenchen.de/51851/
Some Facts and Figures on Development Attainments in Nagaland
Purusot t am Nayak
Abstract
The present paper is a humble at t empt t o highlight t he progress of Nagaland in some socioeconomic and demographic dimensions using indicat or variables on demographic feat ures, infrast ruct ure, economy and human development . The st udy reveals t hat in t he last decade t here has been a decline in deat h rat e, male populat ion and child sex ratio but an increase in overall sex rat io. The st at e is observed t o be t he w orst performer in t he region in t erms of drinking w at er supply, part icularly in rural areas. Although every household is provided w it h elect ricit y connect ion, per capita consumpt ion of pow er in t he st at e is low est. Banking facilit ies are not up t o the mark in t he st at e and lagging behind Tripura in t erms of credit -deposit rat io. Road is t he major source of t ransport and it is the second best st at e in t he region aft er Assam. How ever, road t ransport has been handicapped by poor maint enance. The st at e has done a commendable job In t erms of lit eracy rat e, girl’s enrollment in schools and average years of schooling but failed in bridging t he gap bet w een rural-urban lit eracy rat es. There is inadequacy of health facilit ies in t he st at e resulting in t he increase in infant mort alit y rat e. Work part icipat ion has been higher for males t han that of females but rural female part icipat ion has been higher t han t hat of t he urban fem ale part icipat ion. The st at e is also w it nessing significant Increase in part icipat ion of urban females in work. The economy of t he st at e is primarily forest -based and agricult ural but it has achieved remarkable progress in small and medium scale indust ries. How ever, employment creat ion and product ivit y of labor and capit al are quit e low in factories. It has not been able t o at t ract foreign t ourist s because of frequent law and order problem. It is lagging behind in t erms of per capita income t hough her per capit a consumpt ion expendit ure is highest in t he region. In t erms of human development it has made a t remendous progress w hile M izoram is in compet ition w it h her in t erms of lit eracy.
Introduction: Nagaland em erged as t he Sixt eent h St at e of Indian Union out of t he Naga Hills dist rict of
Assam and NEFA province in 1963 as per t he Thirt eent h Am endm ent Act 1962. It is one t he eight st at es
in Nort h East India and is sit uat ed in t he far nort h-east ern corner of t he count ry. The st at e is bounded by
Assam in t he w est , M yanm ar on t he East , M anipur in t he sout h and Arunachal Pradesh and part of
Assam on t he nort h. It lies bet w een 2506’ and 2704’ lat it ude Nort h of Equat or and bet w een 93020’ and
95015’ east ern longit udes. The st at e has a geographical area of 16,579 sq km const it ut ing 0.5 per cent of
t he t ot al geographical area of t he count ry and 6.32 per cent area of t he region along wit h a populat ion
of 19.78 lakh persons as per Census 2011. It consist s of eleven adm inist rat ive dist rict s (Dim apur, Kiphire,
Kohim a, Longleng, M okokchung, M on, Peren, Phek, Tuensang, Wokha, and Zunhebot o), 74
developm ent blocks, 19 st at ut ory t ow ns and 1428 inhabit ed villages. The st at e is inhabit ed by 16 m ajor
t ribes, nam ely, Ao, Angami, Chang, Konyak, Lot ha, Sum i, Chakhesang, Khiam niungam , Kachari, Phom ,
Rengm a, Sangt am , Yim chungrü, Kuki, Zeliang and Pochury along w it h a num ber of sub-t ribes. Each t ribe
dist rict , in general, has predom inant concent rat ion of one of t he m ajor/ m inor t ribes of t he st at e, m aking
t he dist rict s dist inct in t heir sociopolit ical, t radit ional, cult ural and linguist ic charact erist ics.
The st at e has a t em perat e clim at e ranging bet w een 16°C–31°C in t he w int ers and 4°C–24°C in t he
sum m ers along w it h a largely m onsoon clim at e w ith high hum idit y levels. Annual rainfall averages
around 70–100 inches, concent rat ed in t he m ont hs of M ay t o Sept em ber. Topographically, t he st at e is
m ount ainous and t he alt it ude varies approxim at ely bet w een 194 m et ers and 3048 m et ers above sea
level. The Naga Hills rise from t he Brahm aput ra Valley in Assam t o about 610 m et ers, and rise furt her t o
t he sout h-east , as high as 1829 m et ers. M ount Saram at i, at an elevat ion of 3826 m et ers is t he st at e’s
highest peak and t his is w here t he Naga Hills m erge w it h t he Pat kai Range in M yanm ar. Rivers such as
t he Doyang and Dhiku t o t he nort h, t he Barak River in t he sout hw est and t he Chindw in river of M yanm ar
in t he sout h-east , dissect t he ent ire st at e.
Demographic Features: The t ot al populat ion of t he st at e as per 2011 Census is 19.78 lakh of w hich
48.21 per cent are fem ales (Table 1). Am ong t he eleven dist rict s in t he st at e, Tuensang has t he largest
populat ion follow ed by Kohim a. The least populat ed dist rict is Phek. While t he st at e wit nessed t he
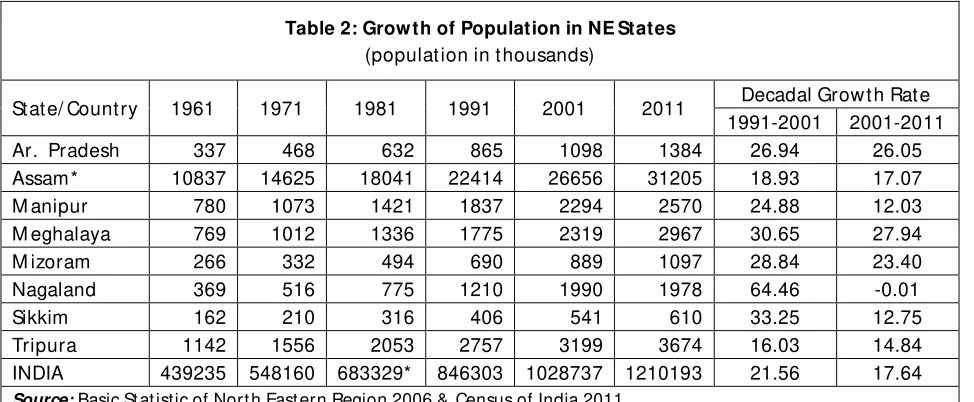
highest decadal grow t h of populat ion of 64.46 per cent during 1991-2001 as against t he corresponding
figure of 21.56 per cent at t he nat ional level, t he situat ion got reversed in t he last decade (Table 2).
Though fem ale populat ion increased by 1.16 per cent in t he last decade, t he negat ive grow t h of
populat ion of 0.01 per cent w as believed t o be due t o decrease in m ale populat ion by 18.04 per cent .
How ever, t he unprecedent ed posit ive grow t h of populat ion during 1991-2001 and negat ive grow t h of
populat ion during 2001-11 creat ed doubt s in t he m inds of dem ographers about t he reliabilit y of Census
figures in Nagaland. Alt hough t he m at t er w as discussed ext ensively in t he Nort h-East in t he run-up t o
t he 2011 Census (Nagaland Post 2009), social scient ist s largely ignored t he issue. Three possible
explanat ions w ere given. First , it w as argued t hat net in-m igrat ion w as responsible for t he high
populat ion grow t h during 1991-2001 (Rio, 2010; Singh, 2009) and net out -m igrat ion caused decline in
populat ion during 2001-11 (Chaurasia 2011; Jeerm ison 2011; and Kundu and Kundu 2011). Second,
HIV/ AIDS prevalence and drug addict ion w as also invoked t o explain t he decline in populat ion
(Jeermison 2011). Third, t he st ruggle am ong t ribes for polit ical power and development funds w as cit ed
by t he Chief M inist er as t he reason for t he abnorm al grow t h bet w een 1991 and 2001 (Hazarika 2005;
Thohe Pou 2011). Analyzing dat a on birt h and deat h rat es, in and out migrat ion of populat ion and
HIV/ AIDS dat a, Agarw al and Kum ar (2012) concluded t hat dem ographic fact ors alone w ere insufficient
subst ant ially overest im at ed t he populat ion in t he st at e. Their st udy part ly support ed polit ical–econom ic
explanat ion, i.e., com pet ing different Naga t ribes w ho inflat ed t heir num bers t o seek great er polit ical
represent at ion and a great er share in st at e’s resources w as responsible for unprecedent ed change in
populat ion.
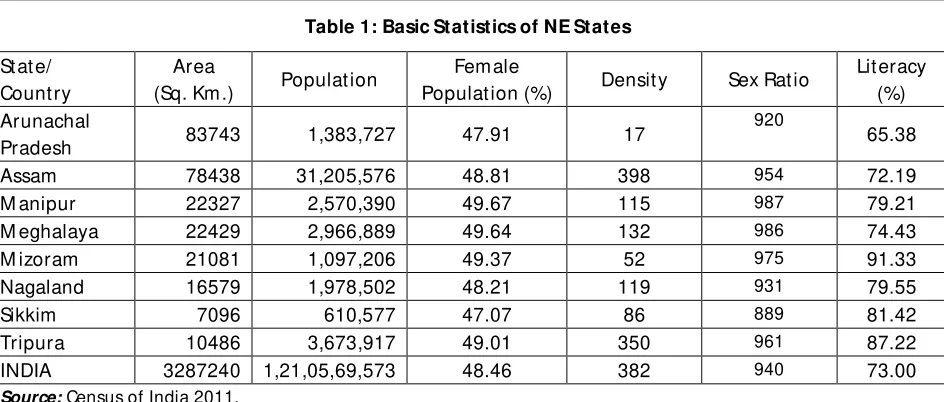
The densit y of populat ion in t he st at e w as as low as 119 per sq km as against low est densit y of 17 in
Arunachal Pradesh and highest of 350 in Tripura in t he nort heast ern region and all India average of 382.
The sex rat io w hich had st eadily declined from 933 in 1961 t o 863 in 1981, show ed a reverse t rend over
t he last t hree decades. From 863 in 1981, it rose t o 900 in 2001 and furt her t o 931 in 2011 (Table 3). It
w as a posit ive t rend as far as t he dem ographic pat t ern is concerned. In spit e of t he progress in overall
sex rat io t he st at e w as lagging not only behind t he count ry but also behind all ot her nort heast ern st at es
except ing Sikkim and Arunachal Pradesh w hich had sex rat ios as low as 889 and 920 respect ively. What
is alarm ing is t he declining child sex rat io in t he st at e from 964 in 2001 t o 944 in 2011. The sam e is t rue
in case of t he ent ire count ry and all ot her NE st at es except ing M izoram w herein it im proved m arginally
from 964 t o 971 during t he sam e period. The socio-cult ural pract ices of t he st at e valuing t he girl child
and t he governm ent al and civil societ y int ervent ions in recent past failed t o cont ribut e t o a bet t er sex
rat io for t he children.
The birt h rat e in t he st at e w as observed t o be 17.2 per cent as against 22.5 per cent at t he nat ional level
but low er t han t hat of ot her NE st at es except ing M anipur and Tripura (Table 4). While t he count ry as a
w hole and ot her NE st at es w ere w it nessing declining birt h rat es over t he period from 1994 t o 2009, it
w as fluct uat ing from 20.1 in 1994 t o 13.9 in 2004 and furt her t o 17.2 in 2009 in Nagaland. As regards
deat h rat e, Nagaland w as observed t o be t he best st at e in t he region having a rat e of 3.6 per cent as
against highest figure of 8.4 per cent in Assam and 7.3 per cent for t he count ry. Like t he st at e of Assam ,
deat h rat e w as consist ent ly declining in Nagaland during t he period w hereas in ot her NE st at es it w as
eit her fluct uat ing or increasing. Part icularly t he sit uat ion w as alarm ing in case of Sikkim .
Infrastructure: Infrast ruct ure is a physical fram ew ork of facilit ies t hrough w hich goods and services are
provided t o t he public. It covers a w ide spect rum of services such as t ransport , pow er,
t elecom m unicat ion, w at er supply, sew age disposal, and irrigat ion, m edical, educat ional and ot her
prim ary services. Som e of t hese services have a direct im pact on t he econom y, w hile ot hers are m ore
im port ant from a societ al point of view . It cont ribut es t o econom ic developm ent by increasing
product ivit y and by providing am enit ies t hat enhance t he qualit y of life. It affect s each of t he econom ic
of adequat e infrast ruct ure facilit ies is im perat ive for the overall econom ic developm ent of a st at e. Some
of t he above m ent ioned infrast ruct ure for w hich data are available are analyzed in t he following few
paragraphs.
W ater Supply: M ost of t he villages in Nagaland are locat ed on hillt ops. This m akes supply of drinking w at er a challenging t ask on t he part of t he governm ent . Therefore, w at er has t o be norm ally supplied,
t hrough gravit y, from a source locat ed at a higher alt it ude t han t he village. The num ber of villages
having prot ect ed w at er supply sources in 1963 w as only 59 w hich w ere increased t o 1304 villages (Govt .
of Nagaland, 2004). Though effort s are being m ade to augm ent t he w at er supply in t he st at e t o keep
pace w it h t he increasing requirem ent of w at er, it has virt ually failed in rural areas. As low as 46.8 per
cent of households are get t ing drinking w at er wit hin the prem ises in rural areas as against 72 per cent in
Arunachal Pradesh and 63.3 per cent in Assam (Table 5). During t he period from 1993 t o 2008
percent age of households get t ing drinking w at er w hile increased significant ly in t he st at es of Arunachal
Pradesh, Assam , M izoram and M eghalaya, it declined in Nagaland from 51.0 t o 46.8 per cent . Except ing
M anipur all ot her st at es in t he nort heast have surpassed Nagaland in increasing urban w at er supply.
Percent age of households having drinking w at er supply in urban Nagaland has declined from 94.6 per
cent t o 60.3 per cent during t he sam e period. If w e exam ine t he dat a relat ing t o source w ise drinking
w at er w e find t hat people in Nagaland unlike M eghalaya and Sikkim over t ime are depending m ore on
ot her sources of drinking w at er t han t hat of t ap w at er irrespect ive of urban and rural areas (Table 6).
Nagaland is t he w orst perform ing st at e in t he nort heast as regards percent age of households covered
under t ap w at er in urban areas. While 74.3 per cent households of t he count ry have access t o t ap w at er
in urban areas and 98.2 per cent in Sikkim it is as low as 25.7 per cent in Nagaland.
Electricity: Alt hough Nagaland generat es hydro electricit y it is not self-sufficient . The st at e generat es only 87.98 M U as against t he annual energy consum pt ion of 242.88 M U (Govt . of Nagaland, 2012).
Nagaland purchases pow er from neighboring st at es t o m eet her requirem ent . It has a very low per
capit a consum pt ion of pow er about 130 unit s per year as com pared t o an Indian average of 370 unit s.
How ever, as regards dist ribut ion of pow er is concerned it is an ideal st at e not only in t he region but also
in t he ent ire count ry. Alm ost every household has been provided w it h elect ricit y connect ion. While India
could provide elect ricit y connect ion t o 66 per cent of households in rural areas in 2008-09, Nagaland
achieved a t arget of 99 per cent (Table 7). The progress in rural areas from t he period from 1993 t o
increased from 94 per cent t o 100 per cent in Nagaland w here as in Assam and Tripura alm ost 5 per cent
of households are yet t o get t heir connect ion.
Banking: Banks play a vit al role in t he developm ent of a st at e and it s people by w ay of deposit s and loans. Since Nagaland is not indust rially developed and m ajor sources of incom e are from agricult ure
and service sect or, expansion of bank branches and banking act ivit ies are not very significant in
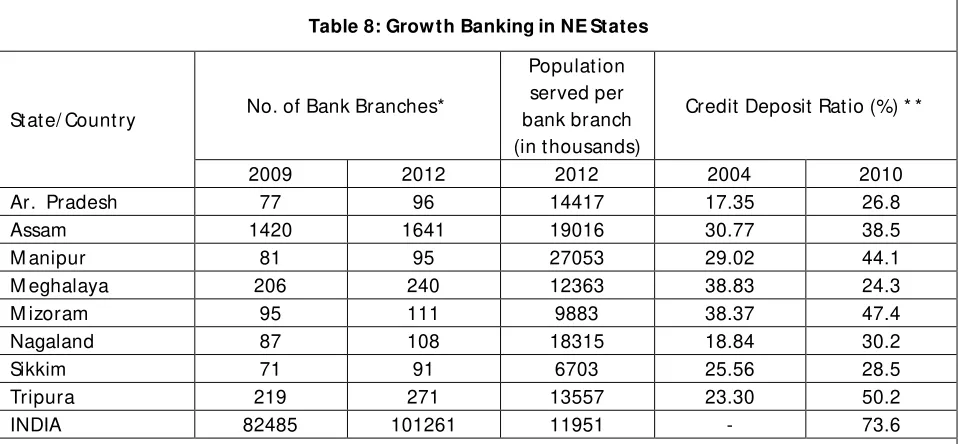
com parison t o ot her st at es in t he region and count ry (Table 8). Each bank branch on an average serves
18,315 populat ions in Nagaland as against 11,951 persons at t he all India level. The st at e is only bet t er
off in t his regard over t w o ot her st at es in nort heast , nam ely, Assam and M anipur. All ot her st at es in t he
region are ahead of Nagaland in t he expansion of bank branches. Credit -deposit rat io is not sat isfact ory
in t he ent ire region in com parison t o all India sit uat ions. Alt hough t here has been im provem ent over t he
years from 2004 t o 2010, in case of Nagaland, it is yet t o cat ch up w it h t he best perform ing st at e,
Tripura, in t he region w hich has a C-D rat io of 50.2 per cent . In 2011 t ot al deposit s and credit in t he st at e
w ere Rs. 10,951 crores and Rs. 4,086 crores respect ively. About 95 per cent of deposit s and 92 per cent
of credit s w ere from t w o dist rict s only, nam ely, Dim apur and Kohim a (Govt . of Nagaland, 2012).
Transport: Overall t ransport net w ork is quit e poor in Nagaland. The rail net w ork in t he st at e is hardly 13 km and it is t he t hird best st at e in t he region aft er Assam and Tripura. The only airport in t he st at e is at
Dim apur. Road is t he m ain source of t ransport at ion in t his land-locked hilly st at e. In t erm s of lengt h of
surfaced road, it is t he second best st at e in t he region aft er Assam having 15,470 km of road of w hich
only 7 per cent are nat ional highw ays (Table 9). Increase in road lengt h during t he period from 2004-05
t o 2010-11 has not been quit e sat isfact ory in comparison t o few sm aller st at es in t he region like
M izoram and Sikkim. If w e com pare in t erm s of populat ion served for each kilo m et er of surfaced road,
Nagaland how ever is t he second best st at e in t he region aft er Arunachal Pradesh but far behind all India
sit uat ions. Besides, road t ransport has been handicapped by poor m aint enance. Dat a on num ber of
vehicles reveals t hat Nagaland is one of t he leading t ribal st at es in t he region and num ber of vehicles is
increasing at a fast er rat e com pared t o ot her sist er st at es.
Education: Tot al num ber of schools in Nagaland is 2,552 of w hich 13 are cent rally sponsored, 677 are privat e and t he rest 1,862 are st at e schools (Govt . of Nagaland, 2012). Tot al num ber of enrollm ent is
1.74 lakhs of w hich alm ost 50 per cent are girls. Enrollm ent in prim ary school is only 49 per cent in case
of girls. There has been a phenom enal increase in t he levels of lit eracy in t he st at e as com pared t o all
India average. Lit eracy rat e in t he st at e w hich w as 66.59 per cent in 2001 w as increased t o 80.11 per
10). How ever, M eghalaya and Tripura are t he leading st at es in t he region. The perform ance of Nagaland
has not been sat isfact ory in t erm s of reduct ion of urban-rural gap in lit eracy rat es unlike Tripura,
M anipur and Sikkim . The qualit y of educat ion is also a m at t er of concern. The pass percent age in t he
m at riculat ion exam inat ion is only 48.6 percent , w hereas in higher secondary it is 76.5 percent . The
dropout rat es in class X and XII are considerable. Average years of schooling in t he st at e is as high as 7.1
as against 4.7 in India and 6.8 in M izoram and 6.3 in M anipur (Table 11). All ot her st at es in t he nort heast
are lagging behind. Nagaland, M izoram and M anipur are progressing over t im e and performing w ell in
t his regard bot h in m ale and fem ale educat ion.
Health: During 1980, t he st at e had 204 healt h cent ers, including urban hospit als, rural hospit als, prim ary healt h cent ers and sub-cent ers w it h a t ot al of 1,367 beds and 156 doct ors. By 2011-12, t he num ber of
healt h cent ers increased t o 591, w it h 2,738 beds and 390 doct ors. The coverage w as roughly 20 doct ors
and 30 hospit als/ healt h cent ers per lakh populat ion. The rat io of healt h professionals t o t ot al populat ion
w as 1: 4000, against t he recom m ended rat io of 1: 3500 (Govt . of Nagaland, 2004). This show ed
inadequacy of healt h facilit ies t o m eet t he requirem ent s of t he st at e. This has result ed in t he increase in
infant m ort alit y rat e from 17 in 2004 t o 26 in 2009 (Table 12). Though Nagaland is in bet t er off posit ion
as com pared t o t he nat ion as a w hole, it is lagging behind M anipur w hich is t he best st at e in t he region
and t he count ry w herein infant m ort alit y rat e is 16. How ever, t he rural-urban gap in infant m ort alit y
rat e is quit e sat isfact ory in Nagaland in com parison t o ot her NE st at es and India as a w hole.
W ork Participation Rate: WPR is a m easure of t he act ive port ion of an econom y's labor force. It refers
t o t he num ber of people w ho are eit her em ployed or are act ively looking for w ork. The num bers of
people w ho are no longer act ively searching for w ork are not included in WPR. Thus WPR is an indicat or
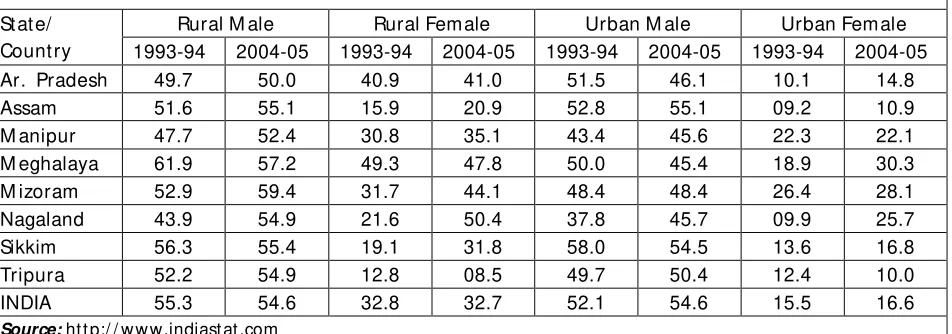
of a grow ing econom y. Dat a reveals t hat WPR has been alw ays higher for m ales t han t hat of fem ales
w het her it is in Nagaland or in any ot her st at e in nort heast or in t he nat ion as w hole (Table 13). Sim ilarly
rural fem ale part icipat ion has been higher t han t hat of t he urban fem ale part icipat ion except ing in t he
st at e of Tripura. It is w ort h not ing t hat WPR has increased considerably over t he period from 1993-94 t o
2004-05 in com parison t o ot her st at es in t he nort heast and nat ion as a w hole. This increase in WPR is
m ore prom inent in case of urban fem ales in t he st at e. In cont rast t o t his t here has been decrease of
WPR in m any of t he nort heast ern st at es such as rural and urban m ales in Sikkim , rural and urban
fem ales in Tripura, and urban m ales in Arunachal Pradesh and M eghalaya.
The Economy: The econom y of Nagaland is prim arily forest -based and agricult ural. It is also rich in
approxim at e reserve of lim est one is 1,000 m illion t onnes and subst ant ial reserves of m arble and
decorat ive st one, pet roleum and nat ural gas, nickel, cobalt , and chrom ium are available in t he st at e. But
t hese m ineral resources are yet t o be explored fully and exploit ed. At present , Nagaland has an agrarian
econom y. About 68 per cent of t he t ot al w orking populat ion of t he st at e depends on cult ivat ion. The
m ain crops grow n in t he st at e include rice, millet , maize, and pulses. Cash crops, like sugarcane and
pot at o, are also grow n in som e part s. Coffee, cardamom , and t ea com e under plant at ion crops, w hich
are grow n in hilly areas. A m ajorit y of t he populat ion is involved in t he cult ivat ion of rice as it is t he m ain
st aple diet of t he people. M ore t han 80 per cent of t he gross cropped area is under rice cult ivat ion. A
sizeable populat ion of t he st at e grow s oilseeds, w hich include rapeseed, m ust ard, et c. There are t w o
m et hods of cult ivat ion prevalent in Nagaland. Farm ers in t he st at e pract ice bot h jhum (shift ing) and
t errace cult ivat ion. The area under jhum cult ivat ion is about 87,339 hect ares and under t erraced
cult ivat ion is about 62,091 hect ares. Alt hough a m ajorit y of populat ion is engaged in cult ivat ion, st ill t he
st at e depends on t he im port of food supplies from ot her st at es because of inadequacy of land area
under cult ivat ion and low product ivit y.
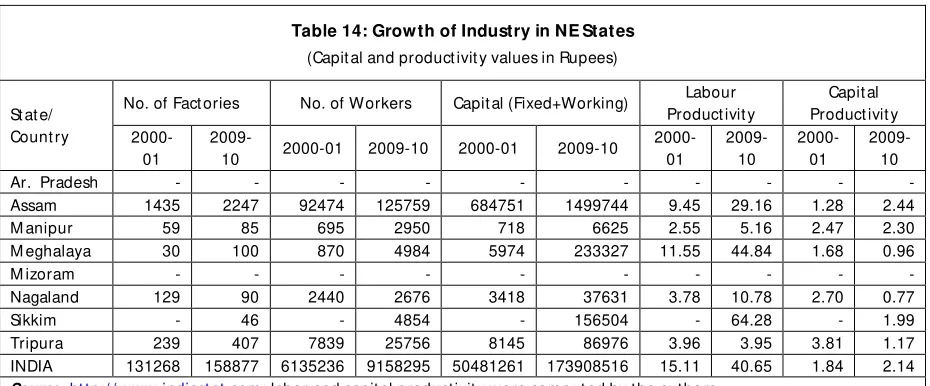
Industry: Nagaland has achieved rem arkable progress in sm all and m edium scale indust ries. People in t he st at e m ake beaut iful decorat ive m at erials. Cot t age indust ries such as w eaving, w oodw ork, and
pot t ery are also an im port ant source of revenue in t he st at e. The st at e had 30 indust rial unit s, and over
300 sm all scale indust ries (Govt . of Nagaland, 2004). Present ly t he st at e has 90 fact ories in w hich 2,676
w orkers are engaged. In t he last decade t here has been closure of 39 fact ories for various reasons (Table
14). Com pared t o ot her nort heast ern st at es t here has not been subst ant ial increase in em ploym ent in
fact ories. The nort heast ern st at es w hich have been able t o creat e m ore em ployment in fact ories are
M anipur and M eghalaya. Bot h labor and capit al product ivit y are quit e low in Nagaland by Indian
st andard. Sikkim , M eghalaya and Assam are leading st at es in t erm s labor product ivit y w hereas Assam
and M anipur in capit al product ivit y. Alt hough Nagaland has been able t o increase labor product ivit y
during t he last decade it has w it nessed decrease in capit al product ivit y.
Eco-Tourism: The focus on t ourism , part icularly eco-t ourism in Nagaland, is of recent origin and is based
on areas of st rengt h. Som e of t he advant ages t he st at e enjoys include com parat ively unexplored
dest inat ions, scenic beaut y, and st rong exist ence of local com m unit y net w orks, abundant nat ural
resources, unique eco-syst em and cult ural diversit y. The Governm ent of Nagaland declared t ourism as a
core indust ry under t he St at e Indust rial Policy, and in 2000, adopt ed it s Tourism Policy. Prior t o 1998–99
t he st at e annually (Govt . of Nagaland, 2004). However, since 2000, aft er relaxat ion of t he rest rict ed area
perm it (RAP), t here w as a st eady increase in t he arrival of int ernat ional t ourist s t o nearly 1500, in 2002.
But due t o frequent law and order problem num bers of t ourist s are fluct uat ing over t he years. In 2010
t he num ber w as reduced t o 1132 t hough t here has been subst ant ial increase in dom est ic t ourist s from
2005 t o 2010 (Table 15). Sikkim and Assam are t he leading st at es in nort heast at t ract ing foreign t ourist s.
Net State Domestic Product: About 33 per cent of t he NSDP of Nagaland is cont ribut ed by t he prim ary sect or and 53 percent by t ert iary sect or. The secondary sect or cont ribut es only 13 per cent t o t he NSDP.
Per capit a m ont hly incom e of t he st at e w as Rs. 1686.17 as against Rs. 2011.92 in t he count ry (Table 16).
Nagaland w as only bet t er off as com pared t o Assam and M anipur w hereas ot her nort heast ern st at es
w ere ahead of her. The relat ive progress in per capit a incom e of t he st at e over t he period from 1993-94
t o 2004-05 has been slow . How ever, per capit a m ont hly consum pt ion expendit ure has been quit e high
in com parison t o ot her NE st at es and nat ion as a w hole. While Tripura’s per capit a m ont hly expendit ure
w as as low as Rs. 578.91, Nagaland had t he highest per capit a expendit ure at Rs. 1094.88 in t he region.
As regards difference in per capit a m ont hly incom e and expendit ure is concerned Sikkim , Arunachal
Pradesh, and Tripura are t he leading st at es in t he region and all ot her NE st at es are lagging behind t he
nat ional average.
Human Development: Per capit a incom e or expendit ure does not capt ure t he act ual level of
developm ent or w elfare of a societ y. An alt ernat ive t o t hese indicat ors is t he lat est m easure of
developm ent know n as t he Hum an Developm ent Index (HDI). HDI capt ures t hree dim ensions of
developm ent such as qualit y of life based on healt h indicat ors, educat ion and incom e. According t o an
est im at e of M inist ry of DONER, Nagaland has been t he best performing st at es in t he region in t erm s of
at t ainm ent s in hum an developm ent (Table 17). In 1993-94 HDI w as as high as 0.553 as against 0.239 in
Assam and t he second best st at e w as M izoram . In 2004-05 Nagaland has t aken t he second posit ion aft er
M izoram . Assam has ret ained her last posit ion am ong t he NE st at es in 2004-05. Alt hough Nagaland
secured first posit ion in t erm s of HDI in bot h t he periods, 1993-94 and 2004-05, she secured second
posit ion aft er M izoram in t erm s of lit eracy in successive periods. In t erm s of healt h indicat ors t he best
perform ing st at e w as M anipur securing qualit y of life index being as high as 0.706 in 2004-05 as against
0.364 in Assam .
Concluding Remarks: Experience of Nagaland on developm ent at t ainm ent s in t he recent past is a m ixed
one. In som e areas it has been able t o achieve a good progress w hile in som e ot hers it has m iserably
connect ion t o households, increase in overall lit eracy, girl’s enrollment in schools and average years of
schooling, w ork part icipat ion of urban fem ales, developm ent of sm all and cot t age indust ries, increase in
per capit a consum pt ion expendit ure and hum an developm ent w hile in creat ing infrast ruct ure in t erm s
of drinking w at er supply, banking, m aint enance of road, healt h facilit ies, and achievement in reduct ion
of infant m ort alit y rat e, child sex rat io, bridging lit eracy gap bet w een rural and urban areas,
developm ent of t ourism , increase in per capit a incom e, et c t here is a scope t o do a lot on t he part of t he
governm ent in Nagaland.
References
Agarw al, A. and Kum ar, V. (2012) “ Nagaland's Dem ographic Som ersault ” , IEG Working Paper No.311,
Chaurasia, A.R. (2011): “ Populat ion Grow t h in India during 2001-2011: An Analysis of Provisional Result s of 2011 Populat ion Census” St udies in Populat ion and Developm ent , No 11-02. Shyam Inst it ut e: Bhopal. Available at ht t p:/ / shyam inst it ut e.in/ yahoo_sit e_adm in/ asset s/ docs/ 11_02.91173244.pdf (Ret rieved on M arch 19, 2012)
Governm ent of India (1993-94) Gendering Human Development Indices, New Delhi: M inist ry of Wom en and Child Developm ent .
Governm ent of India (1994) Housing Condit ion and Amenit ies in India 1993 (NSS 49t h Round, Report No. 429), Nat ional Sam ple Survey Office, New Delhi: M inist ry of St at ist ics and Program m e Im plement at ion.
Governm ent of India (2009) Compendium of India’s Fert ilit y & M ort alit y Indicat ors 1971 t o 2007, New Delhi: Office of t he Regist rar General.
Governm ent of India (2010) Housing Condition and Amenit ies in India 2008-09 (NSS 65t h Round, Report No. 535), Nat ional Sam ple Survey Office, New Delhi: M inist ry of St at ist ics and Program m e Im plem ent at ion.
Governm ent of India (2011 & 2001) Census of India, Office of t he Regist rar General and Census Com missioner, New Delhi: M inist ry of Hom e Affairs.
Governm ent of India (2011) Human Development Report of North East St at es, M inist ry of Developm ent of Nort h East ern Region, New Delhi.
Governm ent of India (2011) SRS Bullet in, Office of t he Regist rar General and Census Com missioner, January, New Delhi: M inist ry of Hom e Affairs.
Governm ent of Nagaland (2004) Nagaland St at e Human Development Report, Depart m ent of Planning and Coordinat ion, Nagaland: Kohim a.
Governm ent of Nagaland (2012) St at ist ical Handbook of Nagaland, Direct orat e of Econom ics and St at ist ics, Nagaland: Kohim a.
Jeermison, R.K. (2011): “ Polit ics of Populat ion Grow t h in Nagaland” Available at ht t p:/ / e-pao.net / epSubPageExt ract or.asp?src=m anipur.Census_of_M anipur.Polit ics_of_Population_Grow t h_in_Nagaland (Ret rieved on January 07, 2012)
Kundu, A and Kundu, D. (2011) “ The Census and t he ‘developm ent ’ m yt h” , Business St andard, April 08. Available at ht t p:/ / w w w .business-st andard.com / india/ new s/ am it abhkundudebolina-kunducensust he-%5Cdevelopm ent %5C-m yt h/ 431360/ (Ret rieved on M arch 23, 2012)
Nagaland Post (2009): “ Nagaland’s Inflat ed Census” Sept em ber 20. Available at ht t p:/ / w w w .nagalandpost .com / Show St ory.aspx?npost st oryiden=UzEw M TczNTc%3D-yM 3AkZLK3uc%3D (Ret rieved on January 07, 2012)
Nort h East ern Council (2006) Basic St at ist ic of Nort h East ern Region, M eghalaya: Shillong.
Rio, N. (2010) “ Address at t he Conference of t he Chief M inist ers on Int ernal Securit y” , New Delhi, 7t h February.
Singh, Amarjeet M . (2009) “ A St udy on Illegal Im migrat ion int o Nort h-East India: The Case of Nagaland” . IDSA Occasional Paper No. 8, Inst it ut e for Defense St udies and Analyses: New Delhi. Available at ht t p:/ / w w w .idsa.in/ syst em / files/ OccasionalPaper8_NagalandIllegalImm igrat ionl.pdf (Ret rieved on M arch 19, 2012)
Thohe Pou, R.B. (2011) “ Decadal Grow t h Rat e of Nagaland is M inus 0.47% (or 31.97%)” , Available at
[image:11.612.72.544.422.623.2]ht t p:/ / e-pao.net / epSubPageExt ract or.asp?src=new s_sect ion.opinions.Polit ics_and_Governance.Decadal _Grow t h_Rat e_of_Nagaland_is_M inus_point _47 (Ret rieved on M arch 19, 2012)
Table 1: Basic Statistics of NE States
St at e/ Count ry
Area
(Sq. Km .) Populat ion
Fem ale
Populat ion (%) Densit y Sex Rat io
Lit eracy (%) Arunachal
Pradesh 83743 1,383,727 47.91 17
920
65.38
Assam 78438 31,205,576 48.81 398 954 72.19
M anipur 22327 2,570,390 49.67 115 987 79.21
M eghalaya 22429 2,966,889 49.64 132 986 74.43
M izoram 21081 1,097,206 49.37 52 975 91.33
Nagaland 16579 1,978,502 48.21 119 931 79.55
Sikkim 7096 610,577 47.07 86 889 81.42
Tripura 10486 3,673,917 49.01 350 961 87.22
INDIA 3287240 1,21,05,69,573 48.46 382 940 73.00
Table 2: Grow th of Population in NE States
(populat ion in t housands)
St at e/ Count ry 1961 1971 1981 1991 2001 2011 Decadal Grow t h Rat e 1991-2001 2001-2011
Ar. Pradesh 337 468 632 865 1098 1384 26.94 26.05
Assam * 10837 14625 18041 22414 26656 31205 18.93 17.07
M anipur 780 1073 1421 1837 2294 2570 24.88 12.03
M eghalaya 769 1012 1336 1775 2319 2967 30.65 27.94
M izoram 266 332 494 690 889 1097 28.84 23.40
Nagaland 369 516 775 1210 1990 1978 64.46 -0.01
Sikkim 162 210 316 406 541 610 33.25 12.75
Tripura 1142 1556 2053 2757 3199 3674 16.03 14.84
INDIA 439235 548160 683329* 846303 1028737 1210193 21.56 17.64
Source:Basic St at istic of Nort h East ern Region 2006 & Census of India 2011.
[image:12.612.76.545.99.534.2]Not e: * Int erpolated population since no census w as held in Assam during 1981.
Table 3: Change in Sex Ratio in NE States
St at e/ Count ry
Overall Sex Rat io (Tot al population)
Child Sex Rat io (0-6 years)
2001 2011 2001 2011
Arunachal Pradesh 893 920 964 960
Assam 935 954 965 957
M anipur 974 987 957 934
M eghalaya 972 986 973 970
M izoram 935 975 964 971
Nagaland 900 931 964 944
Sikkim 875 889 963 944
Tripura 948 961 966 953
INDIA 933 940 927 914
Table 4: Percentage Change in Birth and Death Rates in NE States
St at e/ Count ry Birt h Rat e Deat h Rat e
1994 2004 2009 1994 2004 2009
Arunachal Pradesh 28.5 21.2 21.1 9.9 4.7 6.1
Assam 30.8 25.1 23.6 9.2 8.8 8.4
M anipur 21.7 13.9 15.4 6.7 4.3 4.7
M eghalaya - 19.1 17.6 - 5.2 4.5
M izoram 29.5 25.2 24.4 7.1 7.3 8.1
Nagaland 20.1 13.9 17.2 4.3 3.7 3.6
Sikkim 24.6 19.5 18.1 2.9 4.9 5.7
Tripura 21.9 15.0 14.8 5.3 5.5 5.1
INDIA 28.7 24.1 22.5 9.3 7.5 7.3
[image:13.612.66.545.396.552.2]Source: (1) Compendium of India’s Fert ilit y & M ort alit y Indicat ors 1971 t o 2007 based on Sam ple Regist ration Syst em (SRS); (2) SRS Bulletin, January 2011.
Table 5: Percentage of Households getting Drinking W ater w ithin Premises in NE States
St at e/ Count ry Rural Urban
1993 2008 1993 2008
Arunachal Pradesh 39.9 72.0 91.3 90.1
Assam 54.1 63.3 78.5 91.9
M anipur 18.8 19.0 46.4 46.3
M eghalaya 1.9 10.8 17.0 66.8
M izoram 16.2 21.7 73.3 83.2
Nagaland 51.0 46.8 94.6 60.3
Sikkim 71.4 63.2 86.8 97.7
Tripura 39.4 36.8 73.7 78.8
INDIA 33.6 40.5 65.6 74.5
Table 6: Percentage of Households by Sources of Drinking W ater in NE States
St at e/ Count ry
Rural Urban
Tap Tube w ell Ot hers Tap Tube w ell Ot hers
1993
2008-09 1993
2008-09 1993
2008-09 1993
2008-09 1993
2008-09 1993
[image:14.612.65.547.362.580.2]2008-09 Ar. Pradesh 66.3 79.8 3.8 11.2 29.9 9.0 100 87.2 0.0 3.8 0.0 9.0 Assam 08.4 6.3 46.6 65.4 45.0 28.3 43.6 36.6 39.8 41.1 16.6 22.3 M anipur 39.2 24.7 06.9 10.4 53.9 64.9 68.4 65.6 7.4 7.4 24.2 27.0 M eghalaya 19.9 50.6 07.6 09.4 72.5 40.0 32.8 95.6 2.3 0.7 64.9 3.7 M izoram 25.1 14.6 04.6 04.8 70.3 80.6 85.4 72.0 0.2 0.1 14.4 27.9 Nagaland 91.7 28.6 01.1 05.2 07.2 66.2 81.4 25.7 9.6 2.6 9.0 71.7 Sikkim 77.0 67.4 - 0.0 23.0 32.6 97.7 98.2 0.0 0.0 2.3 1.8 Tripura 23.4 27.4 33.6 43.7 43.0 28.9 66.8 60.6 18.3 33.7 14.9 5.7 INDIA 18.9 30.1 44.5 54.7 36.6 15.2 70.4 74.3 18.5 17.5 11.1 8.2 Source: 49t h & 65t h Round NSSO Report Nos. 429 & 535: Housing Condit ion and Amenities in India (Jan – June 1993 & July 2008 - June 2009).
Table 7: Percentage of Households having Electricity in NE States
St at e/ Count ry Rural Urban
1993 2008-09 1993 2008-09
Arunachal Pradesh 27.3 77.9 87.3 98.5
Assam 15.6 40.2 74.0 94.6
M anipur 58.1 86.8 92.6 99.5
M eghalaya 27.2 69.8 89.8 99.3
M izoram 61.4 81.9 91.3 99.8
Nagaland 68.4 99.0 94.0 100.0
Sikkim 65.3 95.8 91.9 99.4
Tripura 30.2 66.1 83.5 95.3
INDIA 36.5 66.0 80.9 96.1
Table 8: Grow th Banking in NE States
St at e/ Count ry No. of Bank Branches*
Populat ion served per bank branch (in t housands)
Credit Deposit Rat io (%) * *
2009 2012 2012 2004 2010
Ar. Pradesh 77 96 14417 17.35 26.8
Assam 1420 1641 19016 30.77 38.5
M anipur 81 95 27053 29.02 44.1
M eghalaya 206 240 12363 38.83 24.3
M izoram 95 111 9883 38.37 47.4
Nagaland 87 108 18315 18.84 30.2
Sikkim 71 91 6703 25.56 28.5
Tripura 219 271 13557 23.30 50.2
INDIA 82485 101261 11951 - 73.6
Source: *Reserve Bank of India, St atist ical Tables relat ing t o Banks in India, 2011-12; * * ht t p:/ / w w w.indiast at .com
Table 9: Grow th of Transport in NE States
(Lengt h of Railw ays and Roads in km s.)
St at e/ Count ry Railw ays Surfaced Roads No. of Vehicles
2004-05 2010-11 2004-05 2010-11 2002 2010
Ar. Pradesh 1 1 10325 14336 5272 5430
Assam 2506 2434 24366 37816 129628 245737
M anipur 1 1 6682 8140 11409 22140
M eghalaya 0 0 6241 7072 22661 48290
M izoram 2 2 3215 7001 8135 17230
Nagaland 13 13 10587 15470 58437 106946
Sikkim 0 0 1654 4119 5111 12102
Tripura 64 151 12180 14203 17036 37773
INDIA 63465 64460 1596450 2341480 6058863 13071720
[image:15.612.67.550.398.593.2]Table 10: Grow th of Literacy and Urban-Rural Gap in NE States
St at e/ Count ry Tot al Lit eracy in Urban-Rural Lit eracy Gap
2001 2011 2001 2011
Arunachal Pradesh 54.34 66.95 30.43 22.98
Assam 63.25 73.18 25.61 18.44
M anipur 69.93 79.85 12.54 08.83
M eghalaya 88.80 91.58 14.86 13.79
M izoram 62.56 75.48 30.01 20.18
Nagaland 66.59 80.11 21.95 14.35
Sikkim 68.81 82.20 17.09 09.44
Tripura 73.19 87.75 19.49 08.03
INDIA 64.83 74.04 21.18 16.07
Source: Census of India, 2001 & 2011.
Table 11: Grow th of Average Years of Education in NE States
St at e/ Count ry 1993-94 2004-05
M ale Fem ale Tot al M ale Fem ale Tot al
Arunachal Pradesh 2.9 1.5 2.3 4.9 3.3 4.2
Assam 4.9 3.1 4.1 5.4 3.7 4.6
M anipur 7.0 4.3 5.6 7.4 5.2 6.3
M eghalaya 3.9 2.8 3.4 4.9 4.3 4.6
M izoram 6.4 5.2 5.8 7.3 6.3 6.8
Nagaland 7.4 5.1 6.4 7.9 6.3 7.1
Sikkim 4.8 3.1 4.0 4.9 3.9 4.4
Tripura 5.0 3.3 4.2 5.3 3.8 4.6
INDIA 4.6 2.5 3.6 5.7 3.6 4.7
[image:16.612.66.549.111.290.2]Table 12: Percentage Change in Infant M ortality Rates (IM R) in NE States
St at e/ Count ry IM R (Tot al) IM R (Rural) IM R (Urban)
1994 2004 2009 1994 2004 2009 1994 2004 2009
Ar. Pradesh 40.1 42.0 32.0 41.0 44.0 35.0 29.6 27.0 14.0
Assam 78.0 66.0 61.0 78.0 69.0 64.0 76.0 38.0 37.0
M anipur 23.8 13.0 16.0 24.2 11.0 18.0 22.2 17.0 11.0
M eghalaya 47.3 43.0 59.0 50.2 43.0 61.0 19.0 37.0 40.0
M izoram - 27.0 36.0 - 36.0 45.0 - 11.0 19.0
Nagaland NA 17.0 26.0 NA 17.0 27.0 NA 18.0 23.0
Sikkim 26.8 30.0 34.0 27.0 32.0 36.0 18.6 12.0 21.0
Tripura 39.1 30.0 31.0 37.8 31.0 33.0 47.7 23.0 20.0
INDIA 74.0 58.0 50.0 80.0 64.0 55.0 52.0 40.0 34.0
[image:17.612.72.548.436.603.2]Source: (1) Com pendium of India’s Fert ility & M ort alit y Indicat ors 1971 t o 2007 - (Based on Sam ple Regist rat ion Syst em (SRS)). (2) SRS Bullet in, January, 2011. IM R for sm aller st at es (w it h t he exception of Assam ) are based on t hree-years period (2007-09)
Table 13: W ork Participation Rate in NE States
St at e/ Count ry
Rural M ale Rural Fem ale Urban M ale Urban Fem ale 1993-94 2004-05 1993-94 2004-05 1993-94 2004-05 1993-94 2004-05
Ar. Pradesh 49.7 50.0 40.9 41.0 51.5 46.1 10.1 14.8
Assam 51.6 55.1 15.9 20.9 52.8 55.1 09.2 10.9
M anipur 47.7 52.4 30.8 35.1 43.4 45.6 22.3 22.1
M eghalaya 61.9 57.2 49.3 47.8 50.0 45.4 18.9 30.3
M izoram 52.9 59.4 31.7 44.1 48.4 48.4 26.4 28.1
Nagaland 43.9 54.9 21.6 50.4 37.8 45.7 09.9 25.7
Sikkim 56.3 55.4 19.1 31.8 58.0 54.5 13.6 16.8
Tripura 52.2 54.9 12.8 08.5 49.7 50.4 12.4 10.0
INDIA 55.3 54.6 32.8 32.7 52.1 54.6 15.5 16.6
Table 14: Grow th of Industry in NE States
(Capit al and product ivit y values in Rupees)
St at e/ Count ry
No. of Fact ories No. of Workers Capit al (Fixed+Working) Labour
Product ivit y
Capit al Product ivit y
2000-01
2009-10 2000-01 2009-10 2000-01 2009-10
2000-01
2009-10
2000-01
2009-10
Ar. Pradesh - - - -
Assam 1435 2247 92474 125759 684751 1499744 9.45 29.16 1.28 2.44
M anipur 59 85 695 2950 718 6625 2.55 5.16 2.47 2.30
M eghalaya 30 100 870 4984 5974 233327 11.55 44.84 1.68 0.96
M izoram - - - -
Nagaland 129 90 2440 2676 3418 37631 3.78 10.78 2.70 0.77
Sikkim - 46 - 4854 - 156504 - 64.28 - 1.99
Tripura 239 407 7839 25756 8145 86976 3.96 3.95 3.81 1.17
INDIA 131268 158877 6135236 9158295 50481261 173908516 15.11 40.65 1.84 2.14
Source: ht tp:/ / w w w.indiast at.com; labor and capit al productivit y w ere comput ed by the authors.
Table 15: Grow th of Tourism in NE States
St at e/ Count ry Dom est ic Tourist Visit s Foreign Tourist Visit s Tot al Tourist Visit s
2005 2010 2005 2010 2005 2010
Ar. Pradesh 50560 227857 289 3395 50849 231252
Assam 2467652 4050924 10782 15157 2478434 4066081
M anipur 94299 114062 316 389 94615 114451
M eghalaya 375901 652756 5099 4177 381000 656933
M izoram 44715 57292 273 731 44988 58023
Nagaland 17470 21094 883 1132 18353 22226
Sikkim 251744 700011 16523 20757 268267 720768
Tripura 216330 342273 2677 5212 219007 347485
INDIA 391948589 740214297 9939782 17852777 401888371 758067074
Table 16: Grow th of Per Capita M onthly Income and Consumption Expenditure (Rs.) in NE States
Incom e1 Consum pt ion Expendit ure2 St at e/ Count ry 1993-94 1999-00 2004-05 1993-94 1999-00 2004-05
Arunachal Pradesh 727.75 1165.83 2272.58 343.75 672.31 798.76
Assam 476.25 1023.50 1398.50 280.42 473.42 613.67
M anipur 487.17 1105.00 1543.92 305.59 596.36 643.62
M eghalaya 574.42 1196.25 1982.75 390.00 639.13 762.26
M izoram 693.25 1370.25 2055.17 472.59 935.53 993.72
Nagaland 760.75 1175.58 1686.17 454.48 1005.99 1094.88
Sikkim 700.17 1240.83 2224.42 321.12 559.97 738.52
Tripura 461.17 1176.58 2032.83 367.43 589.50 578.91
INDIA (per capit a NNP) 640.83 1319.92 2011.92* 328.18 590.98 700.33
Source: 1.CSO, St ate Domest ic Product (St ate Series), M inist ry of St atist ics & Programm e Im plem ent ation. 2. NSS 38t h, 50t h, 55t h & 61st Round on Household Consum ption Expendit ure.
* The figure pert ains t o Net Nat ional Incom e (NNI).
Table 17: Grow th of Human Development and their Components in NE States
St at e 1993-94 2004-05
QLI QOI EWI HDI QLI QOI EWI HDI
Ar. Pradesh 0.313 0.201 0.348 0.287 0.491 0.334 0.475 0.427
Assam 0.153 0.324 0.241 0.239 0.364 0.382 0.345 0.364
M anipur 0.593 0.419 0.265 0.426 0.706 0.487 0.369 0.521
M eghalaya 0.385 0.278 0.343 0.335 0.540 0.380 0.446 0.455
M izoram 0.729 0.503 0.417 0.550 0.657 0.572 0.523 0.584
Nagaland 0.780 0.463 0.417 0.553 0.662 0.512 0.535 0.570
Sikkim 0.567 0.333 0.324 0.408 0.666 0.391 0.469 0.509
Tripura 0.330 0.354 0.297 0.327 0.534 0.415 0.390 0.447
Source: G.O.I. (2011): Human Development Report of Nort h East St at es, M inistry of Developm ent of Nort h East ern Region, New Delhi.
Note: QLI, QOI, EWI and HDI respectively are Qualit y of Life Index, Quality of Opport unit y Index, Economic
Well-being Index and Hum an Developm ent Index. To m easure QOL, crude deat h rat e w it h one-t hird w eight and
infant m ort alit y rat e w it h t w o-t hird w eight are em ployed; To m easure QOI, lit eracy rat e (7+) w it h one-t hird w eighone-t and m ean year of educaone-t ion (15+) w ione-t h one-t w o-one-t hird w eighone-t are em ployed; and finally one-t o m easure EWI, per capit a incom e w it h one-t hird w eight and adjust ed per capit a expendit ure w it h t w