CONSTRUCT RELEVANT AND IRRELEVANT VARIABLES IN MATH PROBLEM SOLVING ASSESSMENT
by LISA E. BIRK
A DISSERTATION
Presented to the Department of Educational Methodology, Policy, and Leadership and the Graduate School of the University of Oregon
in partial fulfillment of the requirements for the degree of
Doctor of Education June 2013
DISSERTATION APPROVAL PAGE Student: Lisa E. Birk
Title: Construct Relevant and Irrelevant Variables in Math Problem Solving Assessment This dissertation has been accepted and approved in partial fulfillment of the
requirements for the Doctor of Education degree in the Department of Educational Methodology, Policy, and Leadership by:
Dr. Gerald Tindal Chairperson Dr. Julie Alonzo Core Member Dr. Gina Biancarosa Core Member
Dr. McKay Sohlberg Institutional Representative and
Kimberly Andrews Espy Vice President for Research and Innovation; Dean of the Graduate School
Original approval signatures are on file with the University of Oregon Graduate School. Degree awarded June 2013
© 2013 Lisa E. Birk
DISSERTATION ABSTRACT Lisa E. Birk
Doctor of Education
Department of Educational Methodology, Policy, and Leadership June 2013
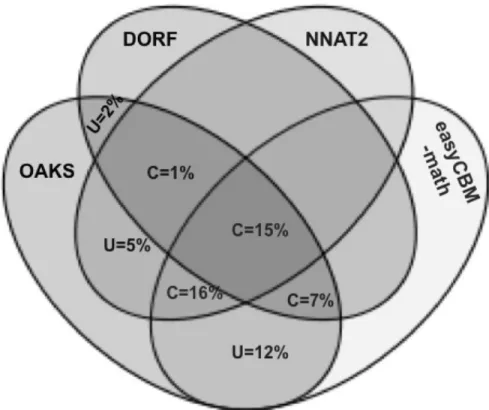
Title: Construct Relevant and Irrelevant Variables in Math Problem Solving Assessment In this study, I examined the relation between various construct relevant and irrelevant variables and a math problem solving assessment. I used independent performance measures representing the variables of mathematics content knowledge, general ability, and reading fluency. Non-performance variables included gender, socioeconomic status, language proficiency and special education qualification. Using a sequential regression and commonality analysis, I determined the amount of variance explained by each performance measure on the Oregon state math assessment in third grade. All variables were independently predictive of math problem solving scores, and used together, they explained 58% score variance. The math content knowledge measure explained the most variance uniquely (12%), and the measures of math content and general ability explained the most variance commonly (16%). In the second analysis, I investigated whether additional variance was explained once student demographic characteristics were controlled and how this affected the unique variance explained by each independent performance measure. By controlling for demographics, the model explained slightly more than 1% additional variance in math scores. The unique variance explained by each independent measure decreased slightly.
This study highlighted the influence of various construct relevant and irrelevant variables on math problem solving scores, including the extent to which a language-free measure of general ability might help to inform likely outcomes. The use of variance partitioning expanded understanding of the unique and common underlying constructs that affect math problem solving assessment. Finally, this study provided more
information regarding the influence demographic information has on outcomes related to state math assessments.
CURRICULUM VITAE NAME OF AUTHOR: Lisa E. Birk
GRADUATE AND UNDERGRADUATE SCHOOLS ATTENDED: University of Oregon, Eugene
University of Idaho, Moscow DEGREES AWARDED:
Doctor of Education, Educational Leadership, 2013, University of Oregon Master of Education, Educational Leadership, 2010, University of Oregon Bachelor of Science, Special Education, 2005, University of Idaho
Bachelor of Science, Elementary Education, 2005, University of Idaho
Bachelor of Science, Secondary Education: Mathematics-major, French-minor, 2005, University of Idaho
AREAS OF SPECIAL INTEREST:
Building Effective Teacher Teams and Positive School Culture Educational Assessment Systems
Diversity in Schools
Early Intervention and Predictive Variables for Academic Success Special Education Identification Systems and Flexible Services Mathematics Education
PROFESSIONAL EXPERIENCE:
Student Services Coordinator at Bear Creek Elementary School, Bend-La Pine Schools, 2011-present
Teacher on Special Assignment (Mathematics and Data Support), Bend-La Pine Schools, 2010-2011
Special Education Teacher at Juniper Elementary School, Bend-La Pine Schools, 2007-2010
Special Education Teacher at Fir Grove Elementary School, Roseburg Public Schools, 2005-2007
PUBLICATIONS:
Birk, L. (2009). Mathematics Knowledge Development for Special Education Teachers. University of Oregon Scholar's Bank: One-Goal School Improvement Plans. Retrieved from http://hdl.handle.net/1794/10125
ACKNOWLEDGMENTS
I would like to express thanks to the faculty and staff of the College of Education who have demonstrated endless dedication to the success of this cohort. Our
achievements are a direct reflection of the clear commitment to student learning and success. Additionally, I am so grateful for the friendship and encouragement I have received from the members of the Bend cohort. I am proud to graduate among you and look forward to continued experiences in education together. Finally, I would like to sincerely thank my parents, Erica, Lee, and Lora for their patience and moral support as I navigated through this process. Your perspectives, critique, and encouragement were invaluable and I am so lucky to have had each of you by my side.
TABLE OF CONTENTS
Chapter Page
I. INTRODUCTION ... 1
Defining the Construct(s) Measured in State Math Assessments ... 4
Mathematical Content Knowledge ... 5
Problem Solving Ability ... 7
Identification of Measurement Construct (Irrelevant) Variables in Math Problem Solving ... 9
The Influence of (g) ... 10
The Influence of Reading ... 12
Identification of Student Demographic Construct (Irrelevant) Variables in Math Problem Solving ... 15
Gender ... 15
Poverty ... 16
Limited English Proficiency ... 17
Special Education ... 18
The Quantification of Construct Relevant and Irrelevant Variables in Math Problem Solving ... 19
Content Knowledge ... 20
Non-verbal, Content-free General Problem Solving Ability ... 21
Reading Fluency ... 22
Demographic Variables ... 22
Chapter Page Research Questions ... 25 II. METHODOLOGY ... 26 Setting ... 27 Participants ... 27 Curriculum ... 28 Materials ... 29
easyCBM-math Second Grade Spring Benchmark Assessment ... 30
NNAT2 Second Grade Spring Assessment ... 32
DORF Second Grade Spring Benchmark Assessment ... 34
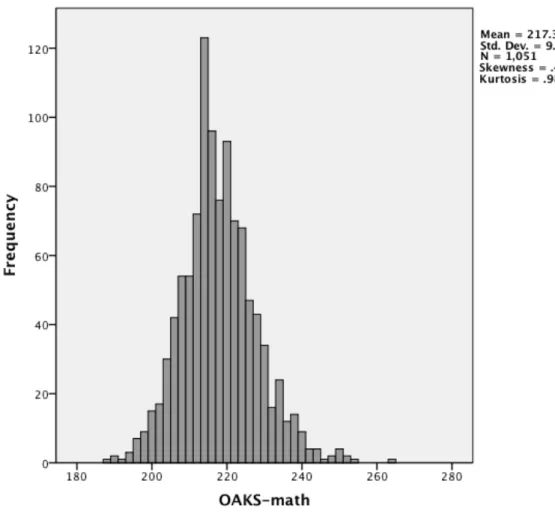
OAKS-math Third Grade Assessment ... 35
Procedures ... 36
Assessment Administration and Training Procedures ... 36
Data Collection and Subject Selection ... 38
Analyses ... 42
III. RESULTS ... 44
Descriptive Statistics ... 44
Analysis One: Performance Measures ... 45
Analysis Two: Measures with Student Demographic Characteristics ... 46
IV. DISCUSSION ... 49
Summary ... 49
Limitations ... 53
Chapter Page
Threats to External Validity ... 54
Interpretations ... 56
Influential and Non-influential Variables in Math Problem Solving ... 57
Utility of Predictive Measures in Assessment ... 66
Defining a Complex Construct ... 69
Implications and Future Research ... 70
Practical Considerations ... 70
Future Studies ... 73
APPENDICES ... 76
A. ASSESSMENT EXAMPLES ... 76
B. VARIABLE RELATIONS ... 80
C. DISTRIBUTION OF SCORES FOR STUDY VARIABLES ... 82
D. LITERATURE SEARCH DESCRIPTION ... 86
LIST OF FIGURES
Figure Page
1. Example easyCBM question (grade 2). ... 76
2. Example OAKS-math question (grade 3) ... 77
3. Pictorial representation of NNAT2 items ... 78
4. Student scoring printout (NNAT2) ... 79
5. Possible relations among variables in math problem solving ... 80
6. Variance partitioning using a commonality analysis ... 81
7. Commonality analysis results. ... 51
8. Distribution of easyCBM-math scores. ... 82
9. Distribution of NNAT2 scores ... 83
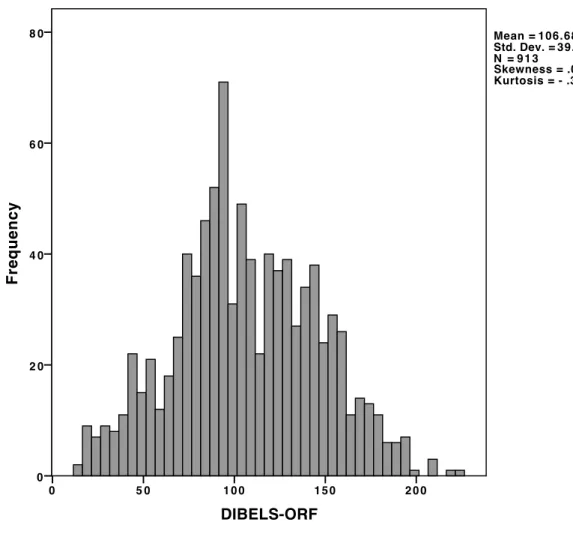
10. Distribution of DORF scores ... 84
LIST OF TABLES
Table Page
1. Valid and Missing Test Data by Gender ... 39
2. Valid and Missing Test Data by Free or Reduced Lunch Status (FRL) ... 40
3. Valid and Missing Test Data by Special Education Eligibility ... 40
4. Valid and Missing Test Data by ELL Qualification ... 41
5. Means, Standard Deviations, and Intercorrelations for Variables in Math Problem Solving ... 44
6. Sequential Regression Analysis Predicting OAKS-math from easyCBM, NNAT2, and DORF ... 45
7. Variance Partition of R2 = 58.1% with easyCBM, NNAT2, and DORF (N=913) ... 45
8. Sequential Regression Analysis Predicting OAKS-math from Performance and Non-performance Indicators ... 47
9. Comparison of Unique Variance Attributed to Performance Variables Before and After Control of Demographic Variables ... 48
CHAPTER I INTRODUCTION
State assessments in education are intended to measure progress toward
proficiency in specific areas of instruction. In mathematics, assessments in each state are developed based on state standards that may include a number of different domains such as (a) measurement, (b) geometry, (c) numbers and operations, and/or (d) algebra
(National Council of Teachers of Mathematics [NCTM], 2000). The content standards and embedded domains represent what students must know and be able to do to demonstrate proficiency in mathematics.
Researchers have pointed out that state standards vary widely (Webb, 1999). Thus, a student who demonstrates mathematic proficiency in Oregon will be unlikely to demonstrate the same level of proficiency in Idaho because the assessments are based on different state content standards and proficiency expectations. Additionally, the extent to which current state assessments accurately or adequately measure the standards or domains of interest is a subject of debate (Webb, 1999). Despite the current variability between state content standards in mathematics, problem solving continues to be one of the primary areas of focus in both instruction and assessment (NCTM, 2000, 2006).
In recent years, a group comprised of the National Governors Association Center for Best Practices (NGA Center) and the Council of Chief State School Officers
(CCSSO) resolved to eliminate differences and create common standards for use by all states (2010). By May 2012, nearly every state had joined the initiative known as the Common Core State Standards (CCSS). The adoption of the CCSS will mean many changes for states in terms of instruction, focus, and assessment as each adapts to the new
common expectations. However, despite common standards, some variation is likely to continue due to differences in proficiency standards (cut scores) set by each state independently as well as differences in assessment measures. To monitor achievement, states will choose from two major assessment systems created by two different
assessment consortia (Center for K-12 Assessment and Performance Management at ETS [ETS], 2010). Although differences may exist in assessments and state designated cut scores, problem solving will remain a constant (NGA Center & CCSSO, 2010). Experts agree that problem solving is and will continue to be a primary focus of instruction in mathematics and is critical for the demonstration of proficiency in the subject area
(National Council of Teachers of Mathematics [NCTM], National Council of Supervisors of Mathematics [NCSM], Association of State Supervisors of Mathematics [ASSM], & Association of Mathematics Teacher Educators [AMTE], 2010).
Researchers note that large-scale assessments typically reflect a complex combination of two major constructs: (a) declarative knowledge and (b) developing abilities in complex tasks (Haladyna & Downing, 2004). State assessments in
mathematics are no exception. In order to demonstrate proficiency, students must use information that they know about numbers (declarative knowledge) to solve problems in mathematical situations (a developing ability). Mathematical problem solving is a developing ability that is difficult to measure using standard assessment systems. In fact, researchers point out that when trying to evaluate proficiency around a complicated construct such as math problem solving, significant limitations exist. They contend that difficult-to-monitor systematic variance will exist within an assessment, despite attempts
to limit its influence (Haladyna & Downing, 2004). One type of this systematic variance is construct irrelevant variance.
Certain skills are clearly related to certain constructs. For example, numerical fluency is a skill that will likely help a student be successful on assessments measuring math proficiency. Such competencies are considered construct relevant because they are clearly related to the measurement topic; however, construct irrelevant variance (CIV) is variance due to the existence of variables that influence an outcome, yet are not otherwise related to the concept measured. In any assessment system, CIV can (and probably does) exist (Haladyna & Downing, 2004). For example, English language proficiency is likely a factor that would influence outcomes on math or science assessment outcomes, yet has little to do with the constructs being measured.
From a research perspective, it would be ideal to eliminate CIV completely; however, this is improbable. In mathematics problem solving, for example, written or spoken language is the medium through which assessment is delivered. Although unrelated directly to ability in math, language proficiency or reading ability may impact math performance outcomes. It is unlikely that large-scale math assessments will change such that language is unnecessary for assessment. This is just one example of how systematic variance continues to exist in the assessment of complex constructs like math problem solving.
As educators work toward student success on state assessments, it is important to identify variables that may impact outcomes on these measures. Further, if these variables can be altered through instruction, teachers will be better able to allocate resources and focus instruction in order to attain better results for student achievement. To do this, one
must quantify, understand, and consider the variance accounted for by various influential variables when interpreting outcomes. Therefore, the purpose of this study is to broaden the identification and understanding of construct relevant and irrelevant variables on math problem solving outcomes as measured by state assessments in mathematics.
Educators will more accurately identify proficiencies and make instructional decisions for students in mathematics when they have greater understanding about the degree to which different variables influence state math assessment outcomes. First, we will consider variables relevant to the constructs represented by state math assessments.
Defining the Construct(s) Measured in State Math Assessments
In this age of accountability, state testing programs are of much interest. It is important, however, to remember that they exist not simply to determine whether or not students do well on the test. Rather, state tests are designed as a way to determine if students are on an academic trajectory toward becoming college and career ready (Conley, 2010). In order to demonstrate readiness, students must show proficiency in several different content domains; one of which is mathematics. Mathematics is
important not only in daily life, but is also a necessary competency for technological jobs that exist in increasing numbers in today’s society (Jitendra, 2005).
Construct is defined as “the concept or characteristic that a test is designed to measure” (American Educational Research Association [AERA], American
Psychological Association [APA], & National Council on Measurement in Education [NCME], 1999, p. 173). Using this definition, presumably, the construct represented by a state math assessment is mathematics. However, mathematics, like all major subject areas, is a multi-dimensional construct and therefore, difficult to teach, learn, and
measure (Haladyna & Downing, 2004). So although state test programs must report different levels of proficiency, proficiency in mathematics is less than clear. What does it mean to be proficient in math?
As previously described, declarative knowledge in mathematics refers to skill competency and efficiency (computation), while developing abilities refer to the use of efficient skills to solve problems in mathematical situations (math problem solving). State math assessments such as the Oregon Assessment of Knowledge and Skills (OAKS-math) focus primarily on the latter (Oregon Department of Education, Office of
Assessment and Information Services [ODE], 2012). Because assessments are to measure progress toward college and career readiness, or practical application, the focus on
mathematical problem solving over skill competency makes sense. Math problem solving is a complex idea and logically contains two terms: (a) math (related to content) and (b) problem solving (related to either skill or ability).
Mathematical content knowledge. In 2001, the Mathematics Learning Study Committee of the National Research Council (NRC) identified five strands of
mathematics proficiency. They recognized a need for integrated adaptive reasoning, strategic competence, conceptual understanding, productive disposition, and procedural fluency. The National Mathematics Advisory Panel (NMAP, 2008, pp. xvi-xvii) mirrored these conclusions, indicating a balanced need for a coherent progression of learning coupled with proficiency with key concepts to solve problems (emphasis in original). From a teaching perspective, mathematics would be much easier to teach if only knowledge of key concepts (declarative knowledge) was expected; however, because proficiency means that students are able to synthesize the key concepts and use
them to solve problems, skill knowledge is not enough. Further, a hierarchy of skill development in mathematics is not yet clear. The five strands of mathematics proficiency are tightly intertwined at all levels of math learning (NRC, 2001); thus, critical skills and competencies are not easily isolated or measured.
In an effort to support content delivery, the NCTM (2000) outlined what they believed to be the knowledge and skills that students must be able to demonstrate at each grade level. Like the strands identified by the Math Learning Study Committee, these competencies were broken into five standard domains including numbers and operations, algebra, measurement, data analysis and probability, and geometry. In each grade band (K-2, 3-5, 6-8, and high school) the NCTM specified what type of skills a student should master; however, every standard area was important (to varying degrees) in every grade band (emphasis added). A sixth standard, process, held the same expectation in all
grades. This standard stated that students should demonstrate the ability to problem-solve and more specifically, communicate, prove, reason, make connections, and justify in every mathematical task in every grade.
The standards created by the NCTM were influential as states set standards in mathematics, and therefore typically represented (and continue to represent) the content assessed on many state assessments in math. Such is the case in Oregon (ODE, 2012). However, despite the guidance from NCTM, states were not required to use the suggested standards. Therefore, wide variability of state standards existed, which also affected state assessments. According to one study conducted at the Wisconsin Center for Educational Research, the content of statewide mathematics tests appeared quite varied and addressed a number of different domains to different degrees (Webb, 1999). Some states assessed
certain domains more than others and based on Webb’s study, the degree to which the number of questions in any domain represented mastery was also in question.
The recent move by the NGA Center and the CCSSO attempts to eliminate, or at least minimize, differences between states in both instruction and assessment. Like standards of the past, the CCSS include a number of different mathematical standards including the process standard of problem solving through reasoning, justification, and communication (Common Core State Standards Initiative, 2010). Additionally, this policy movement includes the development of two common assessments used to measure standard achievement (ETS, 2010).
Because this movement includes nearly all states, it is likely that math content instruction will become more similar among states than when NCTM initially suggested standards. However, the extent to which mathematical content knowledge will be
accurately measured on the new common assessments remains to be seen. Current studies in which researchers examine the predictive validity of curriculum based measures of content knowledge to determine likely success on state assessment outcomes provide a foundation for future replication studies using the CCSS assessments. Once the CCSS assessments are in use, researchers can use these previous studies as models to investigate the construct validity of the new assessment systems as well as the construct relevant and irrelevant variance within them. With this knowledge, teachers and researchers will be able to more accurately identify students who are at risk for failure on state assessments and adjust resources and instruction accordingly to support their path toward college and career readiness.
NCTM and the NGA Center and CCSSO, problem solving in mathematics is a concept that is critical to mathematical success. It includes the ability to reason, model, justify, and communicate mathematical ideas (NCTM, 2000). In this way, problem solving is construct relevant because it is embedded in mathematical content. It is a skill that is developed. In the CCSS, the problem solving concepts are described as the “standards for mathematical practice” (CCSSI, 2010, p. 10). These standards require students to: (a) make sense of problems and persevere in solving them, (b) reason abstractly and quantitatively, and (c) look for and express regularity in reasoning. These standards of problem solving are related to mathematical skill because students use understanding of numbers to solve problems.
Problem solving is also sometimes referred to as ability (Kaufman, 2009). For example, in reflection of the language outlined in the CCSS, words and phrases like reason, communicate, make sense, and solve problems are concepts that extend well beyond the subject of mathematics. We reason when we decide what route to take when we go to the grocery store, we communicate with one another in different settings and different ways and we are always trying to make sense of the world around us. In this way, problem solving is not content specific but rather, an important ability that we use in every setting every day. Both concepts of problem solving are important because they relate to mathematical testing outcomes; however, as a skill, problem solving is construct relevant and as an ability, it is construct irrelevant. Because both conceptual frameworks may influence outcomes on large-scale assessments, and they can be uniquely measured as described in the next section, they can be considered separately as different variables of interest.
Content knowledge and problem solving are sub-constructs represented in state math assessments. They are both construct relevant to mathematics proficiency. Other variables that may influence outcomes but are unrelated directly to mathematics are those that are construct irrelevant. These are more difficult to recognize yet still important to identify. Some of these variables are quantified by performance measures and others are inherent student demographic characteristics. In the next section, construct irrelevant performance variables related to mathematical problem solving assessments are described.
Identification of Measurement Construct (Irrelevant) Variables in Math Problem Solving
Another line of research indicates that state testing programs test various
dimensions of the skills being targeted but also a number of features that are not relevant to the content area of interest (Abedi & Leon, 1999; Abedi, Leon, & Mirocha, 2003). These are considered to be construct irrelevant and create CIV. Two main types of CIV exist: that which exists within a group and that which exists at the individual level.
Categories of group or environmental CIV include test preparation methods, test creation, language load, administration, scoring, and cheating (Haladyna & Downing, 2004). In high stakes assessments, the influence of these variables is mediated by extensive test protocols that cover each of these areas. For example, to assure consistency in
administration, test designers often use scripted directions during assessment. Teachers do not create these protocols, but do follow them during test administration. In this way, at the group level, teachers have only an indirect control over potential CIV because they are bound by the protocols designed to support assessment.
At the individual level however, teachers have direct control over the
interpretations made regarding testing outcomes. CIV for individuals might be from variables like general ability or reading proficiency (Haladyna & Downing, 2004). Other student characteristic variables like language facility, socio-economic status, and
disability may influence outcomes also, yet are unrelated to the construct of math problem solving (Abedi, Leon, & Mirocha, 2001). Because teachers have direct control over the influence of CIV at the individual level through assessment interpretation, it is important to understand assessments and their influential variables in depth in order to make accurate decisions about student instruction and intervention. Additionally, according to Haladyna and Downing (2004), more research is needed in this topic area specifically to better understand the influence of verbal abilities and accommodations on assessment outcomes.
The influence of (g). Problem solving tends to be a construct that has broad reach and can be conflated with intelligence and ability. It is often viewed as a trait that has permanence and is inherent in people (Kaufman, 2009). The history of this concept (particularly intelligence and ability) in the United States began with the first tests used to operationalize the constructs: Stanford-Binet, Wechsler, and most recently Woodcock-Johnson and Kaufman. Most of these tests purport to measure a general trait that dominates other specific abilities (e.g., motor versus verbal or sequential versus simultaneous processing). This trait, or factor, is described as mental intelligence that underlies performance on any cognitive task (Jensen, 2002).
This content-free concept of problem solving may be important and possibly related to outcomes on state assessments. Researchers agree that this factor, often referred
to as general intelligence, or g (Spearman, 1904), exists and has an interesting correlation between cognitive tasks that would otherwise be unrelated. Specifically in education, g has received much attention over several years and has been shown to be a reliable predictor for success in various academic areas (Brody, 1992; Spearman, 1904). In mathematics, there is evidence that g was highly correlated to math ability outcomes as far back as the early 1900s (Spearman, 1904). Current research indicates a positive correlation between assessments of intelligence and those of math proficiency, and thus problem solving (Fuchs et al., 2006; Hart, Petrill, Plomin, & Thompson, 2009;
Mannamaa, Kikas, Peets, & Palu, 2012). The correlations found in studies like these demonstrate a consensus that general intelligence impacts individuals as they complete any cognitive task; and further, the completion of a cognitive task is, at its core, a type of problem solving. However, in mathematics, a well-developed consensus does not exist about the degree to which g might uniquely influence high-stakes academic outcomes such as state assessments of math problem solving for the average student.
Some researchers believe that the traditional general intelligence tests using language (verbal or written) are not sensitive to diverse populations (Naglieri & Das, 2002). Nonverbal general ability assessments have emerged as tools, according to their authors, that researchers can use to measure innate problem solving ability (g) for all subjects regardless of diverse background or native language (Naglieri, 1997; Naglieri, 2008; Raven & Raven, 2003; Wechsler, 1999; Wechsler & Naglieri, 2006). In
correlational studies, researchers demonstrated a correlation between math outcomes on state and other math and reading assessments and outcomes on nonverbal measures of general ability (Fuchs et al., 2005; Fuchs et al., 2006; Naglieri & Ronning, 2000). The
correlations found using these types of measures lend support for researchers to further investigate the influence of general intelligence on academic outcomes, particularly in math, while including subjects that represent diverse populations.
With more reliable information regarding the potential link between general ability and math outcomes for all students, researchers and educators can make better decisions as they continue to answer the question of what it means to be proficient in mathematics. By understanding the amount of variance on state math tests that can be attributed to g, teachers will be able to make better instructional decisions to support struggling students in math and researchers will be able to craft more reliable assessment tools to measure proficiency.
The influence of reading. Another potentially influential variable to consider is reading ability. As outlined by Haladyna and Downing (2004), reading is a skill that often is more important than it should be in assessments of math problem solving or other content areas. The impact of reading on mathematics outcomes has been documented from several different angles. For example, Abedi, Lord, Hofstetter, and Baker (2000) found that linguistic modification of math items in assessment decreased the gap between language minority and language majority students. Helwig, Rozek-Tedesco, Tindal, Heath, and Almond (1999) drew similar conclusions. In the study, students were given portions of a math assessment in paper-pencil format and the other portion in video format. Student scores were more positive using video presentations of math problems without the requirement of reading. Tindal, Heath, Hollenbeck, Almond, and Harniss (1998) conducted a study using read-aloud as an accommodation for math assessments and found that students performed better when the reading task was eliminated. Both
studies highlight reading ability as a basic access skill in mathematics for all students, including those representing diverse populations.
One would expect that a disfluent reader would do poorly on a measure of MAZE reading (a short measure of reading comprehension); however, it is less obvious that MAZE measures would positively correlate with measures of math. Various researchers have demonstrated a positive link between outcomes on MAZE reading measures and math measures of problem solving (Jiban & Deno, 2007; Thurber, Shinn, & Smolkowski, 2002; Whitley, 2010). The correlations for MAZE and state testing outcomes were larger than typical in each study and were stronger in the upper grades (fourth and fifth grade) than in the third grade. Additionally, Jiban & Deno (2007) noted that the MAZE task and a task of calculation accounted for much variance in state testing outcomes. These results are evidence that success on math assessments might be controlled to some degree by proficient reading comprehension, particularly in the upper elementary grades.
Whitley (2010) found that the correlation between a measure of oral reading fluency and state outcomes in math was nearly the same as the correlation found between a MAZE measure and state testing outcomes in math. Crawford, Tindal, and Stieber (2001) also found moderate correlations between oral reading fluency measures and math achievement. They demonstrated that students who had very low reading fluency were much more likely to not pass the state exam than those who were proficient readers. These two studies highlight the utility of a one-minute measure of reading for the prediction of math outcomes; however Jiban and Deno (2007), argue that this type of measure should be used as only one piece of information to help determine, interpret, and/or predict future outcomes in math [emphasis added]. They demonstrate that single
measures do not account for as much variance as do a combination of outcomes to predict future success.
Rutherford-Becker and Vanderwood (2009) reported that measures of arithmetic fluency and measures of reading comprehension predicted an applied math outcome better than a measure of oral reading fluency alone. In this study, as in several regarding comprehension variables discussed previously, the subjects were in upper elementary school. A clear consensus regarding oral reading fluency is that as student reading ability grows, which is the case in later elementary years, oral reading fluency becomes less of a valuable predictor for outcomes than measures of comprehension (Fuchs & Fuchs, 1993; Silberglitt, Burns, Madyun, & Lail, 2006). Based on this information, fluency measures may provide the most useful predictive information for teachers and researchers
regarding proficiency if subjects are in grades three and below. This also tends to be the time in school when early intervention and identification of special supports for students are most often first implemented.
The described studies represent a foundation for the belief that content-free problem solving, often measured by non-verbal ability tests, and reading proficiency, often measured by oral reading fluency probes, may be influential construct irrelevant variables on math problem solving outcomes as measured by state math tests, particularly in early grades. Additional construct irrelevant variables such as student demographic characteristics are also important to recognize and consider when evaluating math outcomes and are further described in the following section.
Identification of Student Demographic Construct (Irrelevant) Variables in Math Problem Solving
Other variables that may affect outcomes for students include gender, poverty, language facility, and disability. Each variable presents unique, yet related
considerations. These are important factors to consider for teachers largely because they cannot be influenced by instruction. The influence of these factors is important for teachers and researchers to understand so assessments are designed to limit the influence of these factors and truly measure aspects of learning over which teachers have direct control.
Gender. Although there is evidence that the lack of women in Science,
Technology, Engineering, and Mathematics (STEM) fields is a current reality, it does not appear to be due to a lack of assessment achievement in mathematics by females (Beede et al., 2011; Hyde, Lindberg, Linn, Ellis, & Williams, 2008; Scafidi & Bui, 2010). Using state assessment data from several states, in both 2008 and 2010, researchers
demonstrated that girls and boys performed relatively equally on measures of
mathematics achievement (Hyde et al., 2008; Scafidi & Bui, 2010). Further, Scafidi and Bui demonstrated that this performance was not moderated by participation in other special population categories (ethnicity, ELL, etc.). These studies were conducted in both middle and high schools.
Despite the lack of evidence for actual difference in state content assessment performance by males and females, gender seems to be a significant factor related to educational experience and likely instruction based on the fact that boys typically are overrepresented in special education categories. According to Wehmeyer (2001), this
could be due to several reasons including biology, behavior, or bias. Wehmeyer conducted a study involving students who initially qualified for special education. Naturally, most of these students were of elementary age at initial referral. Results indicated that IQ was significantly different between males and females (females slightly lower) and males most often had behavioral issues associated with their referral to special education. The study also indicated that the behavioral factors might have created bias for a higher rate of special education referral. From this information, it appears that gender may co-vary with performance indicators such as g as well as non-performance indicators like special education eligibility. It may be an influential, yet construct irrelevant factor to consider when interpreting academic outcomes for students.
Poverty. Another demographic variable of influence in educational success is poverty. Students who experience poverty as a group are at increased risk for failure on educational outcome measures. According to a meta-analysis conducted by Sirin (2005), socio-economic status (SES) was positively correlated to outcomes on academic
measures. Specifically in the area of math, the correlation was very high when compared to the correlations between SES and outcomes in other academic areas such as reading or science.
Other researchers have demonstrated that the influence of poverty on math achievement is significant, especially in the early years (Burnett & Farkas, 2009). This may support the belief that once students are exposed to curriculum and good teaching, math deficits can be outgrown. Another study, though, noted that although students may progress once exposed to teaching, they might not ever catch up to their peers who have higher socio-economic status (Jordan, Kaplan, Olah, & Locuniak, 2006). The federal
government identifies students living in poverty (i.e. low SES) as a focus group that receives additional educational resources through Title I due to consistently low
performance on academic assessments as compared to students of average wealth. These resources are intended to support additional teachers and materials to deliver instructional interventions to diminish the negative impact of poverty. Again, poverty is unrelated to the construct of mathematics, but appears to be a variable of influence on assessment.
Limited English proficiency. In a similar way, language proficiency correlates highly with state testing outcomes. Testing for students who are learning English has been an area of increased focus during the past 15 years. The Individuals with Disabilities Education Act (IDEA) of 1997 required that all students be included in state testing programs. Jamal Abedi has been noted in the literature for several years on the topic of English Language Learners (ELLs). He argued that by using testing results from current assessment systems, educators are in jeopardy of making decisions that have detrimental consequences for this population (Abedi, 2006). For example, reliability and validity information is greatly affected by the fact that typical state assessments are not normed for this particular population. Therefore, assessments may not fairly reflect abilities of students who are learning English. When this happens, educators might make decisions that are unfair for this group of students based on an inaccurate understanding of proficiency.
Linguistic difficulty of assessments is another feature that impacts ELLs more than native English speakers. This has been documented in several ways. Abedi (2006) describes features such as long phrasing, complex sentences, unfamiliar vocabulary, and conditional clauses, among others, that present unnecessary and unfair negative bias for
ELLs. In one study (Abedi, Lord, Kim-Boscardin, & Miyoshi, 2000), researchers
presented an assessment in different formats, including one format with a dictionary and another with a translation of the text. They found that ELLs did much better when they had supports for language than without. Additional studies in which researchers modified the language highlighted the alterations as supportive for ELLs (Abedi & Lord, 2001; Abedi, Lord, & Hofstetter, 1998; Abedi, Lord, & Plummer, 1997). Overall, it appears that ELLs are impacted differently than proficient speakers of English in their ability to demonstrate proficiency in mathematics on assessments.
Special education. One reason that the ELL subgroup has gained attention is because students who are learning English are often over identified in special education programs (Sullivan, 2011). In general, both groups (ELLs and students in special education) demonstrate deficits in reading and writing skills when compared to English speaking peers or those without disabilities (Garcia & Tyler, 2010). It is possible that because reading is an access skill to mathematics assessments, both groups also
demonstrate lower scores in math. In this way, a danger exists that an uninformed teacher may believe a student has a learning disability in math when, in reality, he or she may be having difficulty with language more than content. In addition to reading disabilities, math disabilities or cognitive impairments are conditions that are likely to negatively affect outcomes on math assessments. It is also important to recognize that not all handicapping conditions pose a threat to state assessment outcomes. These include conditions such as orthopedic impairments and articulation concerns. However, regardless of student characteristic or exceptionality code, students within these
subgroups experience differences in resource allocation, scheduling, and peer interactions than students of the majority in schools.
Like poverty, it may also be related to other performance indicators (like reading ability) or other non-performance indicators like gender. It’s possible that like gender, special education eligibility may even co-vary with other variables. In fact, it is likely that all of the construct relevant or irrelevant variables interact in different ways. Within the literature, additional difficulties in working memory, processing speed, attention
difficulties, and phonological skills are correlates for math disabilities (Fuchs et al., 2005) too. Other variables may influence student outcomes and be of interest to explore but because of the confines of the methodology for this study described in the next section, special education, like other student demographic variables and performance indicators were the only variables investigated intently.
As with the other student characteristics, special education eligibility appears to be a construct irrelevant variable to further investigate and consider when making decisions for students. It is important for teachers to be thoughtful when using state assessment data for any student within a special population group. With careful consideration, they can more accurately interpret student assessment results and make sound decisions regarding instruction or intervention needs for students.
The Quantification of Construct Relevant and Irrelevant Variables in Math Problem Solving
In order to monitor learning fairly, it is important that the monitoring tools are free from bias, equitable to all groups, and produce equal scores for groups that should be equal (AERA, APA, & NCME, 1999). Several researchers over the past 20 years have
devised different ways to reach this goal (Abedi & Lord, 2001; Abedi, Lord, & Plummer, 1997). Although attempts to accurately measure math problem solving by reducing CIV are supportive for students, the fact remains that elimination of CIV is unrealistic for large-scale tests, specifically state exams measuring complex constructs like math problem solving through the medium of language. For this reason, it is worthwhile for researchers to identify and quantify relevant and irrelevant variables that may influence outcomes. This way, educators can make more informed decisions regarding test scores, instructional implications, and resource allocation to support students toward the end goal of college and career readiness.
Based on the literature previously described and the methodological confines outlined in the next section, three measurement variables may be important to consider in math problem solving. These include (a) content knowledge, (b) general ability, and (c) reading ability/language facility. According to the authors of each assessment, these variables can be measured using three different measures: (a) easyCBM Mathematics Assessment (easyCBM-math), (b) the Naglieri Nonverbal Ability Test-Second Edition (NNAT2), and (c) the Oral Reading Fluency component of the Dynamic Indicators of Basic Early Literacy Skills (DORF). Outcomes on these measures can be compared to outcomes on the Oregon Assessment of Knowledge and Skills (OAKS-math), to
determine the variance in math problem solving outcome scores that can be explained by construct relevant and irrelevant performance variables.
Content knowledge. As defined by Alonzo, Tindal, Ulmer, and Glasgow (2006), the easyCBM-math assessment tests math content using universal design for assessment (UDA) principles described by Ketterlin-Geller, Alonzo, and Tindal (2004). UDA is an
ideal that promotes accessible assessment for all by reducing the influence of any external factors (environment, disability, etc.) that may act as barriers to access and outcomes. In essence, UDA diminishes CIV in assessment. UDA options used on easyCBM-math include the increase of white space on a page, use of fewer answer options, and use of read aloud options.
For example, the easyCBM-math in third grade has an average of 3.9 words per question on the first 20 questions. Each question has only three possible answers. This is noticeably different than the practice questions on OAKS-math in third grade. The average number of words per question on the state example test was 15.8 words per question and each question had four possible answer options. Figures 1 and 2 (see
Appendix A for Figs. 1-4) visually demonstrate the differences in language load between the two assessments. In technical reports, researchers demonstrate that the easyCBM-math assessment is technically reliable for students in both special and general populations (Nese et al., 2010).
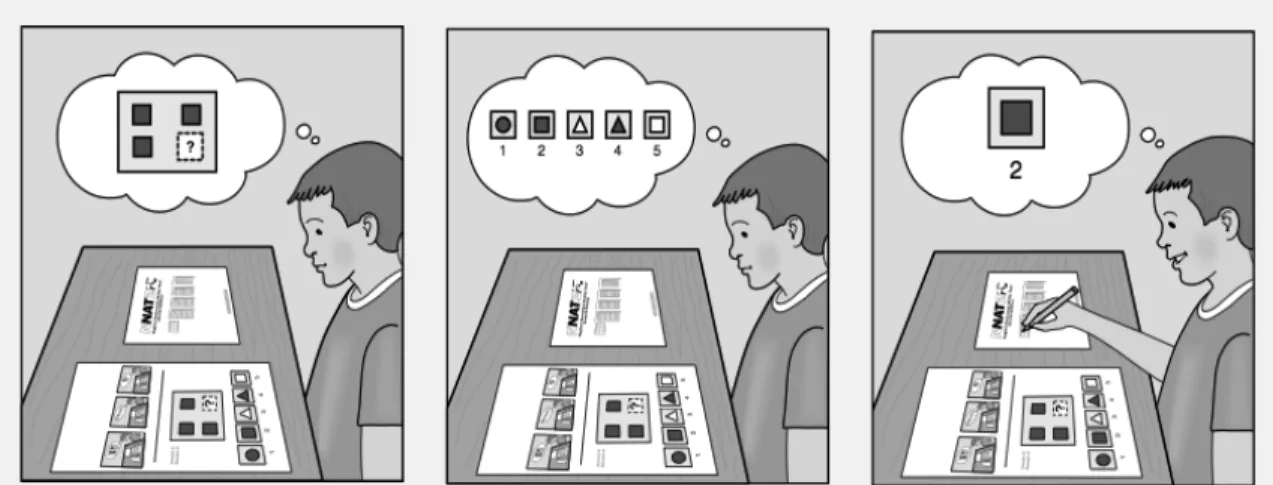
Non-verbal, content-free general problem solving ability. According to Naglieri (2008), the NNAT2 is a measure of general ability that requires no language. Each question is presented in a pictorial format without any words on the page. Figure 3 displays what is presented to students during the testing session. As defined by Naglieri (2011), the NNAT2 is designed for the purpose of measuring general problem solving ability for students who have limited language to the same level of accuracy as their language-proficient counterparts. While easyCBM-math can measure content-embedded problem solving, the NNAT2 can help to quantify the concept of general problem solving that is not content specific (as defined by the authors). This understanding can help to
distinguish between the influence of problem solving as a skill and problem solving as ability. As with easyCBM-math, technical reports conducted by Naglieri note that this measure is reliable for use with special populations.
Reading fluency. According to Good, Gruba and Kaminski (2009), DORF is a measure of oral reading fluency. Each measure consists of a passage with approximately 240 words that a student reads in one minute. Although construct irrelevant, reading is an important access skill in math problem solving assessment and as discussed earlier, researchers have demonstrated a correlation between comprehension measures and outcomes on math assessments (Jiban & Deno, 2007; Thurber et al., 2002; Whitley, 2010). Actually, researchers believe that DORF is a very accurate predictor of future success on both reading assessments and measures of comprehension (Center on
Teaching and Learning [CTL], 2012). DORF measures can help to determine how much influence reading proficiency (or lack thereof) can have on outcomes of math problem solving. Knowledge of this influence can help teachers make good decisions regarding instructional supports for students who are struggling in math, particularly those
representative of special populations who may also be struggling with the access skill of reading.
Demographic variables. Teachers can make instructional decisions to support all students on their path toward college and career readiness when they more fully
understand the influence variables have on math assessments. When these influential variables can be altered through teaching, teachers can immediately alter instruction and therefore change the course of success for students. Sometimes, however, these variables cannot be altered through teaching.
Although static, it is also important to quantify the influence of demographic variables on math assessment outcomes, particularly those that impact special
populations. Ideally, score variance on subject area assessments should be explained by predictive variables that can be altered by instruction. This would highlight the belief that instruction in a subject area is important, influential, and can change outcomes such as those in mathematics. However, if additional variance in assessment scores is explained by demographic characteristics that are not altered by instruction, this may suggest that the outcome measure actually assesses something other than, or in addition to, the learning that occurs in the classroom. This would be important information for teachers and researchers to consider when making any decisions regarding proficiency for
students within special populations. If this occurs, it would also be interesting to know to what degree the unique variance explained by each independent measure changes when demographic information is considered. If little or no change occurs, the influence of the various measurement variables (i.e. content, g, and fluency) would continue to be
important to consider, regardless of any additional special student factors.
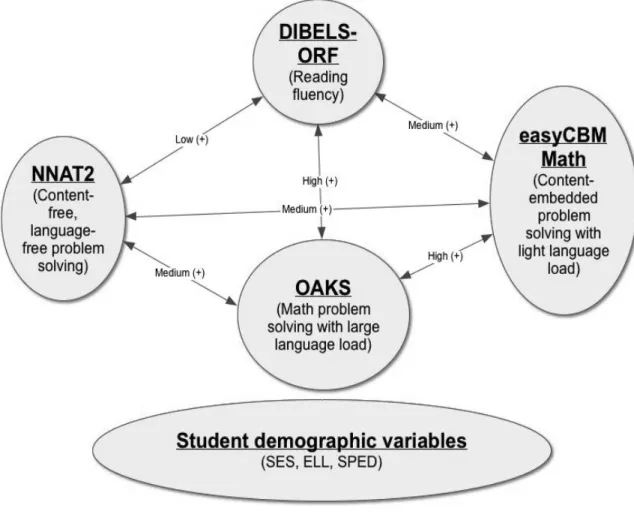
Possible outcomes. Each independent variable related to math problem solving assessment can help researchers better understand the various influences on math problem solving assessment and thus better understand the construct of math problem solving itself. Figure 5 (see Appendix B for Figs. 5-6) shows a graphic representation of possible relations between these measurement variables.
Any two variables may have a certain degree of correlation; however, in order to better recognize the construct or constructs represented in a math problem solving assessment like OAKS-math, one must consider more than correlations. Variance
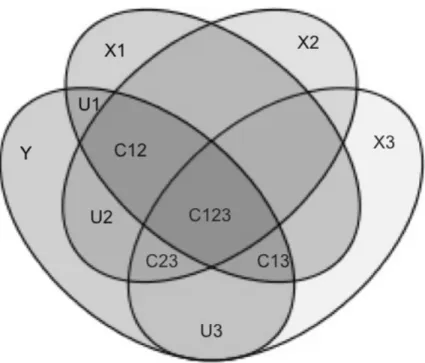
partitioning is one way to recognize variance explained uniquely and commonly by independent variables within a regression. This type of analysis can also support better understanding as to the similarities that exist between various independent variables. Figure 6 shows a representation of this method of analysis.
For example, if students score high on the NNAT2, low on easyCBM-math, and high on OAKS-math, this may suggest that the quality shared by general problem solving ability as defined by NNAT2 and math problem solving as defined by OAKS-math may be much more notable than the quality shared by problem solving as defined by OAKS-math and content knowledge as defined by easyCBM-OAKS-math. On the contrary, if students score poorly on the NNAT2, high on easyCBM-math, and high on OAKS-math, content may be more similar to what is measured on OAKS-math than what is measured by NNAT2. If students do poorly on DORF, perform highly on NNAT2, average on
easyCBM-math and poorly on OAKS-math, this may indicate that reading ability is very influential to OAKS-math outcomes. Further, it may indicate that reading/language instructional supports may be more critical for students who have this need than instructional supports in math content. If students score high or low on all tests, it may mean that all of the tests are equally similar or that one or two in particular are highly similar to what is measured on OAKS-math assessments and this similarity overshadows the dissimilar third variable. Other combinations of outcomes may reveal other important information related to the construct or constructs represented in a math problem solving assessment and variance partitioning could help to determine specific influences on outcomes.
Research Questions
The purpose of this study is to use an extant data set to better understand the extent to which construct relevant and irrelevant variables explain variance on large-scale, math problem solving assessments. In order to do this, I will use a sequentialmultiple linear regression with commonality analysis to answer the following two research questions: 1. How much unique and common variance in math problem solving as defined by
OAKS-math scores can be accounted for by measures of content-embedded problem solving as defined by easyCBM-math, content-free problem solving as defined by the Naglieri Nonverbal Ability Test (Second Edition), and reading fluency as defined by Dibels Oral Reading Fluency?
2. Is any additional variance explained once student demographic characteristics of gender, FRL status, ELL eligibility, and special education eligibility are
controlled, and if so, how does the unique variance accounted for by each performance measure change?
CHAPTER II METHODOLOGY
As a requirement of the Doctorate of Education program, researchers were required to use extant data sets. Students in the D. Ed. Program intend to be practitioners in the field. As such, extant data are used to answer questions of practice in education. For the purposes of this study, the construct relevant and irrelevant performance and demographic variables related to math problem solving assessment were confined to indicators found within the literature that were also available within the scope of daily data collection at a school district level. This study included extant data from one district in the Pacific Northwest.
As previously indicated, performance indicators could have included several other interesting variables such as attention/memory ability or achievement in multiple content areas that may have included reading, math, writing, executive functioning, etc.
Additionally, student demographic characteristics could have included school movement, early school entry, instructional tier, instructional grouping, or attendance rates. All of these variables may be of interest for future similar studies; however, based on the literature reviewed and the extant data that were accessible, the analyses in this study included data from four assessment measures (easyCBM-math, DORF, NNAT2, and OAKS-math) and four demographic factors (gender, FRL status, ELL status, and IEP status) gathered during the spring of 2011 and the spring of 2012. According to the authors of each specific assessment, easyCBM-math is a measure of content-embedded problem solving, DORF is a measure of reading fluency, NNAT2 is a measure of general problem solving ability, and OAKS-math is a measure of math problem solving. Each
measure is explained in more depth in the materials section. Specific information regarding setting, participants, curriculum, measures, procedures, and analyses will be described in the following sections.
Setting
The participants in this study attended school in a mid-sized school district in the Pacific Northwest. The district is located in a community representing a large
geographical area of over 16,000 square miles and a population of nearly 158,000 residents. It supports over 16,000 students in 27 different schools. In this community, there are 16 elementary schools, 5 middle schools, one K-8 school, and five high schools. The community is rapidly growing and the unemployment rate was 12.0% in December 2011.
Participants
The participants in this study included all students in the district who took the third grade OAKS-math test during the spring of 2012 and as second grade students, took easyCBM-math, the NNAT2, and DORF during the spring of 2011. This describes 913 students.
During the 2011-2012 school year, there were 629 males (49.0% of the
population) and 654 females (51.0% of the population) in the second grade. Students who identified as Caucasian represented 85.9% of the population. The next highest majority group was represented by those who identified as Hispanic or Latino, (10.2%), while other ethnic groups made up the remaining 3.9%. The district Talented and Gifted (TAG) percentage was equal to approximately 7% of the student population at the time of this study.
In the reviewed literature, demographic characteristics of gender, socio-economic status (represented by Free or Reduced lunch qualification, “FRL”), English language learner status (ELL), and special education eligibility (IEP) represent subgroups that are impacted in different ways by academic assessments. Because of this, these groups were specifically investigated. For this study, students were considered part of the FRL and IEP subgroup if they had qualified for the subgroup at anytime during either spring of second grade or spring of third grade since this categorization would entitle students to differences in service allocation and support during their time of qualification. Students who were considered ELL students had at least one score of 4 or less on the English Language Proficiency Assessment (ELPA) during either spring of second grade or spring of third grade. Those scoring at level 5 were grouped as if they did not qualify for
services because they did not receive specific supports or instruction for needs in English Language Development (ELD) during the time of the study.
Once all cases that did not have complete data (i.e. all four test scores) were excluded, the study sample contained 913 valid cases. Excluded students (i.e. missing a score for any measure) were investigated in order to determine any common
characteristics. Possible reasons for exclusion included a lack of access to the
assessments due to very low cognitive ability or absenteeism during a testing window. Specific information regarding students who were not included is displayed in the data collection and subject selection section.
Curriculum
In the spring of 2009, the district adopted the Bridges In Mathematics (Bridges) curriculum published by the Math Learning Center. The students in this study were
exposed to the Bridges curriculum during second grade. In kindergarten and first grade, teachers used the previous adoption of Investigations in Number, Data, and Space curriculum published by Pearson Education, Inc. According to a district official, during the 2010-2011 school year the district had not yet implemented district-wide
interventions for mathematics and the district focus was on implementation of the general classroom curriculum with fidelity (L. Nordquist, personal communication, February 7, 2012).
During the time of this study, school district agreements existed regarding time spent in mathematics instruction. In the elementary schools, all students in all-day kindergarten through grade five participated in 60 minutes of math instruction with an additional 15 minutes for Number Corner (another component of the Bridges program) each day. These instructional agreements began along with the new math adoption in the fall of 2010. Prior to this, agreements did not exist regarding time spent in direct subject instruction.
Materials
The students in this study took (a) a content-embedded test of mathematics problem solving and skill with limited language (easyCBM-math), (b) a non-verbal measure of content-free general problem solving ability (NNAT2), (c) a measure of the access skill of oral reading fluency (ORF), and (d) the third grade OAKS-math. Students took the first three tests in the spring of second grade and the latter in the spring of third grade.
Each assessment was developed by different groups of researchers within the past six years. All of the assessments have established reliability and validity described in
detail in the following sections. Researchers used them in previous studies regarding achievement outcomes with the exception of the NNAT2. The first edition of the NNAT, a paper-pencil test, has only been used in one study relating to math achievement to date.
easyCBM-math second grade spring benchmark assessment. All students
within the sample took a measure called the easyCBM-math second grade spring benchmark, which according to the authors is a measure of content-based problem solving with a light language load (Alonzo, Lai, & Tindal, 2009). Teachers use this measure, like other curriculum-based measures, to identify students who are at risk for educational failure in the area of mathematics. According to Nese et al. (2010), this assessment represents an adequate general outcome measure of math content knowledge and typically correlates well with large-scale math assessments.
In the district, building testing coordinators conduct the assessment three times each year via computer in grades one through eight. Although available in the fall, testing coordinators typically administer the kindergarten assessment beginning in the winter and then again in the spring. For the purposes of this study, participants were included if they were second grade students in the spring of 2011 and completed the second grade spring benchmark assessment.
Although the easyCBM measure has language, researchers designed the
assessment so that the language impact is minimal (Alonzo et al., 2009). As previously described, it uses UDA principles that are shown to be supportive for all students. There are fewer words on this test than on a state math assessment (average 3.9 vs. 15.8 per question). Additionally, white space is increased and language is simplified (see Figure 1).
The test consists of 45 multiple-choice questions related to the focal point standards for each grade outlined by the National Council of Teachers of Mathematics (Alonzo et al., 2006). In Oregon, state standard developers used the focal points as a primary document when creating the Oregon state content standards in mathematics (ODE, 2012). Therefore, although the easyCBM math measure is not directly written to match the Oregon state standards, the content is generally the same in terms of focus and emphasis.
To investigate technical adequacy of the easyCBM math measures, researchers used split-half reliability and Cronbach’s alpha to represent internal consistency
reliability. Using a sample of 283 subject responses, Cronbach’s alpha was .82. The split-half coefficient was .79. This demonstrates that the easyCBM math measure has adequate reliability as a measure for which it is described (Anderson et al., 2010; Anderson,
Alonzo, & Tindal, 2010a; Anderson, Alonzo, & Tindal, 2010b).
Anderson et al. (2010a, 2010b) also reported on criterion and content validity evidence for easyCBM math. In order to demonstrate criterion validity, researchers determined the relation between the easyCBM math questions and math questions on the TerraNova assessment. In second grade, the three easyCBM math benchmark measures accounted for 66 percent of the variance in the TerraNova score. This was statistically significant. The relation between the spring benchmark score and the TerraNova math score demonstrated concurrent validity. The spring benchmark score accounted for 51 % of the variance in the TerraNova math score (again, statistically significant). To
demonstrate content validity, the researchers conducted a Rasch analysis and a confirmatory factor analysis (CFA). All but six spring items had a mean square outfit
between 0.7 and 1.3, with most between 0.8 and 1.2. This is considered adequate content validity for high-stakes test items.
Based on the unique qualities of this assessment described by the authors, for this study, the second grade spring benchmark form was used as a measurement of content-embedded problem solving with limited language influence. Because it represents mathematical content, it is thought to be construct relevant: related to the construct of mathematical problem solving.
NNAT2 second grade spring assessment. The NNAT2 is a measure free of language. This assessment is described as a measure of general problem solving ability. As described on the publisher’s website, the test “uses progressive matrices to allow for a culturally neutral evaluation of students’ nonverbal reasoning and general
problem-solving ability, regardless of the individual student’s primary language, education, culture or socioeconomic background” (Pearson, 2012). The author notes that prerequisite skills are not required for the assessment (Naglieri, 2011).
The assessment system has seven different levels; however, each student within this study was given test level C. Levels A-G loosely correlate with the grade in which the student receives instruction. An example of a question on the NNAT2 is shown in Figure 3. The computer generates scores in several different formats. These include stanine score, percentile rank, ability index (standardized score), and a scaled score. For this study, the ability index was used. A sample student report is attached (see Figure 4).
According to the information regarding updated norms (Naglieri, 2011), researchers used split-half reliability and Kuder-Richardson Formula 20 (KR20) to evaluate internal consistency. Using a sample of 99,004 subjects, the mean was 100.0
with a standard deviation of 16.0. The split-half coefficient was .90 and the KR20 was .88. The Standard Error of Measurement (SEM) was 5.22. This demonstrates that NNAT2 has adequate reliability as a measure for which it is described.
The manual also refers to studies of validity. Researchers correlated mean scores from the previous version of the assessment to those of the NNAT2. The correlation between tests was .998, indicating a very high level of performance consistency across measures. Further, researchers conducted a correlation between the NNAT2 and the Wechsler Nonverbal Scale of Ability (WNV) (Wechsler & Naglieri, 2006) using a
subgroup of gifted students who were part of the updated NNAT2 norms study. The 2011 Naglieri Ability Index (NAI) scores were highly correlated to the WNV Full Scale scores and T-scores (.74). There was also a high correlation between the NNAT2 and Matrices indicating the measurement of similar constructs between tests (Balboni, Naglieri, & Cubelli, 2010).
It is important to note that Naglieri himself conducted the technical adequacy studies for this measure so the claims should be interpreted with caution. However, this measure is an unusual performance indicator rarely accessible to researchers on a large scale. Most often, measures of general intelligence or general ability are only
administered to students who are part of an evaluation for specialized services. In this particular district, this assessment is used as one measure to identify students with intellectual giftedness and as such, it is given to every second grade student near the end of the year. Because of this situational convenience, the results of this measure can be further used to investigate the influence of content-free general problem solving ability on assessment outcomes.
For this study, the NNAT2 was used as a pure measure of problem solving ability unrelated to content. This is thought to be one of the two major concepts that underlie proficiency on state assessments, the other skill proficiency. Because this measure does not represent mathematical content, it could be considered construct irrelevant. However, because this study examines mathematical problem solving as it relates to assessment, this test highlights problem solving as a potentially influential construct relevant variable of interest. Study analysis will help to determine the relevant influence of pure problem solving on mathematical problem solving assessment outcomes.
DORF second grade spring benchmark assessment. A DORF measure was
used to determine the potential influence of the construct irrelevant variable of reading ability on math outcomes. Although only a measure of fluency, researchers have demonstrated that this brief measure alone accounts for as much variance on reading performance outcomes as multiple reading measures combined (CTL, 2012). Further, other researchers have demonstrated a relation between reading performance and math performance on state assessments (Jiban & Deno, 2007) that may be due to the
importance of this skill for access to large-scale assessments.
The DORF benchmark measure is administered three times each year in the district. The benchmark assessment consists of three one-minute passages (approximately 240 words long) that a student reads. The tester reads scripted directions before and during each administration. For this study, I used the highest score out of the three passages delivered in the spring.
Researchers used alternate form, test-retest, and inter-rater reliability to represent DORF as a reliable tool to measure reading fluency. The coefficients of .96, .91, and .99
represented very high reliability. The concurrent validity coefficient was .73. This was significant at the .001 level, and was a large effect size.
For this study, the spring benchmark measure in second grade was used as a representative measure of reading proficiency that is consistently shown to be an
influential variable (although construct irrelevant) on outcomes in math assessments, both predictively and concurrently (Lamb, 2010).
OAKS-math third grade assessment. Teachers administer the OAKS-math
during the spring of each school year beginning in third grade. This assessment is designed to measure proficiency in the area of mathematics related to third grade
standards. On this assessment, students use skill efficiency and content comprehension to understand and solve problems in mathematical situations. For this study, this is the operational definition used for math problem solving and this test was the measure that represented the multi-faceted construct. Students were able to take the measure up to three times during the test window. For this study, I used the highest score received on the assessment during the testing window.
Researchers continue to reexamine reliability and validity information for this assessment. According to an official from the Oregon Department of Education, they use standard error of measurement for reliability evidence and they explain test development practices for validity evidence. According to this official, the assessment is technically adequate to measure mathematics proficiency in the area of problem solving (S. Slater, personal communication, September 4, 2012). In this study, this assessment was used as the dependent variable representing mathematical problem solving in assessment.