III III Ill Ill II II ff1 III ff1
0000092339STUDY OF RAINFALL - RUNOFF RELATIONSHIP FOR LANGAT RIVER WATERSHED BY USING HEC - HMS
MUHAMMAD HAFIZUDDIN BIN MD RASIB
Report submitted in fulfilment of the requirements for the award of the degree of
Bachelor of Civil Engineering (Hons.)
Faculty Of Civil Engineering And Earth Resources UNIVERSITI MALAYSIA PAHANG
ABSTRACT
In this era, we always heard about a flood problems occurrence in Malaysia. Malaysia is a country that subjected to flood problems because it was surrounded by South China Sea. In Malaysia, there are some places that have serious flood problems which is a state near with South China Sea such as in Terengganu, Johor and Selangor. Langat River was located near with Selangor and it is connected to the South China Sea. The places near with Langat River always had a flood problem in every year. The thesis is conducted to stimulate the precipitation-runoff processes of dendritic watershed systems. The thesis also prepared validation and verification of HEC- HMS (hydrological model) to recorded data. After these two objectives of study were completed, the appropriate model for flood hydrograph prediction is produce. From the model, hopefully it will help to make a decision to prevent a flood problem. HEC-HMS is a tool to produce a number of hydrologic modeling inputs. It also can be used to recognize the rainfall- runoff relationship of Langat River in a certain period. From the rainfall data, a hydrograph of Langat River can be obtained by using analysis of relationship between rainfall and runoff. This hydrograph are used for studies of urban drainage and flow forecasting. So, it can be guidance to people along Langat River aware about flood problems and also can be flood control management in Langat River. By referring to Root Mean Square Error (RMSE), as the value is near to zero, it is considered as the best fit. The RMSE value obtained for Figure 4.2, Figure 4.13, Figure 4.14 and Figure 4.25 are 0.256 m3/s, 0.346 m3/s, 1.121 M3 /s and 0.319 M3 /s respectively. As for conclusion, SCS Unit Hydrograph method can be used for simulation in Langat River basin.
ABSTRAK
Dalam era mi, kita sentiasa mendengar mengenai kejadian masalah banjir di Malaysia. Malaysia adalah sebuah negara yang selalu terjadi masalah banjir kerana ia dikelilingi oleh Laut China Selatan. Di Malaysia, terdapat beberapa tempat yang mempunyai masalah banjir yang sangat serius seperti di Terengganu, Johor dan Selangor kerana terletak berhampiran dengan Laut China Selatan. Sungai Langat terletak berhampiran dengan Selangor dan ia disambungkan ke Laut China Selatan. Tempat-tempat yang berhampiran dengan Sungai Langat sentiasa mempunyai masaiah banjir di setiap tahun. Kajian mi dijalankan untuk merangsang proses pemendakan-air larian sistem tadahan air . Kajian mi juga disediakan pengesahan HEC-HMS (model hidrologi) untuk data direkodkan. Selepas kedua-dua objektif kajian telah siap dibina, model yang sesuai untuk ramalan hidrograf banjir dapat dihasilkan. Dari model, mudah-mudahan ia akan dapat membantu untuk membuat keputusan bagi mengelakkan masalah banjir. HEC-HMS adalah alat untuk menghasilkan beberapa input pemodelan hidrologi. la juga boleh digunakan untuk mengenali hubungan huj an-air larian daripada Sungai Langat dalam tempoh masa yang tertentu. Daripada data hujan, hidrograf Sungai Langat boleh didapati dengan menggunakan analisis hubungan antara hujan dan air larian. Hidrograf mi digunakan untuk kajian saliran bandar dan ramalan aliran. Jadi, ia boleh menjadi panduan kepada orang yang tinggal di sepanjang Sungai Langat sedar tentang masalah banjir dan juga boleh menjadi pengurusan kawalan banjir di Sungai Langat. Dengan merujuk kepada Root Mean Square Error (RMSE) jika nilai mi dekat dengan sifar, ia dianggap sebagai yang terbaik. Nilai RMSE diperolehi untuk Rajah 4.2, Rajah 4.13, Rajah 4.14 dan Rajah 4.25 adalah 0.256 m3/s, 0.346 m3/s, 1.121 M3 /s dan 0.319 ii 3/s . Untuk kesimpulan, kaedah SCS Unit Hidrograf boleh digunakan untuk menjalankan simulasi di lembangan Sungai Langat.
TABLE OF CONTENTS SUPERVISOR'S DECLARATION STUDENT'S DECLARATION DEDICATION ACKNOWLEDGMENTS ABSTRACT ABSTRAK TABLE OF CONTENTS LIST OF FIGURES LIST OF TABLES LIST OF SYMBOLS LIST OF ABBREVIATIONS CHAPTER 1 INTRODUCTION 1.1 Background of Study 1 1.2 Problem Statement 3 1.3 Objectives of Study 4 1.4 Scopes of Study 4 1.5 Significance of Study 5
CHAPTER 2 LITERATURE REVIEW
2.1 Introduction 6
2.2 Principle of Hydrology 6
2.2.1 Watershed 6
2.2.2 Land Use 8
2.2.3 Unit Hydrograph 8
2.2.3.1 Snyder's Synthetic Unit Hydrograph 9
2.2.3.2 SCS Method 10 viii Page 11 111 iv V. vi vii Viii xi xiv xv xvi
2.2.3.3 Clark Method 11
2.3 Rainfall - Runoff Model i
2.4 HEC—HMS Software is
2.4.1 HEC - HMS Components 15
2.4.2 Precipitation for Modeling with HEC - HMS 16
2.5 Root Mean Square Error (RMSE) 17
CHAPTER 3 RESEARCH METHODOLOGY
3.1 Introduction i
3.2 Data Collection 21
3.2.1 Rainfall Data 21
3.2.2 Stream Flow Data 22
3.3 Application of HEC - HMS Software 22
3.4 Calibration, Validation and Verification Model 23
3.4.1 Calibration Process 23
3.4.2 Validation and Verification Process 23
3.5 Appropriate Model 24
CHAPTER 4 RESULT AND DISCUSSION
4.1 Introduction 25
4.2 HEC - HMS 25
4.3 Hydrograph 27
4.3.1 Hydrograph for Station Sg Lui at Kg Lui (3118445) 27
4.3.2 Hydrograph for Station Sg Langat at Kajang (2917401) 36
4.4 Evaluation of the Model through Root Mean Square Error (RMSE) 44
CHAPTER 5 CONCLUSION AND RECOMMENDATIONS
5.1 Introduction
5.3 Recommendations 46
REFERENCES 47
APPENDICES 49
A Location of RF and SF Stations 49
B Data for RF29l7ll2 50
B2 Data for RF3Ol7lO8 51
B3 Data for RF 3118103 52
B4 Data for RF3iI9001 53
B5 Data for RF 3119104 54
B6 Data for SF29l74Ol 55
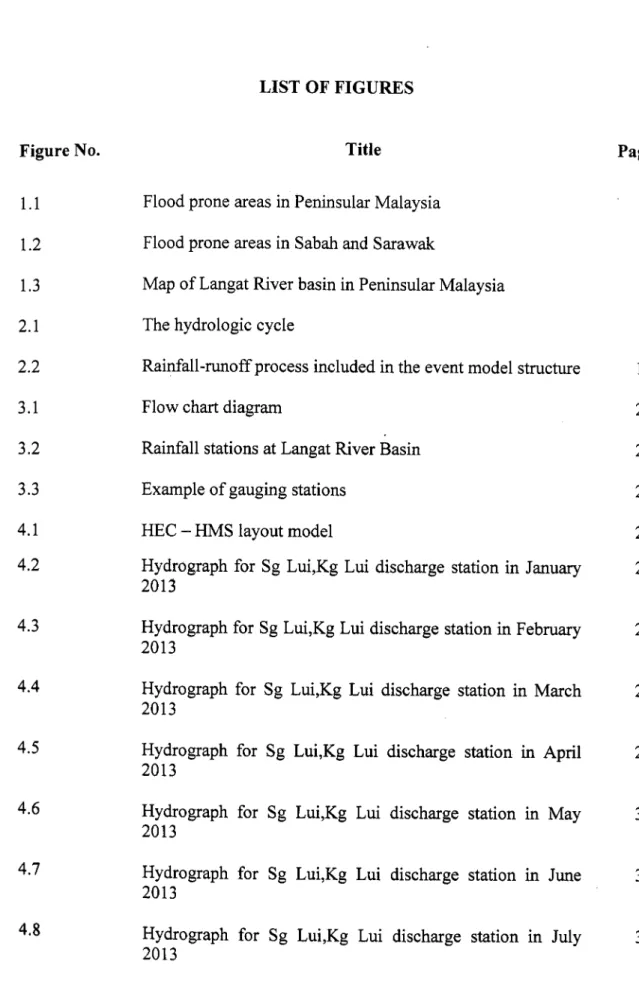
LIST OF FIGURES
Figure No. Title Page
1.1 Flood prone areas in Peninsular Malaysia 2
1.2 Flood prone areas in Sabah and Sarawak 3
1.3 Map of Langat River basin in Peninsular Malaysia 5
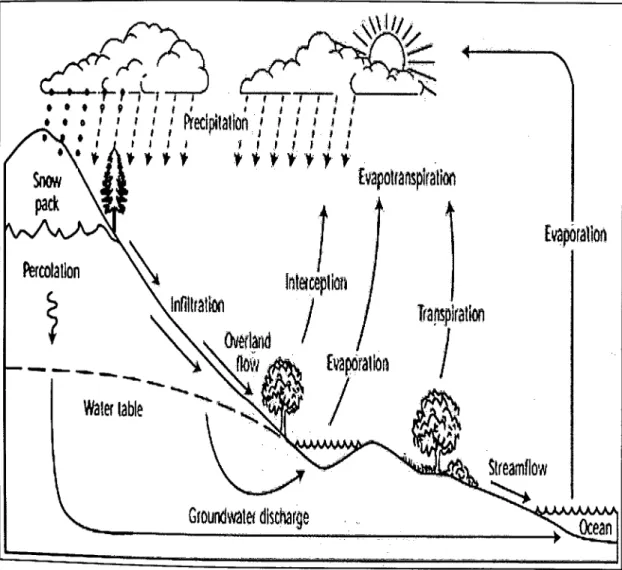
2.1 The hydrologic cycle 7
2.2 Rainfall-runoff process included in the event model structure 14
3.1 Flow chart diagram 20
3.2 Rainfall stations at Langat River Basin 21
3.3 Example of gauging stations 22
4.1 HEC - HMS layout model 26
4.2 Hydrograph for Sg Lui,Kg Lui discharge station in January 27
2013
4.3 Hydrograph for Sg Lui,Kg Lui discharge station in February 28
2013
4.4 Hydrograph for Sg Lui,Kg Lui discharge station in March 29
2013
4.5 Hydrograph for Sg Lui,Kg Lui discharge station in April 29
2013
4.6 Hydrograph for Sg Lui,Kg Lui discharge station in May 30
2013
4.7 Hydrograph for Sg Lui,Kg Lui discharge station in June 31
2013
4.8 Hydrograph for Sg Lui,Kg Lui discharge station in July 31
49 Hydrograph for Sg Lui,Kg Lui discharge station in August 32 2013
4.10 Flydrograph for Sg Lui,Kg Lui discharge station in 33
September 2013
4.11 Hydrograph for Sg Lui,Kg Lui discharge station in October 33
2013
4.12 Hydrograph for Sg Lui,Kg Lui discharge station in 34
November 2013
4.13 Hydrograph for Sg Lui,Kg Lui discharge station in 35
December 2013
4.14 Hydrograph for Sg Langat, Kajang discharge station in 36
January 2013
4.15 Hydrograph for Sg Langat, Kaijang discharge station in 37
February 2013
4.16 Hydrograph for Sg Langat, Kajang discharge station in 37
March 2013
4.17 Hydrograph for Sg Langat, Kajang discharge station in April 38
2013
4.18 Hydrograph for Sg Langat, Kajang discharge station in May 39
2013
4.19 Hydrograph for Sg Langat, Kajang discharge station in June 39
2013
4.20 Hydrograph for Sg Langat, Kajang discharge station in July 40
2013
4.21 Hydrograph for Sg Langat, Kajang discharge station in 41
August 2013
4.22 Hydrograph for Sg Langat, Kajang discharge station in 41
September 2013
4.23 Hydrograph for Sg Langat, Kajang discharge station in 42
October 2013
4.24 Hydrograph for Sg Langat, Kajang discharge station in 43
4.25 Hydrograph for Sg Langat, Kajang discharge station in 43
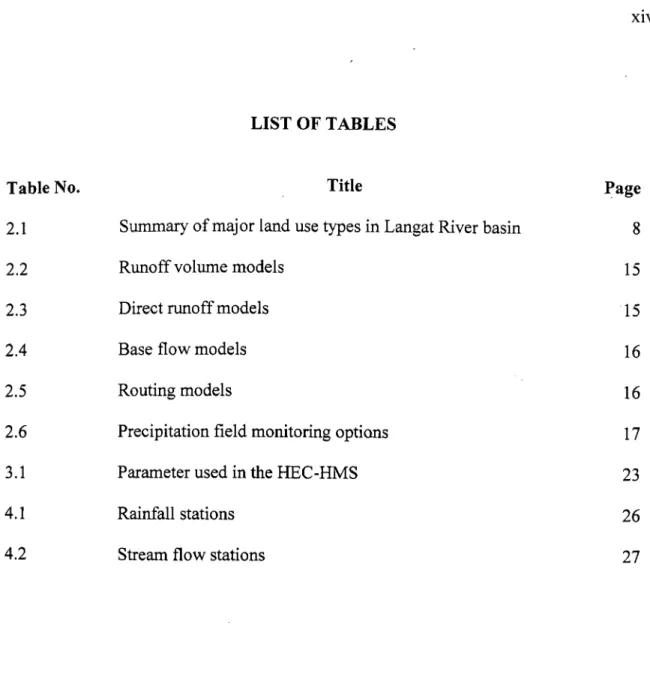
LIST OF TABLES
Table No. Title Page
2.1 Summary of major land use types in Langat River basin 8
2.2 Runoff volume models 15
2.3 Direct runoff models 15
2.4 Base flow models 16
2.5 Routing models 16
2.6 Precipitation field monitoring options 17
3.1 Parameter used in the HEC-HMS 23
4.1 Rainfall stations 26
LIST OF SYMBOLS
Q Discharge
Qobs Observed discharge
Qsim Simulated discharge
LU Land use CN Curve number TR Time of rise B Time of fall D Duration Vol Volume % Percentage
LIST OF ABBREVIATIONS
.jPs Jabatan Pengairan dan Saliran
DID Department of Irrigation and Drainage
HEC-HMS Hydrologic Modeling System
HEC-DSS Data Storage System
RF Rainfall Station
INTRODUCTION
1.1 BACKGROUND OF STUDY
Malaysia flood disaster is a phenomenon that always happens almost every year. It often occurs due to the inability of existing drainage systems are unable to cope with the flow rate and volume of runoff water that exceeds the level of the outlet such as drains and rivers.
Increasingly rapid development is also a major cause of flooding. This is because the surface flow slowed down as a result of changes in land use (from impervious surfaces such as forest to impervious surfaces such as concrete, cement and asphalt) watercourses are blocked, decreasing the ability of the river through the deposition of silt and convective storm event great.
Floods cause a lot of damage to the property and threatening residents. In all areas, drains constructed to allow for rain runoff and waste water to prevent flooding. Unplanned development also causes flooding. However, in recent years, flooding is deeply disturbing. Ineffectiveness of irrigation and drainage system is the main cause Contributing to flooding problems in our country.
j .T. .ngwu
/
(JOHOR;
\, )
3 :V J
I
.1VA%t?i
S. S.ljI.t.%• f 'S - S S S. (A*'.Figure 1.2: Flood prone areas in Sabah and Sarawak
1.2 PROBLEM STATEMENT
Flooding is the most significant natural hazard in Malaysia. Malaysia covers an area of 330,400 km2 consists two regions that is the state of Sabah and Sarawak and Peninsular Malaysia. Malaysia has experienced major floods from the years 1960 to 2003. Malaysia also is a tropical country and which is subjected to flooding in both the urban and rural areas.
Flood modelling can help to reduce the impacts of flood hazard by taking extra precautions The Langat River is located in the state of Selangor, Malaysia and it is subjected to regular flooding. Flooding is still the most significant natural hazard in Malaysia and the problem has escalated over the years as the country becomes more developed. The average annual flood damage cost is estimated to be RM100 million.
channel improvement as a solution for flood control.
1.3 OBJECTIVES OF STUDY
The objectives of this study are:
. To simulate the precipitation-runoff processes of dendritic watershed systems
. To do validation and verification of HEC- HMS (hydrological model) to recorded data.
To determine the appropriate model for flood hydrograph prediction.
1.4 SCOPES OF STUDY
The area of this study is conducted in Langat River because the frequently of flooding. In fact, the Langat River ig one of the most important rivers in Malaysia. Many town having very large population like Kajang, Dengkil, Sepang and Cheras are located along the river bank.
The Langat River Basin occupies the south and south- eastern parts of the state of Selangor Darul Ehsan. Langat River has a total catchment area 1987.8 km 2, 78 km long and 20 kin to 51.5 km wide. Pahang- Selangor borders as the source of Langat River due to its hilly terrain that reaching up to 1500 m above mean sea level.
In this study, the HEC-HMS is used to recognize the rainfall- runoff relationship of Langat River in a certain period. HEC- HMS also as a tool to produce a number of hydrologic modeling inputs. The hydrograph of Langat River can be obtained by using analysis of relationship between rainfall and runoff. Hydrographs produced by the program are used for studies of urban drainage and flow forecasting.
PA 'IA 1G WILAVAII SELANGOR
t A4
14 • •- .. .' - , 1 M '.i r.IioIiIcr SE4IILAI1Figure 13: Map of Langat River basin in Peninsular Malaysia
1.5 SIGNIFICANCE OF STUDY
Nowadays, Malaysia often occur floods that causing much losses to all parties. Flooding is a phenomenon that happen suddenly has made a difficulty for all parties to be on the alert. In this research, HEC- HMS software can be used for the flood management. It can be done by predict the flood discharge. So, it can prevent many losses to the parties involved. Besides that, the rainfall- runoff model can be determined by using analysis between the rainfall and runoff that can produced a hydrograph. The produced hydrograph can be used for flow forecasting. It also can be used to evaluate the effects of land use-land cover changes, channel modifications and storage additions.
LITERATURE REVIEW
2.1 INTRODUCTION
Water is one of the basic needs for human to survive. Nigel (2002) has claimed that people need water for drinking, washing and preparing meals every day, farmers need water to plant vegetation, development and industry need water as a raw material and for cooling agent, river are used as a transportation network and transferring waste to the sea.
Flood in Malaysia is a phenomenon that always happens in every year. According to Lim (1988), the factors that contribute to the flood is localised rainfall, inland flooding due to inadequate drainage, tidal and backwater effects and over spilling of bank due inadequate to river channel capacity. Based on the flood statistics of the National Water Resources Study carried out by the Japanese International Cooperation Agency (1982), it is estimated that 9 % of the total land area suffers from flooding affecting about 2.7 million people.
2.2 PRINCIPLE OF HYDROLOGY
2.2.1 Watershed
Based on study that had be done by New Jersey Department of Environmental Protection, a watershed is the area of land that drains into a body of water such as a river, lake, stream or bay. It is separated from other watersheds by high points in the area such as hills or slopes. It includes not only the waterway itself but also the entire
Evapôraion
land area that drains to it. For example, the watershed of a lake would include not only the streams entering that lake but also the land area that drains into those streams and eventually the lake. Drainage basins generally refer to large watersheds that encompass the watersheds of many smaller rivers and streams.
With respect to watershed, the hydrologic cycle refers to the process beginning with the water falling to earth in either liquid or solid form. The captured water is either taken up by vegetation, retained in the soil, or percolates through the soil. The water may enter into springs, streams, rivers, lakes, groundwater reservoirs or the sea. It can return to the atmosphere by evaporating and start the cycle again
\\ 1/
ZJ4_
,
If •.•ç 9gti, 'asass,
• • ' ' ' a a r a II Iji a iii ,is
• •'At
[vaponspralit 111
ltcepIionI /
I (vp&a1ior I / ow pack Percolation lnitr1i - - - Water table Slreanflow Groundwater discharge2.2.2 Land Use
According to Wong (2004), land use will change a watershed's response to precipitation. The most common effect is the reduction of infiltration especially on impervious surfaces, which significantly increase erosion, discharge and volume of storm runoff in a watershed. Then again, land development changes the pattern and distribution of runoff where natural now paths in the watershed will be replaced or supplemented by paved gutters, storm sewers, or other elements of artificial drainage.
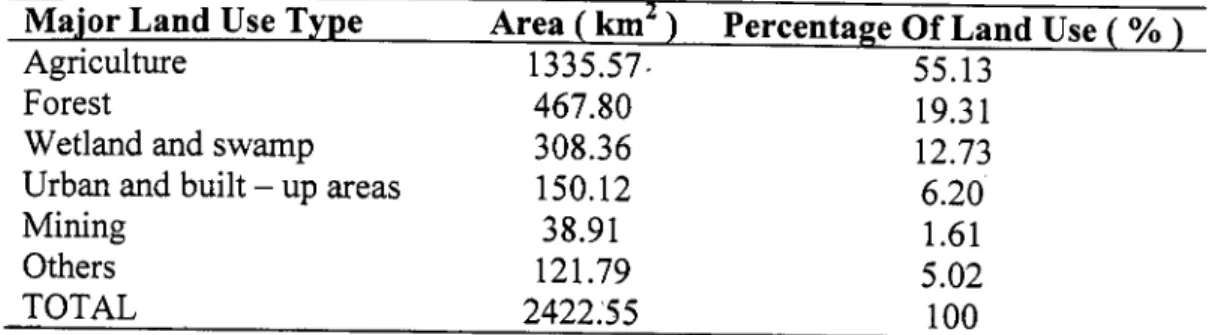
Table 2.1: Summary of major land use types in Langat River basin
Major Land Use Type Area (km) Percentage Of Land Use ( %)
Agriculture 1335.57- 55.13
Forest 467.80 19.31
Wetland and swamp 308.36 12.73
Urban and built — up areas 150.12 6.20
Mining 38.91 1.61
Others 121.79 5.02
TOTAL 2422.55 100
In general, agriculture and forest are the dominant types of land use in the Langat River Basin. The agriculture is the main land use type (55.13
%),
followed by forest (19.31 %) and wetland (12.73%).
Urban and built- up areas only occupy 6.2 % of the land use. Mining (1.61 %) is a relatively minor land use type (Ekhwan et al.,2009).2.2.3 Unit Hydrograph
A unit hydrograph is the direct runoff hydrograph produced by a storm of given duration such that the total volume of excess rainfall is 1mm. The ordinates of unit hydrograph indicate the direct runoff flow produced by the watershed for every millimetre of excess rainfall; therefore, the units are m3/sec/nmi. The discrete convolution equation allows the calculation of direct runoff for a given excess rainfall, Pm
Q n = PmUn=m+ i (2.1)
where : n = the number of runoff steps
m = the number of excess rainfall steps.
2.2.3.1 Snyder's Synthetic Unit Hydrograph
The basin lag is:
t=C(LL)°3 (2.2)
Where : C coefficient ranging from 1.8 to 2.2
L length of the basin outlet to the basin divide
L = length along the main stream to a point nearest the basin centroid.
The peak discharge rate is:
640 PCA
Q= t (2.3)
where : 640 = 2.75 for metric system
C, = storage coefficient ranging from 0.4 to 0.8 where larger values of C, are associated with smaller values of C
A = the drainage area.
The base time is:
For a small watershed, the base time is determined by multiplying t, by a value ranging from 3 to 5.
• The duration for above equations is:
D— t/5.5 (2.5)
• For other rainfall excess duration, the adjusted basin lag is:
t'—t+0.25(D-D) (2.6)
The width equations for 50% and 75% of Qp are:
W50=770(
9
.08 .W75=440( E .08
A ' A (2.7)
where 770 and 440 should be replaced with 2.14 and 1.22 when the metric unit system is used.
2.2.3.2 SCS Method
The hydrograph is represented as a simple triangle with a rainfall duration D, time of rise TR, time of fall B, and peak flow. The volume of direct runoff is:
Vo1=+E
2 2
From the analysis of historical stream flow data, B = 1.67 TR. So the peak discharge can be expressed as:
Q = ° 7 "° 1 (2.9)
The total runoff can be calculated by SCS curve number method.
(P(O4a)2
Q(t)=
(P(t)4a+S) (2.10)
where: 'a = 0.8 S. The potential maximum retention S is defined as: 1
S=---10 000 (2.11)
where: CN curve number.
2.2.3.3 Clark Method
By considering the three fundamental equations used in the Muskingum routing method:
dS=(I-O)dt (2.12)
Qx1+(1-x)o (2.13)
S=KQ (2.14)
where: I = rate of inflow o rate of outflow
S storage in reach or reservoir Q = weighted flow in the reach, in cfs x = Muskingum weighting coefficient K = Muskingum storage coefficient
From these equations, it may be shown that: K = = (I—O)clt (2.15) dQ xd1+(1—x)dO and dl dO O=I-Kx--K(1-x)— (2.16) dt dt
Solving above equation via a finite difference formulation yields the familiar Muskingum formulation:
02-0!
(2.17)
2 2 .t it
Which may be reduce to:
02 C0 12 +C 1 1 1 +C2 0 1 (2.18) where: - Kx-O.5t K-Kx+O.5t Kx-O.5t K-Kx+0.5it (2.20) K-Kx-O.Sit K-Kx+0.5L\t (2.21)
Algebraically CO, C i , C2 sum to 1.0. It is interesting to note that when the inflow has ceased (I = 0.0), the equation reduces to: