Improving Datacenter Performance and Robustness with
Multipath TCP
Costin Raiciu
†, Sebastien Barre
‡, Christopher Pluntke
†,
Adam Greenhalgh
†, Damon Wischik
†, Mark Handley
††University College London,‡Universite Catholique de Louvain,Universitatea Politehnica Bucuresti
{c.raiciu, c.pluntke, a.greenhalgh, d.wischik, mjh}@cs.ucl.ac.uk, [email protected]
ABSTRACT
The latest large-scale data centers offer higher aggregate bandwidth and robustness by creating multiple paths in the core of the net-work. To utilize this bandwidth requires different flows take differ-ent paths, which poses a challenge. In short, a single-path transport seems ill-suited to such networks.
We propose using Multipath TCP as a replacement for TCP in such data centers, as it can effectively and seamlessly use avail-able bandwidth, giving improved throughput and better fairness on many topologies. We investigate what causes these benefits, teasing apart the contribution of each of the mechanisms used by MPTCP. Using MPTCP lets us rethink data center networks, with a differ-ent mindset as to the relationship between transport protocols, rout-ing and topology. MPTCP enables topologies that srout-ingle path TCP cannot utilize. As a proof-of-concept, we present a dual-homed variant of the FatTree topology. With MPTCP, this outperforms FatTree for a wide range of workloads, but costs the same.
In existing data centers, MPTCP is readily deployable leveraging widely deployed technologies such as ECMP. We have run MPTCP on Amazon EC2 and found that it outperforms TCP by a factor of three when there is path diversity. But the biggest benefits will come when data centers are designed for multipath transports.
Categories and Subject Descriptors
C.2.2[Computer-Comms Nets]: Network Protocols
General Terms
: Algorithms, Design, Performance1.
INTRODUCTION
During the last decade, data centers have risen to dominate the computing landscape. Today’s largest data centers have hundreds of thousands of servers, and run distributed applications that spread computation and storage across many thousands of machines. With so many hosts, it is impractical to manually manage the allocation of tasks to machines. While applications may be written to take advantage of locality within the data center, large distributed com-putations inevitably are spread across many racks of machines, with the result that the network can often be the bottleneck.
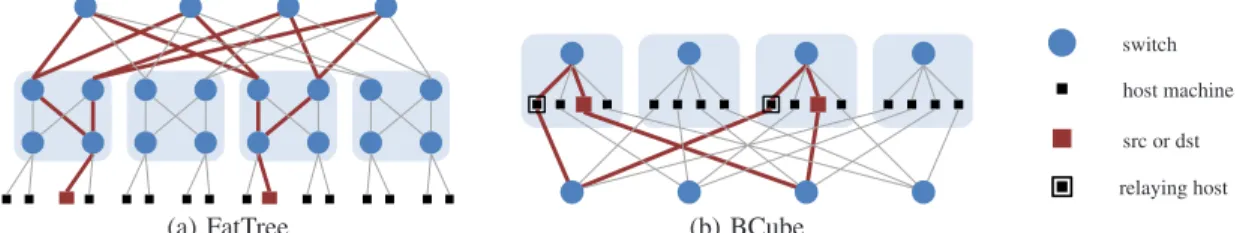
The research literature has proposed a number of data center topologies[1, 6, 7, 2] that attempt to remedy this bottleneck by pro-viding a dense interconnect structure such as those shown in Fig. 1.
Permission to make digital or hard copies of all or part of this work for personal or classroom use is granted without fee provided that copies are not made or distributed for profit or commercial advantage and that copies bear this notice and the full citation on the first page. To copy otherwise, to republish, to post on servers or to redistribute to lists, requires prior specific permission and/or a fee.
SIGCOMM’11,August 15–19, 2011, Toronto, Ontario, Canada. Copyright 2011 ACM 978-1-4503-0797-0/11/08 ...$10.00.
Topologies like these have started to be deployed; Amazon’s latest EC2 data center has such a redundant structure - between certain pairs of hosts there are many alternative paths. Typically switches run a variant of ECMP routing, randomly hashing flows to equal cost paths to balance load across the topology. However, with most such topologies it takes many simultaneous TCP connections per host to generate sufficient flows to come close to balancing traffic. With more typical load levels, using ECMP on these multi-stage topologies causes flows to collide on at least one link with high probability. In traffic patterns that should be able to fill the network, we have observed flows that only manage 10% of the throughput they might expect and total network utilization below 50%.
In this paper we examine the use of Multipath TCP [4] within large data centers. Our intuition is that by exploring multiple paths simultaneously and by linking the congestion response of subflows on different paths to move traffic away from congestion, MPTCP will lead to both higher network utilization and fairer allocation of capacity to flows.
From a high-level perspective, there are four main components to a data center networking architecture:
• Physical topology • Routing over the topology
• Selection between multiple paths supplied by routing • Congestion control of traffic on the selected paths
These are not independent; the performance of one will depend on the choices made by those preceding it in the list, and in some cases by those after it in the list. The insight that we evaluate in this paper is that MPTCP’s ability to balance load spans both path selection and congestion control, and fundamentally changes the dynamics of data center traffic management. Further, by explor-ing many paths and only utilizexplor-ing the effective ones, it enables the use of network topologies that would be inefficient with single-path TCP. Thus we set out to answer two key questions:
• MPTCP can greatly improve performance intoday’sdata cen-ters. Under which circumstances does it do so, how big are the benefits, and on what do they depend?
• If MPTCP were deployed, how might we design data centers differentlyin the futureto take advantage of its capabilities? We have examined many topologies and traffic patterns, and in almost all of them MPTCP provided significant advantages over regular single-path TCP. Where there was no benefit, flows were limited at the sending or receiving host. We found no case where MPTCP performed significantly worse than single-path TCP.
We also looked at new network topologies designed to take ad-vantage of MPTCP’s end-host load-balancing mechanisms. For example, a dual-homed FatTree running MPTCP can, for the same cost, provide twice the throughput of a single-homed FatTree run-ning MPTCP for a wide range of likely workloads. Without MPTCP, such a topology makes little sense, as the capacity is rarely usable.
(a) FatTree (b) BCube
switch host machine
src or dst relaying host
Fig. 1:Two proposed data center topologies. The bold lines show multiple paths between the source and destination. Finally we have validated the results on Amazon’s EC2 cloud
using our Linux implementation. We observed that in the EC2 data center, the2/3 of flows that have access to multiple paths achieve approximately three times the throughput using MPTCP than with regular TCP. As MPTCP is no more aggressive than TCP, this in-dicates that MPTCP is very effective at finding unused capacity.
2.
DATA CENTER NETWORKING
Before examining how MPTCP changes things, we will briefly discuss the components that comprise the data center architecture.
2.1
Topology
Traditionally data centers have been built using hierarchical topolo-gies: racks of hosts connect to a top-of-rack switch; these switches connect to aggregation switches; in turn these are connected to a core switch. Such topologies make sense if most of the traffic flows into or out of the data center. However, if most of the traffic is intra-data center, as is increasingly the trend, then there is a very uneven distribution of bandwidth. Unless traffic is localized to racks, the higher levels of the topology become a serious bottleneck.
Recent proposals address these limitations. VL2[6] and FatTree (Fig. 1(a)) are Clos[3] topologies that use multiple core switches to provide full bandwidth between any pair of hosts in the network. They differ in that FatTree uses larger quantities of lower speed (1Gb/s) links between switches, whereas VL2 uses fewer faster (10Gb/s) links. In contrast, BCube[7] abandons the hierarchy in favor of a hypercube-like topology, using hosts themselves to relay traffic (Fig. 1(b)).
All three proposals solve the traffic concentration problem at the physical level — there is enough capacity for every host to be able to transmit flat-out to another randomly chosen host. However the denseness of interconnection they provide poses its own problems when it comes to determining how traffic should be routed.
2.2
Routing
Dense interconnection topologies provide many possible parallel paths between each pair of hosts. We cannot expect the host itself to know which of these paths is the least loaded, so the routing system must spread traffic across these paths. The simplest solution is to use randomized load balancing, where each flow is assigned a random path from the set of possible paths.
In practice there are multiple ways to implement randomized load balancing in today’s switches. For example, if each switch uses a link-state routing protocol to provide ECMP forwarding then, based on a hash of the five-tuple in each packet, flows will be split roughly equally across equal length paths. VL2 provides just such a mechanism over a virtual layer 2 infrastructure.
However, in topologies such as BCube, paths vary in length, and simple ECMP cannot access many of these paths because it only hashes between the shortest paths. A simple alternative is to use multiple static VLANs to provide multiple paths that expose all the underlying network paths[9]. Either the host or the first hop switch can then hash the five-tuple to determine which path is used.
2.3
Path Selection
Solutions such as ECMP or multiple VLANs provide the basis for randomized load balancing as the default path selection mecha-nism. However, as others [2] have shown, randomized load balanc-ing cannot achieve the full bisectional bandwidth in most topolo-gies, nor is it especially fair. The problem, quite simply, is that often a random selection causes hot-spots to develop, where an un-lucky combination of random path selections cause a few links to be overloaded and links elsewhere to have little or no load.
To address these issues, the use of a centralized flow scheduler has been proposed. Large flows are assigned to lightly loaded paths and existing flows may be reassigned to maximize overall through-put[2]. The scheduler does a good job if flows are network-limited, with exponentially distributed sizes and Poisson arrivals, as shown in Hedera [2]. The intuition is that if we only schedule the big flows we can fully utilize all the bandwidth, and yet have a small scheduling cost, as dictated by the small number of flows.
However, data center traffic analysis shows that flow distribu-tions are not Pareto distributed [6]. In such cases, the scheduler has to run frequently (100ms or faster) to keep up with the flow arrivals. Yet, the scheduler is fundamentally limited in its reaction time as it has to retrieve statistics, compute placements and instantiate them, all in this scheduling period. We show later through simulation that a scheduler running every 500ms has similar performance to randomized load balancing when these assumptions do not hold.
2.4
Congestion Control
Most applications use single path TCP, and inherit TCP’s con-gestion control mechanism which does a fair job of matching of-fered load to available capacity on whichever path was selected.
In proposing the use of MPTCP, we change how the problem is partitioned. MPTCP can establish multiple subflows on different paths between the same pair of endpointsfor a single TCP con-nection. The key point is that by linking the congestion control dynamics on these multiple subflows, MPTCP can explicitly move traffic off more congested paths and place it on less congested ones. Our hypothesis is that given sufficiently many randomly cho-sen paths, MPTCP will find at least one good unloaded path, and move most of its traffic that way. In so doing it will relieve conges-tion on links that got more than their fair share of ECMP balanced flows. This in turn will allow those competing flows to achieve their full potential, maximizing the bisectional bandwidth of the network and also improving fairness. Fairness is not an abstract concept for many distributed applications; for example, when a search appli-cation is distributed across many machines, the overall completion time is determined by the slowest machine. Hence worst-case per-formance matters significantly.
3.
MULTIPATH TCP IN SUMMARY
Multipath TCP[4] extends TCP so that a single connection can be striped across multiple network paths. MPTCP support is negoti-ated in the initial SYN exchange and the client learns any additional IP addresses the server may have. Additional subflows can then be
opened. An additional subflow can be between the same pair of IP addresses as the first subflow, but using different ports, or it can use any additional IP addresses the client or server may have. In the former case, MPTCP relies on ECMP routing to hash subflows to different paths; in the latter the paths are implicitly identified by the source and destination IP addresses. Both techniques may be used, depending on the routing scheme used in a particular data center.
Once multiple subflows have been established, the sending host’s TCP stack stripes data across the subflows. Additional TCP op-tions allow the receiver to reconstruct the received data in the orig-inal order. There is no requirement for an application to be aware that MPTCP is being used in place of TCP - in our experiments we have used unmodified applications running on our MPTCP-capable Linux kernel. However enhanced applications may them-selves wish to use an extended sockets API to influence which sub-flows are set up and how data is striped between them (the full MPTCP protocol is described in [4]).
Each MPTCP subflow has its own sequence space and main-tains its own congestion window so that it can adapt to conditions along the path. Although each subflow performs TCP-like additive-increase on acks and multiplicative decrease on losses, MPTCP links the behaviour of subflows by adapting the additive increase constant. The algorithm is:
• For each ACK on subflow r, increase the window wr by
min(a/wtotal,1/wr).
• Each loss on subflowr, decrease the windowwrbywr/2. wtotalis the sum of the windows on all subflows. adetermines the
aggressiveness of all the subflows; it is calculated as described in the IETF draft specification[12].
Broadly speaking, there are two key parts to this algorithm. First, by making the window increase depend on the total window size, subflows that have large windows increase faster than subflows with small windows. This actively moves traffic from more con-gested paths to less concon-gested ones, load-balancing the network.
Second, by adaptinga, MPTCP can compensate for different RTTs and can ensure that if all the subflows of a connection traverse the same bottleneck, they will compete fairly with a regular TCP flow. However, if the subflows encounter multiple unloaded paths, one connection can fill them all. The design of the algorithm has been detailed in [14].
4.
MPTCP IN DATA CENTERS
It seems there might be three main benefits from deploying MPTCP in today’s redundant data center networks:
• Better aggregate throughput, as exploring more paths and load-balancing them properly should reduce the number of underuti-lized and idle links.
• Better fairness; the throughputs of different MPTCP connec-tions should be closer than if TCP were used, as congestion on network core links should be more evenly distributed. • Better robustness. If a link or switch fails, routing will route
around it, even without MPTCP, but this takes time. MPTCP uses many paths; if one fails the others can continue without pausing. Worse are failures that are not bad enough to trigger re-routing, but which cause link autonegotiation to fall back to a low link speed, or which cause very high packet loss rates. Single-path TCP has no choice but to trickle data through the slow path; MPTCP can simply avoid sending traffic on a very congested path.
In this section we examine the extent to which these potential ben-efits can be realized. As we will see, the benben-efits depend on:
• The congestion control scheme used. • The physical topology.
• The traffic matrix generated by the applications. • The level of load in the network.
Although we cannot predict what future data center applications will look like, we can at least map out broad areas where MPTCP gives considerable benefits and other areas where the bottleneck is elsewhere and MPTCP cannot help.
4.1
A Note on Simulation
In section 6, we give results from running our Linux MPTCP implementation on a small cluster in our lab, and on Amazon EC2. But most of the results in this paper come from simulation for two reasons. First, we do not have access to a large enough data center to examine issues of scale. But perhaps more importantly, simula-tion lets us tease apart the causes of complex behaviors.
For this paper, we wrote two simulators. The first,htsim, is a full packet level simulator that models TCP and MPTCP in similar de-tail to ns2, but which is optimized for large scale and high speeds. Even with this simulator, there are limits to what we can model. For example, simulating the 576-node Dual-homed FatTree in Section 5 with 100Mb/s links requires simulating 46,000 MPTCP subflows generating 115 Gb/s of traffic. Even a fairly small data center topol-ogy stresses the limits of simulation.
Today’s larger data centers don’t have hundreds of hosts. They have tens of thousands1. To examine these scales we must sacrifice
some accuracy and the ability to model flow arrivals, and resort to flow-level simulation. Our second simulator models TCP and MPTCP throughput as a function of loss rate, and uses an iterative approach to find the equilibrium traffic pattern for a fixed set of arbitrary duration flows.
Comparing the two approaches on the same topology shows the flow-level simulator is a fairly good predictor of packet-level per-formance for long flows. Its main limitation is at high congestion levels, where it fails to model timeouts, and so predicts higher con-gestion levels than we see in reality. We mostly use packet-level simulation, but resort to flow-level to extrapolate to larger scales.
4.2
Examples of Benefits
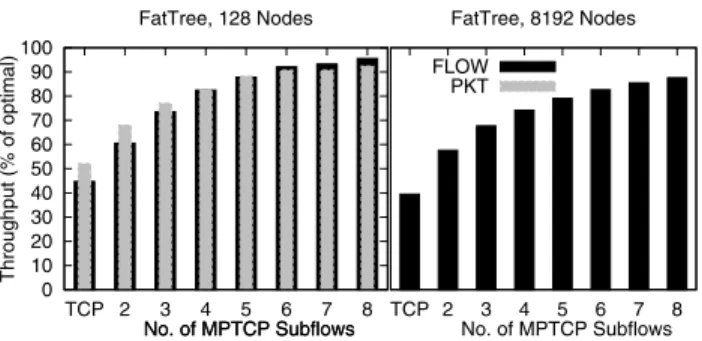
Throughput Fig. 2 shows the aggregate throughput achieved by long-lived TCP and MPTCP in a FatTree network. The left his-togram shows throughput in a FatTree with 128 hosts, 80 eight-port switches, and 100Mb/s links. The grey bars are from a de-tailed packet-level simulation, and the black bars are from the flow-level simulator. The right histogram scales up the topology to 8192 hosts, and shows only flow-level results. The traffic pattern is a permutation matrix; every host sends to one other host chosen at random, but with the constraint that no host receives more than one flow. This is a simple randomized traffic pattern that has the poten-tial to saturate the FatTree. Of the multiple shortest paths, one is chosen at random for each subflow, simulating flow-based ECMP routing.
The bars show the number of MPTCP subflows used, or in the case of single subflow, shows the behavior with regular single-path TCP. The figure illustrates several points. Single-path TCP per-forms rather poorly, achieving less then half of the available
capac-1Microsoft’s Chicago data center reputedly has the potential to hold
0 10 20 30 40 50 60 70 80 90 100 TCP 2 3 4 5 6 7 8 Throughput (% of optimal) FatTree, 128 Nodes No. of MPTCP Subflows FLOW PKT TCP 2 3 4 5 6 7 8 FatTree, 8192 Nodes
No. of MPTCP Subflows No. of MPTCP Subflows
Fig. 2:Multipath needs eight paths to get good utilization in FatTree, independent of scale
0 20 40 60 80 100 0 20 40 60 80 100 120 Throughput (% of optimal) Rank of Flow Packet-level, 128 nodes Single Path TCP MPTCP 0 2000 4000 6000 800 Rank of Flow Flow-level, 8192 nodes Single Path TCP MPTCP, 8 subflows
Fig. 3:Distribution of throughput in FatTree
ity. The reason is simple - the full capacity is only available if no two flows share the same link. Ifnflows share a link, each only achieves1/nof the capacity it should achieve. ECMP’s random hashing of a flow onto a path results in sufficiently many collisions that total throughput is less than 50% of the full bisectional band-width, while many links go idle.
MPTCP explores more paths. With the same ECMP hashing, fewer links go idle, and so total throughput increases. Interestingly, it takes around eight subflows per MPTCP connection to properly utilize the network.
Comparing the left and right histograms, we see the behavior is largely scale-invariant. In this and other experiments we find that increasing the network size by two orders of magnitude slightly reduces the overall performance for both TCP and MPTCP.
Comparing the grey and black histograms, we see that the packet and flow level simulations are in agreement about the performance benefits and the number of subflows required. The flow-level simu-lator slightly underestimates throughput in the single-path TCP and two-subflow cases.
Fairness Fig. 3 shows the throughput of individual connections from the 128 host packet level simulation and the 8,192 host flow-level simulation in Fig. 2, comparing the single-path TCP case with the eight subflow MPTCP case. Every host’s throughput is shown ranked in order of increasing throughput. Is is clear that not only did the utilization improve with MPTCP, but also the fairness im-proved. With single-path TCP, some flows perform very well, but many perform poorly, and some get less than 10% of the potential throughput. With eight subflows, most MPTCP flows get at least 90% of the available capacity, and none get less than 50%. For applications that farm work out to many workers and finish when the last worker finishes, such fairness can greatly improve overall performance.
The subtle difference between packet-level and flow-level simu-lation is also visible in these curves. The flow-level simulator does not model timeouts, so flows that traverse multiple congested links
get a little more throughput than they should. These flows then degrade the performance of competing flows that do not traverse multiple congested links, so reducing overall performance a little.
4.3
Analysis
The permutation traffic matrix used above is rather artificial, but it serves to demonstrate that MPTCP can provide substantial gains over single-path TCP in today’s data centers that are engineered to provide high bisectional bandwidth using commodity technology such as cheap gigabit switches. We will investigate where these gains come from, under which circumstances MPTCP provides large gains, and when it does not. In particular:
• How does the topology influence the performance of single-path vs MPTCP?
• How does the traffic matrix and load affect performance? • How many subflows does MPTCP require? On what does this
depend?
• Can these same benefits be provided using an application that simply opens multiple regular TCP flows?
4.3.1
Influence of Topology
We start by examining the effect that the network topology has on performance. The research literature proposes a number of dif-ferent topologies for data centers, with the aim of providing high bisectional bandwidth. Two that are particularly enlightening are VL2[6] and BCube[7].
Like FatTree, VL2 is a Clos[3] topology - essentially a multi-routed tree using multiple core switches to provide full bandwidth between any pair of hosts in the network. Unlike FatTree where every link is cheap gigabit ethernet, VL2 uses ten times fewer links in the upper layers, but uses 10-gigabit ethernet for them. With current prices, a VL2 network costs more than a FatTree topology.
We also examined a future version of VL2 that might be built when 10 gigabit ethernet becomes cheap enough to be used by all hosts. The core links in this VL2-40 network are then upgraded to run at 40Gb/s.
The BCube topology shown in Fig. 1(b) is completely different; instead of using ethernet switches to perform all the switching, it uses a hybrid of host switching and hardware switching. To route between nodes on the same ethernet switch, a direct switched path is used, but to route between nodes that do not share an ethernet switch, an intermediate host relays the traffic. This provides a very large number of possible paths between any two hosts, but some of the host’s resources are used for packet forwarding.
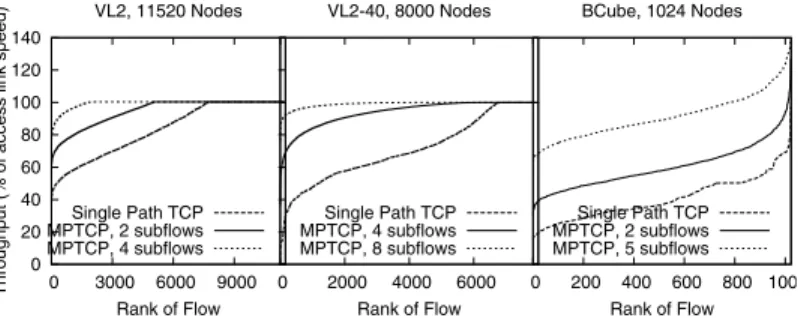
Fig. 4 shows the throughput of VL2, VL2-40 and BCube, us-ing the permutation traffic matrix for sus-ingle-path TCP and vary-ing numbers of MPTCP flows. BCube shows similar performance gains to FatTree when using MPTCP, and also requires a large number of subflows to realize these gains. With VL2, the perfor-mance gains are smaller, and most of the gains are achieved with only two subflows.
Intuitively, BCube suffers from the same problem with collisions that FatTree does - whennflows share a link, each achieves approx-imately 1/nof the capacity (unless it is constrained elsewhere). With the permutation traffic matrix, the mean number of flows on a core VL2 link should be 10. However, when ECMP randomly puts nflows on such a VL2 core link, each of those flows either achieves 1 Gb/s ifn <10, or10/nGb/s ifn >10(unless the flow is con-tained elsewhere). Thus the impact of uneven flow allocations to links is smoothed out across many more flows, and few links are severely underutilized. The result is that while FatTree needs eight
(a) VL2(11520) (b) VL2-40(8K) (c) BCube4,4(1K)
Fig. 4:VL2 and BCube throughput against number of flows, using a permutation traffic matrix.
0 20 40 60 80 100 120 140 0 3000 6000 9000
Throughput (% of access link speed)
Rank of Flow VL2, 11520 Nodes Single Path TCP MPTCP, 2 subflows MPTCP, 4 subflows 0 2000 4000 6000 Rank of Flow VL2-40, 8000 Nodes Single Path TCP MPTCP, 4 subflows MPTCP, 8 subflows 0 200 400 600 800 100 Rank of Flow BCube, 1024 Nodes Single Path TCP MPTCP, 2 subflows MPTCP, 5 subflows
Fig. 5: Flow rates with VL2, VL2-40 and BCube. With BCube, multipath flows are not limited to a single interface.
MPTCP subflows to achieve 90% throughput, on VL2 only two subflows are needed per MPTCP connection. In VL2-40, the 4:1 ratio between core and host linkspeeds increases the effect of colli-sions compared to VL2; single path TCP throughput is around 70% of optimal, and we need 4 subflows to utilize 90% of the network.
The aggregate throughput does not tell the whole story. Fig. 5 shows the rates achieved by individual flows, comparing single-path TCP with MPTCP. Although the total VL2 throughput is fairly high using single-path TCP, the fairness is relatively low with ap-proximately 25% of flows achieving less than 60% of what they should be able to achieve. While two MPTCP subflows bring most of the throughput gains, adding more subflows continues to im-prove fairness. VL2-40 gives less fairer throughputs compared to VL2; here too adding more subflows here significantly increases fairness. With BCube the distribution is similar to FatTree, except that as each BCube host has more than one interface, so hosts are not limited to the interface speed.
4.3.2
Number of Subflows
When we first started to examine MPTCP on FatTree, we were surprised that eight subflows were needed to achieve 90% through-put. Why eight, and on what does this depend? A simple analytical model casts some light on the issue.
Inm-way multipath on ak-ary FatTree, let each path contribute weight1/m. Assume a permutation traffic matrix, with random (independent) routing. The total weight on an access link is always 1. To calculate the expected number of flows on intra-pod links and pod-core links, we need to factor in that some flows stay local to the rack and some stay local to the pod. The total weight on a within-pod link is random, with an expected valueEpand variance Vp. Similarly,EcandVcfor the pod-core links:
Ep= 1−n2 n1, Ec= 1− n1 n0 Vp=Ep „„m−1 mn2 + 1 m « + „ 1− 1 n2 « „ 1−n2−1 n0−1 « −Ep « Vc=Ec „„m−1 mn1 + 1 m « +„1− 1 n1 « „ 1−n1−1 n0−1 « −Ec « n0=k 3 4, n1= k2 4, n2= k 2
Fig. 6 shows how varianceVpchanges as we add subflows for varying sizes of network.Vcis very similar. Almost independent of the size of the network, the variance settles down above eight sub-flows. Although this model is too simplistic to predict throughput (it cannot factor in how congestion on one path can free capacity on another), it captures the dominant effect that determines how many subflows are required, at least for the permutation traffic matrix.
0 0.2 0.4 0.6 0.8 1 0 2 4 6 8 10 12 14 16 Variance of Load Number of Subflows k=4 (16 hosts) k=16 (1024 hosts) k=48 (27648 hosts) limit as k->inf: 1/m
Fig. 6: Analytical model for variance of load on a link. 1 2 3 4 0 20 40 60 80 100 Aggregate Throughput (Gb/s)
Percentage of local flows MP-TCP, 4 subflows
Single-path TCP
Fig. 7: Performance with
locality, 4:1
oversub-scribed 512-node FatTree.
4.3.3
Oversubscribed Topologies
All the topologies above all aim to provide full bisectional band-width; the goal is that every host should be able to transmit at the full interface speed, regardless of the location of the destination. This would allow applications to be deployed across any set of nodes without regard to the limitations of the network topology. We have seen that even with such topologies, it is hard to actually use all the network capacity with single-path transport protocols routed using flow-based ECMP routing. But in fact the goal itself may be misleading. Such topologies are expensive, and no data center application we know of sends at its full interface rate constantly.
In a large data center, running many simultaneous applications, it is extremely unlikely that all will burst simultaneously. Thus these topologies seem to be overkill for the task at hand - they are much more expensive than is necessary.
We must therefore consider topologies that oversubscribe the network core (at least in terms of potential load, not necessarily actual load). To do this, we created a Clos-style networks, but over-subscribed the capacity of the uplinks from the top-of-rack switches by 4:1 (for every four Gb/s from the hosts in the rack, one 1Gb/s uplink capacity is provided). Again we use a permutation matrix as a baseline, but now we also need to examine what happens when the oversubscribed network is overloaded (and underloaded).
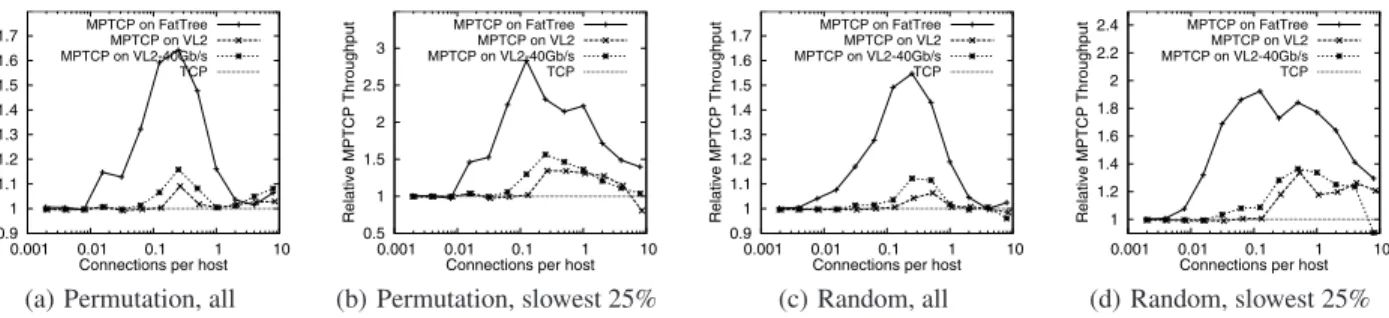
Fig. 8(a) shows what happens as we increase the number of con-nections per host; the y-axis shows the total throughput achieved by MPTCP connections using four subflows, as a multiple of the total throughput achieved by single-path TCP using the same traffic pat-tern. At very low load, the few flows that exist almost never share a link with another flow, so they saturate the host NIC with both TCP and MPTCP. At very high load levels, the core is severely congested with high packet loss, and there are sufficient flows to saturate all the links in the core, irrespective of whether MPTCP is used. For a very wide range of load in between, MPTCP pro-vides significant improvements in throughput, with the maximum improvement occuring at 0.25 connections per host, which is the
0.9 1 1.1 1.2 1.3 1.4 1.5 1.6 1.7 0.001 0.01 0.1 1 10 Relative MPTCP Throughput
Connections per host
MPTCP on FatTree MPTCP on VL2 MPTCP on VL2-40Gb/s TCP
(a) Permutation, all
0.5 1 1.5 2 2.5 3 0.001 0.01 0.1 1 10 Relative MPTCP Throughput
Connections per host
MPTCP on FatTree MPTCP on VL2 MPTCP on VL2-40Gb/s TCP (b) Permutation, slowest 25% 0.9 1 1.1 1.2 1.3 1.4 1.5 1.6 1.7 0.001 0.01 0.1 1 10 Relative MPTCP Throughput
Connections per host
MPTCP on FatTree MPTCP on VL2 MPTCP on VL2-40Gb/s TCP (c) Random, all 1 1.2 1.4 1.6 1.8 2 2.2 2.4 0.001 0.01 0.1 1 10 Relative MPTCP Throughput
Connections per host
MPTCP on FatTree MPTCP on VL2 MPTCP on VL2-40Gb/s TCP
(d) Random, slowest 25%
Fig. 8:Relative MPTCP performance as a function of load when running Permutation or Random traffic matrices for differing topolo-gies. Mean performance and the performance of the slowest quarter of flows are shown.
minimum load level to fill a 4:1 oversubscribed topology. The av-erage throughput improvement depends on the topology used; the maximum for oversubscribed Fat-Tree is 65%, while VL2-40 and VL2 improve by 15% and 11% respectively.
It is also instructive to look at the speeds of the slower flows in these experiments, as these dictate when jobs finish. The average improvement again depends on topology and load, but the gains are bigger: MPTCP improves throughput for the slowest flows by 1.5x to 3x for medium to moderately high load levels.
There is one exception for a highly loaded VL2 where the slower flows have lower throughput with MPTCP. On closer inspection, in turns out that the slow flows have very small windows on each of their subflows, which leads to repeated timeouts and reduced throughput for those flows; this is despite total network throughput being higher for MPTCP compared to TCP. For VL2-40 and Fat Tree the same effect does not apply, as there is more heterogeneity in the speeds of the individual subflows; at least one or a few of these have a big enough window to avoid timeouts. A very simple heuristic can be applied to avoid VL2 throughput degradation for small flows: if the stack has many subflows with small windows, it will close some of them to reduce until the remaining windows are big enough to avoid timeouts.
Irrespective of whether MPTCP is used, we believe data center designers will be likely to attempt to engineer their networks so that the core is neither underloaded nor overloaded. An overloaded core is a performance bottleneck; an underloaded core costs money that would have been better spent elsewhere. So it appears likely that the sweet-spot for MPTCP is close to the load level for which the data center designer would provision.
4.3.4
Influence of the Traffic Matrix
The permutation traffic matrix is useful as a baseline for compar-ison because it is easy to reason about how much throughput should be available from the network. With a topology that provides full bisectional bandwidth, the load is just sufficient to fully load the network. It is however, not terribly realistic.
A random traffic matrix chooses randomly the sources and des-tinations, allowing traffic concentrations on access links. Because of this, traffic flowing through the core is much less than in a per-mutation TM for the same number of flows.
Fig. 8(c) shows average throughput improvement with MPTCP vs. TCP in the Fat Tree, VL2 and VL2-40 4:1 oversubscribed topologies. The results are very similar to the permutation TM, but the relative improvements are slightly smaller; this is the effect of access link collisions. Fig. 8(d) shows the throughput improvement for the slowest 25% of flows; MPTCP increases their throughput on average by 1.3 to 1.8 times, for a wide range of loads.
We ran the same experiments with full-bisection topologies. Fat-Tree improved by maximum of 30%, while BCube improved by 150% to 300%, depending on the load level. The BCube
improve-ments come from MPTCP’s ability to simultaneously use multiple interfaces for the same flow.
Full-bisection VL2 and VL2-40 showed no improvement, which was puzzling. To understand this effect, say we randomly allocate nflows tonhosts. The probability that a host sends no flow is:
p[no flow] = „ 1− 1 n «n →1e
The number of hosts that do not send are thenne; this bounds the total throughput. In fact the throughput is lower. For example, of the hosts that send only one flow, many of these will be received by a host receiving more than one flow, so the sender will be unable to send at its full speed. Numerical analysis shows that when this is taken into account, the maximum achievable throughput byany
load-balancing algorithm with random traffic is limited by collid-ing flows on the sendcollid-ing and receivcollid-ing hosts to less than 12 of the bisectional bandwidth.
With such a workload, none of VL2’s 10Gb/s core links is ever saturated, so it makes no difference if TCP or MPTCP is used.
Locality of Traffic The random and permutation traffic matri-ces provide no locality of traffic. With a full bisection topology, it should in principle not be necessary for applications to local-ize traffic, although as we have seen, this is only really true under very light or heavy loads, or when multipath transport uses suffi-ciently many paths. However, with oversubscribed topologies, ap-plications can always get better performance if they can localize traffic to the rack, because that part of the topology is not oversub-scribed. MPTCP provides no performance improvement within the rack, because such flows are limited by their link to the top-of-rack switch. Just how good does application-based traffic localization have to be for the advantages of MPTCP to be nullified?
We simulated a 4:1 oversubscribed FatTree and generated a ran-dom traffic matrix, with the constraint that a fraction of the flows were destined for a random host with the sender’s rack, while the rest were destined for an unconstrained random host. Every host sends one flow, so without locality this corresponds to the 1 flow-per-host data point from Fig. 8(a) - a rather heavily loaded network. Fig. 7 shows the aggregate throughput as locality is increased. Un-surprisingly, as traffic moves from the oversubscribed core to the non-oversubscribed local hosts, aggregate performance increases. However, MPTCP continues to provide approximately the same performance benefits until around 75% of the flows are rack-local. Above this point the network core is lightly loaded, and all flows are limited by the sending or receiving hosts, so MPTCP provides no improvement. We see similar benefit with a localized permutation traffic matrix, though the absolute throughput values are higher.
Finally, we examined many-to-one traffic patterns; there the ac-cess links are heavily congested, no alternative paths are available, and so MPTCP and TCP behave similarly.
0 20 40 60 80 100 20 40 60 80 100 120 Throughput (Mb/s) Rank of Flow MPTCP EWTCP UNCOUPLED Packet Scatter Single Path
Fig. 9: Individual flow throughputs with different algorithms
0 0.5 1 1.5 2 0 50 100 150 200 250 Loss Rate Rank of Link Core Links 0 50 100 Rank of Link Access Links MPTCP EWTCP UNCOUPLED Packet Scatter Single Path
Fig. 10:Individual link loss rates from Figure 9 0 20 40 60 80 100 0 20 40 60 80 100 120 Throughput (%) Rank of Flow MPTCP EWTCP UNCOUPLED Packet Scatter TCP
Fig. 11:Effects of a hot spot on the dif-ferent algorithms
4.3.5
Influence of Congestion Control
Do we need all of MPTCP’s mechanisms to get the performance and fairness benefits above? MPTCP establishes multiple subflows per connection, and links the congestion control behavior of these subflows to achieve two goals:
• It is fair to single-path TCP flows, even when multiple subflows of a connection traverse the same bottleneck.
• It explicitly moves traffic from the more congested subflows to the less congested subflows.
To understand what is going on, we must tease apart the mecha-nisms. We compare MPTCP with these algorithms:
Uncoupled TCP. Each subflow behaves independently, exactly as if an application had opened multiple TCP connections and striped data across them. An UNCOUPLEDflow will be un-fair to regular TCP; if it hasnsubflows through a bottleneck, it will achieve approximatelyn times the throughput of a competing TCP.
Equally-Weighted TCP (EWTCP). Each subflow runs TCP’s ad-ditive increase, multiplicative decrease algorithm, but the in-crease constant is dein-creased depending on the number of ac-tive subflows. An EWTCP flow will be fair to regular TCP at a bottleneck, even if all the EWTCP subflows traverse that bottleneck. However, it will not actively move traffic away from congested paths.
A rather different multipath solution would be to deploy
per-packetECMP multipath routing, spreading the packets of a single flow across multiple paths, as opposed to per-flow ECMP which hashes the five-tuple to maintain a consistent path for each flow. For this to work, a single-path TCP endpoint must be modified to avoid unintentionally treating reordering as an indicator of packet loss. Thus we also tested:
PACKETSCATTER. The switches perform per-packet load bal-ancing across all the available alternative paths. The TCP sender runs a more robust fast-retransmit algorithm, but re-tains a single congestion window as it is unaware of the mul-tiple paths.
Fig. 9 shows the throughputs of individual connections for each algorithm. This is a packet-level simulation with 128 nodes in a FatTree topology, running a permutation traffic matrix of long flows. The result sugegsts that it does not matter whether multipath transport is performed within TCP, or at the application level, and that the load balancing aspects of MPTCP’s linked congestion con-trol do not greatly affect throughput. In fact the best performance is
50 100 150 200 250 300
p(t)
Short Flow Completion Time (ms) MPTCP EWTCP UNCOUPLED Packet Scatter Single-path TCP
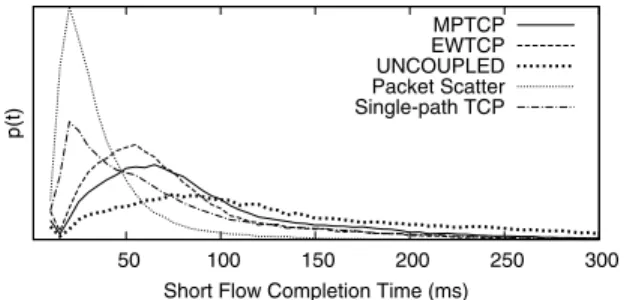
Fig. 12: The effect of short flows competing with different multipath congestion controllers
given by PACKETSCATTER, which spreads over all possible paths, but as we shall see, this result is fragile and only applies to over-provisioned networks with no hot spots.
It is clear that many of the performance benefits seen so far are the results of spreading load over many paths. Given this result, is there any reason to deploy MPTCP, as opposed to multipath-capable applications running over regular TCP?
To understand the differences between these algorithms, we have to look more closely. Fig. 10 shows the loss rates for all the links of the FatTree topology used in Fig. 9. We show core links sepa-rately from access links because congesting the core is qualitatively different from self-congestion at the host’s own NIC.
UNCOUPLEDTCP is clearly much more aggressive than single-path TCP, resulting in much higher packet loss rates, both in the core and access links. Although this does not directly impact per-formance for long-running UNCOUPLEDflows, it does affect com-peting traffic.
MPTCP, EWTCP and Single-path TCP are equally aggressive overall, and so congest the access links equally. In the core, MPTCP performs as expected, and moves traffic from the more congested to the less congested paths, relieving congestion at hot spots. EWTCP lacks this active load redistribution, so although it does not increase loss at hot spots, it doesn’t effectively relieve it either. EWTCP is also not as aggressive as MPTCP on the less loaded paths, so it misses sending opportunities and gets slightly lower throughput.
With per-packet round-robin ECMP, PACKETSCATTERcannot congest the core links; consequently the losses required to constrain its transmit rate are concentrated on access links.
Short Flows Fig. 12 examines how the algorithms affect com-peting short flows. The topology is the 4:1 oversubscribed Fat-Tree; each host sends to one other host; 33% send a continuous flow using either TCP or one of the multipath algorithms,
provid-ing enough traffic to congest the core. The remainprovid-ing hosts send one 70 Kbyte file on average every 200ms (poisson arrivals) using single-path TCP (ECMP sends each via a new path), and we mea-sure how long these flows take to complete. The averages in these experiments are:
Algorithm Short Flow Finish Network Core
Time (mean/stdev) Utilization SINGLE-PATHTCP 78±108 ms 25% PACKETSCATTER 42±63 ms 30%
EWTCP 80±89 ms 57%
MPTCP 97±106 ms 62%
UNCOUPLED 152±158 ms 65%
It is clear that UNCOUPLEDsignificantly hurts the short flows. Single-path TCP fails to spread load within the core, so while many short flows complete faster, some encounter more congestion and finish slower. MPTCP fills the core, but isn’t overly aggressive, having much less impact than UNCOUPLED. Compared to TCP, MPTCP increases mean completion time by 25% but decreases the finish time of the slowest short flows by 10%. EWTCP has less impact on short flows than MPTCP, which should not be surpris-ing - while it does use multiple paths, it does not load-balance as effectively as MPTCP, failing to use capacity quickly where it is available.
PACKETSCATTERlets short flows finish quickest, but gets very low network utilization, close to what TCP provides. This is be-cause long flows back off on all paths as soon as one path looks congested, despite congestion being transient due to short flows. MPTCP achieves almost all of the performance that UNCOUPLED
can manage, but its lower aggressiveness and better load balancing greatly reduce impact on competing traffic.
Robustness What happens when there is a hot spot in the net-work? We drop a single link in the core network from 1Gb/s to 100Mb/s. Such a failure is quite common: Gigabit ethernet requires two copper pairs in a Cat-5e cable; if one RJ45 conductor fails to seat properly, it can fall back to 100Mb/s which only requires a sin-gle pair. Similar results would be seen if a sinsin-gle unresponsive flow saturated one link (e.g. a FCoE or UDP flow).
Results, shown in Fig. 11, show that MPTCP does what it de-signed to do, moving traffic off the hot link onto alternative paths; other flows then move some of their traffic off these alternative paths, and so on, so the effect of the failure is negligible. EWTCP and UNCOUPLEDdo not shift traffic away from congestion, giv-ing less throughput to the flows that pass through the bottleneck. PACKETSCATTERbehaves worst: it has no way to separate the bad link from the good ones. It just observes a high loss rate, and backs off. Every single connection that has any available path through the bad link achieves about 10% of the throughput it should achieve.
Network Efficiency The example below shows another difference between EWTCP and MPTCP, and is taken from [14]. If there are multiple different length paths to a destination, pathological traf-fic matrices are possible where the network resources are wasted. MPTCP will explicitly move traffic off the paths that traverse mul-tiple congested links, avoiding such pathologies. Such examples do not occur in FatTree-style topologies, but they can occur with BCube.
To illustrate the issue, consider a many-to-one traffic matrix, as in a distributed file system read from many servers. Typically the
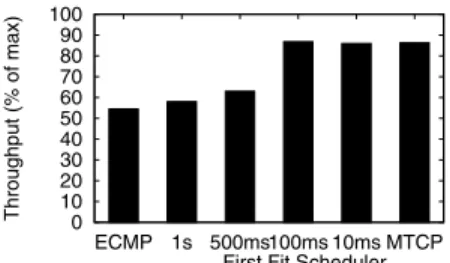
0 10 20 30 40 50 60 70 80 90 100 ECMP 1s 500ms100ms 10ms MTCP Throughput (% of max)
First Fit Scheduler
Fig. 13: First-fit scheduling compared to flow ECMP and MPTCP
distributed file systems store the data on hosts close in the network, to allow higher throughput writes. In our experiment each host reads from 12 other hosts, chosen to be the host’s neighbors in the three levels in BCube(4,3). The per-host total read throughputs are:
SINGLE-PATH 297 Mb/s
EWTCP 229 Mb/s
MPTCP 272 Mb/s
PACKETSCATTER 115 Mb/s
Due to the locality, single-path TCP can saturate all three of the host’s 100 Mb/s NICs, and achieves maximum throughput. EWTCP uses multiple paths and long paths congest short ones. MPTCP’s linked congestion control mechanism moves almost all of the traf-fic onto the shortest path, avoiding paths that traverse multiple con-gested links, and so greatly reduces the self-congestion.
PACKETSCATTERsuffers particularly badly in this case. It spreads traffic across both short and longer paths, and with this regular traf-fic matrix it actually succeeds in equalizing the loss rate across all paths. However, most of the traffic takes multi-hop paths using the network very inefficiently. If we wish to take advantage of multi-path in the cases where it benefits flows and also avoid this scenario and that of Fig. 11, it seems inevitable that each subflow must have its own sequence space and congestion window[11]. These choices dictate the core design of MPTCP.
4.4
Scheduling and Dynamic Flow Arrivals
With single-path TCP is it clear that ECMP’s randomized load balancing does not perform sufficiently well unless the topology has been specifically tailored for it, as with VL2. Even with VL2, MPTCP can increase fairness and performance significantly.
ECMP however is not the only single path selection algorithm; Hedera proposes using a centralized scheduler to supplement ran-dom load balancing, with the goal of explicitly allocating large flows to paths. Specifically, Hedera flows start off using ECMP, but are measured by the centralized scheduler. If, during a schedul-ing period, a flow’s average throughput is greater than 10% of the interface speed, it is explicitly scheduled. How well does MPTCP compare with centralized scheduling?
This evaluation is more difficult; the performance of a scheduler can depend on lag in flow measurement, path configuration, and TCP’s response to path reconfiguration. Similarly the performance of MPTCP can depend on how quickly new subflows can slowstart. We use a 128-host FatTree running a permutation traffic ma-trix with closed loop flow arrivals (one flow finishes, another one starts). Flow sizes come from the VL2 dataset. We measure through-puts for single-path TCP with ECMP, MPTCP (8 subflows), and a centralized scheduler using the First Fit heuristic Hedera [2].2
The total throughput is shown in Fig. 13. Again, MPTCP out-performs TCP over ECMP. Centralized scheduler performance de-pends on how frequently it is run. In [2] it is run every 5
sec-2First Fit is much faster than Simulated Annealing; execution speed
onds. Our results show it needs to run every 100ms to approach the performance of MPTCP; even if it runs every 500ms there is lit-tle benefit because in high bandwidth data center even large flows complete in around a second.
Host-limited Flows Hedera’s flow scheduling algorithm is based on the assumption that it only needs to schedule long-lived flows because they contribute most of the bytes. Other flows are treated as background noise. It also assumes that a flow it schedules onto an unused link is capable of increasing to fill that link.
Both assumptions can be violated by flows which are end-host limited and so cannot increase their rate. For example, network bandwidth can exceed disk performance for many workloads. Host-limited flows can be long lived and transfer a great deal of data, but never exceed the scheduling threshold. These flows are ignored by the scheduler and can collide with scheduled flows. Perhaps worse, a host-limited flow might just exceed the threshold for scheduling, be assigned to an empty path, and be unable to fill it, wasting capac-ity. We ran simulations using a permutation matrix where each host sends two flows; one is host-limited and the other is not. When the host-limited flows have throughput just below the 10% scheduling threshold, Hedera’s throughput drops 20%. When the same flows are just above the threshold for scheduling it costs Hedera 17%.
Scheduling App Limited Flows
Threshold Over-Threshold Under-Threshold
5% -21% -22%
10% -17% -21%
20% -22% -23%
50% -51% -45%
The table shows the 10% threshold is a sweet spot; changing it either caused too few flows to be scheduled, or wasted capacity when a scheduled flow cannot expand to fill the path. In contrast, MPTCP makes no such assumptions. It responds correctly to com-peting host-limited flows, consistently obtaining high throughput.
5.
EVOLVING TOPOLOGIES WITH MPTCP
Our previous experiments showed that only a few workloads saturate the core of full-bisection topologies; these workloads are somewhat artificial. To justify full-bisection topologies requires:
• There is no locality to the traffic.
• There are times when all hosts wish to send flat-out. • There is no concentration of traffic on any access link. In practice, none of these assumptions seem valid, so building a topology that provides full bisectional bandwidth seems to be a waste of money.
In section 4.3.3, we examined an oversubscribed FatTree: one where for the same core network we connected four times as many hosts. This seems a more likely topology, and hits a better balance between being bottlenecked on the core and being bottlenecked on host access links. It also takes advantage of any locality provided by the application. For example, HDFS places two out of three replicas in the same rack, and map jobs in MapReduce are assigned to servers in the same rack as the data. For such topologies, MPTCP cannot help much with the local traffic, but it does ensure the core is used to maximal effect.
If we now take a leap and assume all hosts in the data center support MPTCP, then we should also ask whether different topolo-gies enabled by MPTCP would perform even better. The obvious place to start is to consider cases where the workloads we have examined are bottlenecked on the access links between the hosts
Fig. 14:Dual-homing in the Fat Tree Topology
and the top-of-rack (ToR) switches. These cases can only be im-proved by adding more capacity, but moving to 10Gb/s ethernet is expensive. With single-path TCP, there is limited benefit from ad-ditional 1Gb/s ethernet links to the ToR switches, because a single flow cannot utilize more than one path. MPTCP does not have this limitation. Almost all current servers ship with dual gigabit ether-net onboard, so an obvious solution is to dual-home hosts to ToR switches, as shown in Fig.14. Whether to overprovision the core is then an additional question a data center operator must consider, based on predicted workload.
For our experiments, we wish to keep the cost of the network constant, so we can directly compare new and existing topologies. To do so, we impose the artificial constraint that the number of switch ports remains constant, but that we can move ports from one place in the topology to another3.
Consider the following two topologies:
Perfect Switch . FatTree and VL2 both try to emulate a single huge non-blocking switch. VL2 comes closer to succeeding than FatTree does, but a perfect switch serves as a good con-trol experiment, giving an upper bound on what any network core might provide using single links to the hosts.
Dual-homed FatTree (DHFT) . A full FatTree requires five switch ports per host; one is to the host and four connect the links between the two layers of switches. If we remove one port per host from the core and use it to connect the second inter-face on each server, the network requires the same number of switch ports.
To produce a regular DHFT topology with this ratio of core-to-access capacity, we start with ak-port FatTree topology. We leave the upper-pod switches and aggregation switches the same, and replace each top-of-rack switch with two 11k/12port switches. With FatTree, each ToR switch hadk/2uplinks and connectedk/2 hosts. With DHFT, each pair of DHFT ToR switches still hask/2 uplinks, but have4k/3downlinks, supporting2k/3hosts between them. In total, there are still five switch ports per host.
For sensible values ofk, we cannot produce fully regular DHFT and FatTree networks with the same number of ports per host. For this reason we compare DHFT with the Perfect Switch, which should underestimate the benefits of DHFT.
5.1
Analysis
Effects of Locality It is not our aim to show that DHFT is in any sense optimal; we cannot define optimality without knowing the workload and which metrics are most important. Rather, we aim to show that MPTCP creates new options for data center topologies; DHFT is a simple example of such a topology.
DHFT presents opportunities single path TCP can’t exploit. If the network is underutilized, any pair of communicating hosts should be able to utilize both their NICs, reaching a throughput of 2Gb/s.
3
In a real network, the ports per switch would be fixed, and the number of hosts and switches varied, but this does not allow for a fair comparison, independent of the prices of hosts and switches
0 20 40 60 80 100 120 0 20 40 60 80 100
Total Network Throughput (Gb/s)
Locality (percent) Single-path region Multi-path region Perfect Switch TCP MPTCP
Fig. 15: Performance as a function of locality in the DHFT topology
0.6 0.8 1 1.2 1.4 1.6 1.8 2 2.2 0.001 0.01 0.1 1 10 Relative throughput
Connections per host MPTCP DHFT
TCP DHFT TCP Perfect Switch
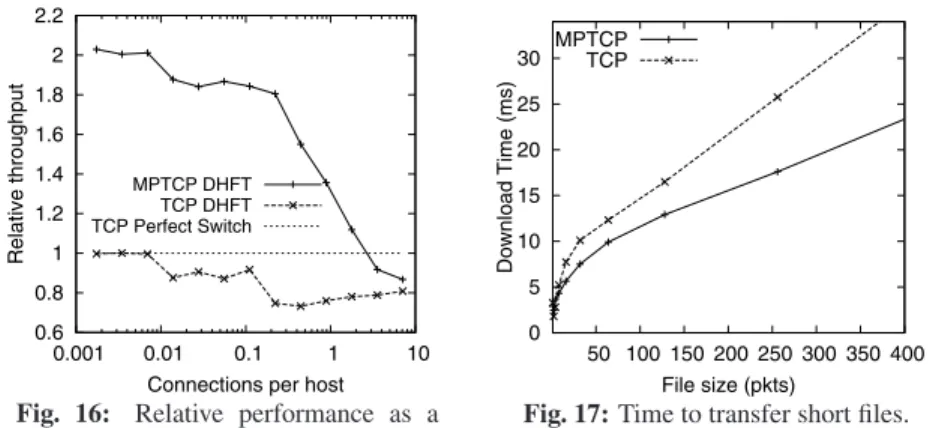
Fig. 16: Relative performance as a function of load in the DHFT
0 5 10 15 20 25 30 50 100 150 200 250 300 350 400 Download Time (ms) File size (pkts) MPTCP TCP
Fig. 17:Time to transfer short files.
We wish to tease apart the effects of the topology from the effects of running MPTCP over the topology. We compare:
• TCP over the Perfect Switch.This is the control experiment, and is an upper bound on what TCP can do in any single-homed topology. As there are no parallel paths, MPTCP cannot help on a Perfect Switch. Locality also has no effect on the results. • Single-path TCP over DHFT.Although DHFT is not ideal for
TCP, this provides a baseline for comparison.
• MPTCP over DHFT.We wish to understand when MPTCP over DHFT outperforms any single-homed topology, and see how much of this is due to MPTCP.
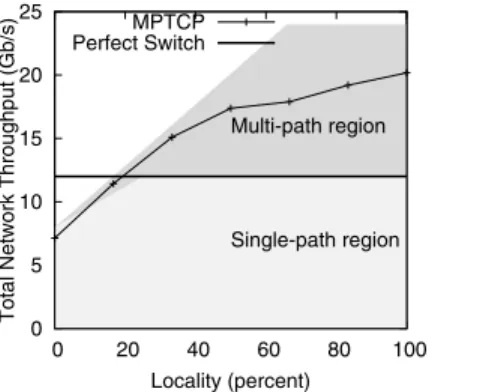
Our first experiment shown in Fig. 15 is a packet-level simula-tion of the permutasimula-tion traffic matrix, using long-lived flows with varying degrees of intra-ToR traffic locality. The DHFT network has k=12, giving 576 hosts, and 100Mb/s links, giving a maximum throughput of 43 Gb/s if no traffic is local, and 115 Gb/s if all the traffic is local to the rack and both links from each host are used. The dark grey region shows throughputs that are feasible as locality changes. If only one of the two interfaces on each host is used, as is the case with single-path TCP, then the light grey region shows the possible throughputs.
Our baseline for comparison is a perfect switch directly connect-ing all 576 hosts via 100Mb/s links. This provides an upper bound on what a regular FatTree with the same number of switch ports as the DHFT could achieve with perfect traffic scheduling.
MPTCP using eight subflows achieves close to the theoretical maximum for all degrees of locality. In contrast, due to flow col-lisions on core links, single-path TCP does not even come close to the theoretical single-path limits until most of the traffic is not us-ing the core. If the traffic resembles a permutation traffic matrix, building a DHFT topology without MPTCP makes little sense.
If no traffic is local, MPTCP on DHFT is outperformed by the Perfect Switch. But to achieve no locality requires effort - even with a random traffic, some flows stay local to the rack. In practice, applications often adaptively arrange for processing to take advan-tage of locality. MPTCP on DHFT outperforms the Perfect Switch when at least 12% of traffic is local, and costs the same in switch ports as a FatTree that is strictly worse than a Perfect Switch.
Effects of Load With a random traffic matrix, throughput can be limited by access links collisions. For single-path TCP, a DHFT can reduce this bottleneck, improving performance. Collisions in the DHFT core remain an issue though. The benefits are much greater for MPTCP, as it can utilize both access links even when there are no collisions. Fig. 16 shows how performance depends
on load. At light-to-medium load, MPTCP achieves nearly twice the performance of the perfect switch. At high load, the DHFT core is the bottleneck, and the Perfect Switch core has higher bandwidth. Interestingly, if we keep adding connections, we expect that around 20 connections per host MPTCP will again start to get more through-put than the perfect switch as more hosts gain at least one rack-local connection. In the extreme, an all-to-all traffic matrix will achieve twice the throughput of the perfect switch, with most traffic being rack-local flows. Such extreme workloads push the limits of our packet-level simulator, and have no practical relevance.
5.2
Discussion
DHFT costs the same as a Fat Tree (same port count), but has more links in the access. It provides benefits for traffic patterns with hotspots, and those where the network core is underutilized. Compared to an idealized Fat Tree (i.e. perfect switch), DHFT’s worst case performance is 75% and best case is around 200%. If all traffic matrices we analyzed are equally likely to appear in prac-tice, DHFT trades a bit of worst-case performance for substantial average-case gains.
Beyond performance, DHFT improves robustness: any lower-pod switch failure does not cut-off an entire rack of servers. As most racks have dual power supplies, switch redundancy eliminates the biggest single cause for correlated node failures. In turn, this will likely increase application locality; for instance HDFS could choose to store all three replicas of each block in the same rack.
DHFT is not optimal by any measure, but it shows that we can create topologies with better performanceifwe assume MPTCP is the transport protocol. DHFT makes little sense with TCP, as most of the benefits vanish either due to collisions in the core or TCP’s inability to use multiple interfaces for a single connection.
With MPTCP as transport, a wider range of topologies are cost-effective. Multipath TCP allows us to linearly scale bisection band-width for the same increase in cost. For instance, to create a topol-ogy with 2Gb/s full bisection bandwidth, we could use ak-port Fat Tree withk3/8dual-homed hosts. Transport flows would need to be split across different host interfaces to reach 2Gb/s. Single path TCP can’t effectively utilize such a topology.
For really large data centers with hundreds of thousands of hosts, Fat Tree may not be feasible to deploy. We expect there will be is-lands of Fat Trees, connected to a super core with 10Gb/s uplinks.
6.
EXPERIMENTAL VALIDATION
Simulation is only as good as our ability to predict which prop-erties of the environment we are modeling will turn out to be
0 5 10 15 20 25 0 20 40 60 80 100
Total Network Throughput (Gb/s)
Locality (percent) Single-path region Multi-path region MPTCP
Perfect Switch
Fig. 18: Performance as a function of locality in the DHFT testbed
0 200 400 600 800 1000 1200 1400 0 1 2 3 4 5 6 7 8 9 Throughput (Mb/s) Time (s)
Core Link Fails to 100Mb/s
Fig. 19:Robustness to Link Failures in the DHFT testbed 0 100 200 300 400 500 600 700 800 900 1000 0 500 1000 1500 2000 2500 3000 Throughput (Mb/s) Flow Rank MPTCP, 4 subflows MPTCP, 2 subflows TCP
Fig. 20: 12 hours of throughput, all paths between forty EC2 nodes. portant. Ideally we would cross-validate results against the full
im-plementation. We had two opportinities to do this.
First, we built several small FatTree-like topologies in our lab, with 12 hosts and 7 switches. Although this is too small to see various statistical multiplexing effects, it does provide a controlled enviroment for experimentation. We primarily use this for mi-crobenchmarks to validate aspects that cannot be accurately mod-eled in simulation.
Our second opportunity was to rent virtual machines on Ama-zon’s Elastic Compute Cloud (EC2). This is a real large-scale pro-duction data center, but we can only infer topology and we cannot control or even measure competing traffic.
6.1
Microbenchmarks
Our Linux implementation is still research-grade code; it has not been optimized and mature code should perform better. All the same, it is important to verify that the implementation is capable of the performance indicated in the simulations. In particular, if eight subflows per connection are needed, can the implementation cope?
0 10 20 30 40 50 1 2 3 4 5 6 7 8 9 10 11 12 13 14 15 16 17 CPU Load (%) Number of Subflows Client Server
The histogram above shows host CPU load as the client sends to the server saturating a Gigabit link. Both machines are 2006-era, with 2.2GHz single-core Opteron CPUs. Even on old machines, growing beyond two subflows only increases CPU load by 10%.
Should MPTCP be enabled for all TCP connections in a data center? We connected two dual-interface machines to a gigabit switch, and measured the time to setup a connection and transfer a short file. TCP can only use one interface; MPTCP can also use the second, but only after the first subflow has negotiated the use of MPTCP and the second subflow has been established. Figure 17 shows that TCP is quicker for files of less than about 10 packets, but much slower thereafter. To avoid penalizing short flows, the code just needs to wait two RTTs after data transmission starts (or until the window of the first subflow is big enough) and only then start a second subflow.
6.2
DHFT Testbed Experiments
We built a small DHFT network with 12 hosts in two racks. Each host connects to the two ToR switches in its rack, which are dual homed to two aggregation switches, giving four static-routed paths
between hosts in different racks. The switches are soft switches running Linux on PCs. ToR-to-core links are oversubscribed 3:2.
Our aim is to validate some of the simulations, and to see how well our Linux MPTCP implementation behaves with multiple paths. To compare with Fig. 15 we ran the permutation locality traffic matrix, varying the fraction of rack-local connections. A traffic pattern quite similar to this is generated by HDFS writes, where
2/3 of the traffic is rack-local. The throughput curve, shown in
Fig. 18, is close to the theoretical value; if 15% of traffic is lo-cal, DHFT equals the throughput of a perfect switch; with more local traffic, the improvements are bigger. Aggregate throughput levels off at 21Gb/s; although MPTCP could send more, the Linux soft-switches are saturated.
To validate MPTCP’s robustness to link failures we ran the ex-periment from Fig. 11, downgrading a core link’s speed from 1Gb/s to 100Mb/s. Single-path TCP cannot avoid this link as such a fail-ure will not trigger re-routing. We ran a zero-locality permutation matrix to maximally load the core. Fig. 19 shows a time series of flow throughputs. Approximately 4 minutes into the experiment, we downgrade one of the core switches’ links to 100Mb/s. MPTCP copes well: its congestion control fairly distributes the remaining core capacity between the flows. When the link returns to 1Gb/s, MPTCP flows increase to fill the capacity.
6.3
EC2
Amazon’s EC2 compute cloud allows us to run real-world ex-periments on a production data center. Amazon has several data centers; their older ones do not appear to be have redundant topolo-gies, but their latest data centers (us-east-1c and us-east-1d) use a topology that provides many parallel paths between many pairs of virtual machines.
We do not know the precise topology of the US East data cen-ter. Compared to our simulations, it is complicated slightly because each instance is a virtual machine, sharing the physical hardware with other users. Background traffic levels are also unknown to us, and may vary between experiments.
To understand the variability of the environment and the po-tential for MPTCP to improve performance, we ran our MPTCP-capable Linux kernel on forty EC2 instances, and for 12 hours sequentially measured throughput with iperf between each pair of hosts, using MPTCP with 2 and 4 subflows and TCP as transport protocols. The resultant dataset totals 3,000 measurements for each configuration, and samples across both time and topology.4
Fig. 20 shows the results ordered by throughput for each config-uration. Traceroute shows that a third of paths have no diversity; of
4We also ran the same experiment for 24h with ten machines;