A Modif ied Ant Colony Optimization Algorithm for Tumor Marker
Gene Selection
Hualong Yu*, Guochang Gu, Haibo Liu, Jing Shen, and Jing Zhao
College of Computer Science and Technology, Harbin Engineering University, Harbin 150001, China. *Corresponding author. E-mail: [email protected]
DOI: 10.1016/S1672-0229(08)60050-9
Microarray data are often extremely asymmetric in dimensionality, such as thou-sands or even tens of thouthou-sands of genes but only a few hundreds of samples or less. Such extreme asymmetry between the dimensionality of genes and samples can lead to inaccurate diagnosis of disease in clinic. Therefore, it has been shown that selecting a small set of marker genes can lead to improved classif ication accu-racy. In this paper, a simple modif ied ant colony optimization (ACO) algorithm is proposed to select tumor-related marker genes, and support vector machine (SVM) is used as classif ier to evaluate the performance of the extracted gene subset. Ex-perimental results on several benchmark tumor microarray datasets showed that the proposed approach produces better recognition with fewer marker genes than many other methods. It has been demonstrated that the modif ied ACO is a useful tool for selecting marker genes and mining high dimension data.
Key words: microarray data, ant colony optimization, marker gene selection, support vector machine
Introduction
The advent of DNA microarray technology has pro-vided the ability to measure the expression levels of thousands of genes simultaneously in a single experi-ment and made it possible to provide diagnosis for dis-ease, especially for tumor, at molecular level (1,2). However, classification based on microarray data is very different from previous classification problems in that the number of genes (typically tens of thousands) greatly exceeds the number of samples (typically a few hundreds or less), resulting in the known problem of “curse of dimensionality” and over-fitting of the train-ing data (3). It is thus important for successful dis-ease diagnosis to select a small number of discrimina-tive genes from thousands of genes (4). The benefits gained from gene selection in microarray data analy-sis are not only the better classification accuracy, but also the decrease of the cost in a clinical setting (5) and interpretability of genetic nature of the disease for biologists (6). Therefore, marker gene selection plays a crucial role in developing a successful disease diagnostic system based on microarray data.
In recent years, various marker gene selection methods have been proposed. Most of them have been proven helpful for improving predictive accuracy of disease and providing useful information for
biolo-gists and medical experts. All of these marker gene selection methods may be grouped into two teams: filter, which is also called gene ranking approach; and wrapper, which is also entitled as gene subset selec-tion approach (7). In filter approach, each gene is evaluated individually and assigned a score reflecting its correlation with the class according to certain cri-teria. Genes are then ranked by their scores and some top-ranked ones are selected. These filter approaches have been based on t-statistics (1),χ2-statistics (8), informative gain (9,10), signal-noise ratio (11), Pear-son correlation coefficient (12) and combination of several feature filtering algorithms (4,13). In the wrapper approach (14), a search is conducted in the space of genes, evaluating the goodness of each found gene subset by the estimation of the accuracy percent-age of the specific classifier to be used, training the classifier only with the found genes. Compared with the filter approach, the wrapper approach may obtain one gene subset with better classification performance but more computational cost. Some wrapper-based approaches have been provided and widely applied in bioinformatics, such as GA (15), PSO (16) and SFS (17). Although these approaches have obtained excellent performance in gene expression data
analy-sis, some congenital drawbacks still puzzle themselves such as excessive computational cost of GA and local optimum of PSO. Therefore, a simple modified ant colony optimization (ACO) algorithm is proposed in the present paper to search the optimum marker gene subset.
ACO algorithm is biologically inspired from the behavior of colonies of real ants, and in particular how they forage for food. Since the idea of ACO was proposed by Colorni et al in 1991 (17), it has been successfully applied to solve various discrete combi-natorial optimization problems, such as TSP (17), telecommunication networks (18), data mining (19) and protein folding (20). In this paper, we made some simple modifications based on conventional ACO al-gorithm to make it more suitable for marker gene sub-set search. Support vector machine (SVM) is selected as classifier or evaluator in our study. SVM has been found useful in handling classification tasks in the case of the high dimensionality and small-sample data (21). The proposed approach was applied in several well-known tumor microarray datasets and the experi-ment results showed excellent prediction performance.
Method
Modif ied ant colony optimization
algo-rithm for marker gene selection
The ACO algorithm developed by Colorni et al in 1991 (17) has been proven effective in many dis-crete combinatorial optimization problems (18–20). Since marker gene selection may be regarded as one of the discrete combinatorial optimization problems, we have reasons to believe that ACO will perform outstandingly in the aspect of marker gene subset se-lection.
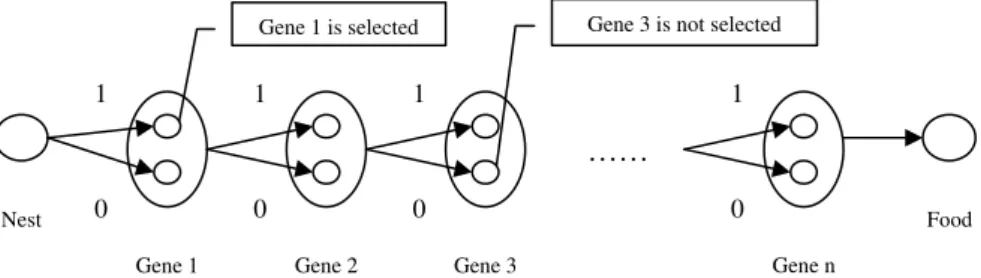
To apply ACO effectively to select subset of marker genes, a simple modified ACO algorithm is proposed. As indicated in Figure 1, the procedure
of marker gene selection may be regarded as the pro-cedure of foraging for food of ant. In the process of moving from nest to food, ant will pass each gene in candidate gene subset. From one gene to next gene, two pathways may be selected: pathway 1 represents that the next gene will be selected and pathway 0 denotes that the next gene will be filtered. At last, when ant arrives at the food, some genes are extracted and put into the marker gene subset, the others are filtered. A binary set{1, 0, 0, 1, 0, 1}means the 1st, 4th and 6th genes have been selected to construct the marker gene subset. Then the selected feature subset will be evaluated according to the fitness function; the higher fitness value is got, the better feature sub-set may be obtained. Ants cooperate with each other by intensity of pheromone left in every pathway for searching the optimum feature subset.
In our modified ACO algorithm, many ants syn-chronously search pathways from nest to the food. They select pathways according to the quantities of pheromone left in different pathways. The more pheromone is left, the higher probability of the corre-sponding pathway is selected. We compute the prob-ability of selecting a pathway as below:
pij =τkij
jτij
(1) whereirepresents theith gene,j may be assigned as 1 or 0 to denote whether the corresponding gene has been selected or not, whileτij is pheromone intensity of the ith gene in the jth pathway, k is the possible value of pathwayj (0 or 1), and pij is the probabil-ity of the ith gene selecting the jth pathway. When an ant arrives at the food, the corresponding feature subset will be evaluated by fitness function as below:
f itness= Acc
1 +λn (2)
where Acc is the predictive accuracy of the feature subset,nis the number of marker genes in the feature
Nest
Gene 1 Gene 2 Gene 3 Gene n
Food ……
Gene 3 is not selected Gene 1 is selected
1 1 1 1
0 0 0 0
Figure 1The feature selection procedure of modified ACO algorithm. 1 represents that the corresponding gene will be selected, 0 represents that the corresponding gene will not be selected.
subset, andλis the weight denoting the importance of the number of marker genes. When one iteration is finished, the pheromone in all of the pathways will be updated. The update formula is described as below:
τij(t+ 1) = (1−ρ)τij(t) + Δτij (3) where ρ is the evaporation of pheromone trails, and Δτij is the incremental pheromone of several excel-lent pathways. In this paper, we add pheromone in the pathways of the best 10% ants after each cycle and store these pathways in a setS. Δτij is defined as below:
Δτij =
fitnessa,pathwayij ∈S
0,pathwayij∈/ S (4)
In formula 4, parameter a controls the quantity of increased pheromone. When one cycle is finished, the pheromone of some pathways will be intensified and the others will be weakened, so that those excel-lent pathways will have more chances to be selected in next cycle. With the convergence of ACO algorithm, all of the ants are inclined to select the same pathway. At last, the best solution will be returned.
Considering that the modified ACO algorithm is inclined to sink into local optimization, we also profit from the idea of St¨utzle and Hoos (22) to set the up-per and lower boundary of pheromone in each path-way and to name the improved ACO algorithm as MMACO (Max-Min ant colony optimization), which may be easier to maintain the trade-off between in-tensification and diversification.
Support vector machine
SVM introduced by Vapnik (23) is a valuable tool for solving pattern recognition and classification prob-lem. Compared with traditional classification meth-ods, SVM possesses prominent advantages such as high generalization capability, absence of local min-ima, and suitability for small-sample dataset. Given a dataset S = {(xi, yi)|xi ∈ Rd, y
i ∈ {−1,+1}, i =
1, ...N}, where xi is ad-dimension sample, yi is the corresponding class label, and N is the number of samples, the discriminant function of SVM can be de-scribed as below: g(x) = sgn sv i=1 αiyiK(x, xi) +b (5) In formula 5,sv is the number of support vectors,
αi is lagrange multiplier, b is the bias of optimum
classification hyperplane, whileK(x, xi) denotes the kernel function. In this paper, we have finished our experiments with radial basis function (RBF):
K(xi, xj) = exp{−|
xi−xj|2
2σ2 } (6)
A complete description of SVM theory for pattern recognition is given by Vapnik in reference (23).
Marker gene selection algorithm based
on modif ied ACO and SVM
In this study, we combine modified ACO and SVM as a novel wrapper marker gene selection approach to extract the marker gene subset as described below:
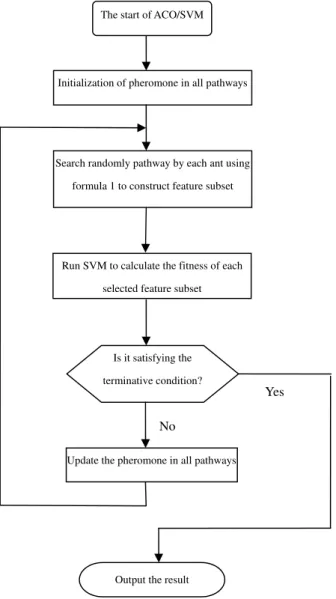
Step 1. Initialize pheromone of all pathways. Step 2. Each ant randomly searches a pathway from nest to food using formula 1 to construct some feature subsets.
Step 3. Calculate the fitness of every feature sub-set obtained in step 2 by SVM. The best one will be compared with the optimum solution obtained in the previous searches. If the new solution is better, the optimum solution will be updated.
Step 4. If the terminative condition is satisfied, the best result will be returned, otherwise the pheromone of all pathways will be updated, then go back to step 2 and continue to run.
An intuitionistic flow chart of marker gene selec-tion algorithm based on ACO and SVM is presented inFigure 2.
Evaluation
Dataset and experimental settings
We firstly used the colon tumor dataset as an exam-ple to evaluate performance of the proposed approach in detail. The colon dataset contains 62 samples col-lected from colon cancer patients. Among them, 40 tumor biopsies are from tumors (labelled as “nega-tive”) and 22 normal biopsies (labelled as “posi“nega-tive”) are from healthy parts of the colons of the same pa-tients. Two thousand out of around 6,500 genes were selected based on the confidence in the measured expression levels. The raw data are publicly avail-able at http://sdmc.lit.org.sg/GEDatasets/Datasets and more information can be found in Alonet al (2). All of the algorithms (including the modified ACO algorithm and MMACO algorithm proposed in thisThe start of ACO/SVM
Initialization of pheromone in all pathways
Search randomly pathway by each ant using formula 1 to construct feature subset
Run SVM to calculate the fitness of each selected feature subset
Is it satisfying the terminative condition?
Update the pheromone in all pathways No
Yes
Output the result
Figure 2 The flow chart of marker gene selection algo-rithm based on modified ACO and SVM.
paper and GA algorithm used for performance com-parison) in the experiments were written in MATLAB 7.0 (MathWorks Inc., Natick, USA), and S. Gunn’s SVM toolbox (http://www.isis.ecs.soton.ac.uk/reso-urces/svminfo/) was used to implement SVM algo-rithm. We ran the algorithm on a personal computer (Intel Pentium D processor/dual core 2.66GHz/512M RAM). Experimental initial parameters are given in
Table 1.
Additionally, in this study we conducted leave-one-out cross-validation (LOOCV) for comparing with the other people’s work. In LOOCV, one of all samples is evaluated as testing data while the others are used as training data. After each sample is used as testing data for once, the predictive accuracy will be got by the ratio between the number of the correctly classified samples and the number of total samples in the dataset.
Experimental results
Firstly, in order to alleviate the burden of computa-tion and accelerate the speed of convergence, 100 top-ranked informative genes were selected by signal-noise ratio estimation approach (1). Then the modified ACO/SVM algorithm was applied to search a more excellent marker gene subset on these 100 genes. The LOOCV classification accuracy of the 100 top-ranked informative genes on colon tumor dataset was tested and a recognition rate of 87.1% was got.
Then we compared the modified ACO algorithm and MMACO algorithm proposed in this paper with the most popular wrapper marker gene selection Table 1 Parameters used for experiments
Common parameters for ACO Value
ant n population size 50
N C the number of iterations 50 a the weight factor of updating pheromone 5 dispose evaporation of pheromone trails 0.2 λ the weight factor of the number of marker genes 0.005 ph(i,0) the initial pheromone of pathway 0 1.0 ph(i,1) the initial pheromone of pathway 1 1.0 Common parameters for MMACO
phmin the lower boundary of pheromone 0.3
phmax the upper boundary of pheromone 1.5
Common parameters for SVM
σ the parameter of RBF kernel function 5 C the penalty factor 500
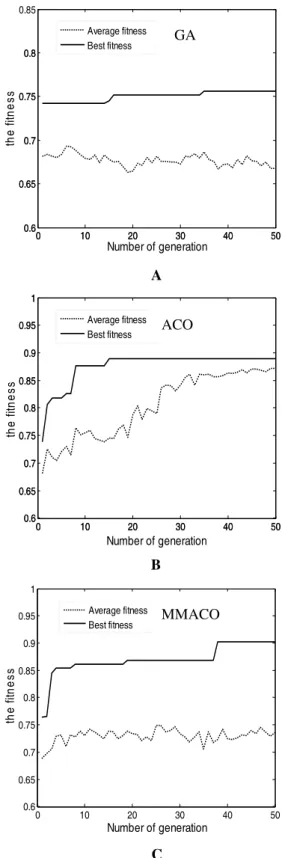
algorithm—GA algorithm, combined with SVM clas-sifier. The parameters of GA followed Peng et al (24): crossover operator is 1.0 and mutation operator is 0.006, while the other parameters referred to Table 1. The variational curves of GA, ACO and MMACO are described inFigure 3.
Figure 3 indicates that the convergence speed of GA is slower compared with ACO and MMACO. Un-til the 43rd cycle, it can only find a not excellent enough solution (classification accuracy: 88.7%, num-ber of marker genes: 39). The reason may be that cross and mutation operation slow down the con-vergence speed of GA. In contrast, ACO algorithm proposed in this paper may rapidly converge to a relatively excellent solution (classification accuracy: 90.3%, number of marker genes: 37) in the 15th cy-cle. Unfortunately, the marker gene subset obtained by ACO is only a local optimum solution due to rapid increase of pheromone in some pathways. It is not difficult to find that average fitness maintains an in-creased trend despite there are some fluctuations in Figure 3B. MMACO seems to effectively settle this problem by maintaining the trade-off between inten-sification and diverinten-sification. Figure 3C indicates that new better solutions can be found constantly by MMACO until the 28th cycle (classification accuracy: 91.9%, number of marker genes: 30), while the aver-age fitness has no obvious increase or decrease, which means that MMACO is better than modified ACO.
To further reduce the number of marker genes and improve the classification accuracy, we assigned different initial pheromone for pathway 0 and 1 in ACO and MMACO (1.0 for pathway 0 and 0.5 for pathway 1) and different probability for initial binary characters in GA (the probability of 0 is as twice as that of 1). The experimental results are shown in
Figure 4. From Figure 4, it is not difficult to gain a fact that the performance of all of the three algo-rithms have obvious promotion: GA converged in the 35th cycle with 90.3% classification accuracy and 35 marker genes; ACO converged in the 15th cycle with 90.3% classification accuracy but only 3 marker genes; while MMACO converged in the 38th cycle but ac-quired the best classification accuracy 95.2% with 11 informative genes. When we compared the marker genes obtained in two groups of experiments, we found that most marker genes in the second group of ex-periments have also appeared in the first one. That means many redundant genes, which existed in the first group of experiments, have been filtered in the latter one.
To evaluate the stability of the algorithms pro-posed in this paper, we randomly ran GA, ACO and MMACO based on the parameters in the second group of experiments for 30 times, respectively. Ex-perimental results show that the stability of MMACO is the best in all of the three algorithms. For MMACO, classification accuracy of 95.2% appeared 27 times and accuracy of 93.5% occurred 3 times. While in 30 runs of ACO, the highest classification accuracy was 93.5% (11 times), the lowest was 88.7% (2 times), accuracy of 90.3% and 91.9% appeared 14 times and 3 times, respectively. The stability of GA is better than ACO but worse than MMACO: pre-dictive accuracy of 90.3%, 88.7% and 91.9% occurred 22 times, 5 times and 3 times, respectively. However, ACO has averagely extracted less marker genes than GA and MMACO (7.5: 28.4: 10.8).
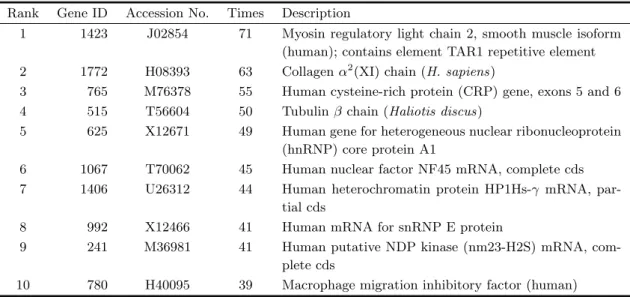
In 90 random runs above, the times of each gene appearing in marker gene subset were counted and the emergence times of Gene 1423 [J02854: Myosin regu-latory light chain 2, smooth muscle isoform (human); contains element TAR1 repetitive element] was most (71 times). Gene 1772 [H08393: Collagen α2 (XI) chain (human)], which has been found closely related with colon tumor by other researchers (6,25), occu-pied the second place (63 times). Besides these genes, genes 765, 515, 625, 1067, 1406, 992, 241 and 780 also have been found being correlated with colon tumor in this paper. The detailed information and description of top 10 marker genes are listed in Table 2. We expect these findings may provide useful information for biologists and medical experts.
Furthermore, to verify the applicability and gener-ality of the proposed methods, we have conducted ad-ditional experiments on other four popular tumor mi-croarray datasets, including two binary-class datasets and two multi-class datasets (1, 26–28) as shown in
Table 3in detail (parameters referred to the second group of experiments). As to multi-class datasets, one-versus-rest support vector machine (OVR-SVM) was used to classify for samples. At first, top 100 genes were extracted, and then the average clas-sification accuracy and size of selected marker genes of 30 independent running for the proposed methods were compared with several other marker gene selec-tion and classificaselec-tion methods (24,29–32) as listed inTable 4.
From Table 4, it can be seen that our proposed ACO/SVM and MMACO/SVM algorithms may select a smaller feature subset with better LOOCV classification accuracy than many other methods in
0WODGTQHIGPGTCVKQP VJ G HKVP G UU #XGTCIGHKVPGUU $GUVHKVPGUU 0WODGTQHIGPGTCVKQP VJ G HKVP G UU #XGTCIGHKVPGUU $GUVHKVPGUU GA GA A A 0WODGTQHIGPGTCVKQP VJ G HKVP G UU #XGTCIGHKVPGUU $GUVHKVPGUU VJ G HKV PGU U 0WODGTQHIGPGTCVKQP #XGTCIGHKVPGUU $GUVHKVPGUU ACO ACO B B 0WODGTQH IGPGTCVKQP VJG HKV PGUU #XGTCIGHKVPGUU $GUVHKVPGUU 0WODGTQHIGPGTCVKQP VJ G HKVP G UU #XGTCIGHKVPGUU $GUVHKVPGUU MMACO MMACO C C
Figure 3Variational curves of fitness for GA (A), ACO (B) and MMACO (C).
Figure 4 Variational curves of fitness for GA (A), ACO (B) and MMACO (C) based on different initial pheromone for pathway 0 and 1 in ACO and MMACO (1.0 for pathway 0 and 0.5 for pathway 1) and different probability for initial binary characters in GA (the prob-ability of 0 is as twice as that of 1).
Table 2 Detailed description of top 10 marker genes extracted by GA, ACO and MMACO Rank Gene ID Accession No. Times Description
1 1423 J02854 71 Myosin regulatory light chain 2, smooth muscle isoform (human); contains element TAR1 repetitive element 2 1772 H08393 63 Collagenα2(XI) chain (H. sapiens)
3 765 M76378 55 Human cysteine-rich protein (CRP) gene, exons 5 and 6 4 515 T56604 50 Tubulinβ chain (Haliotis discus)
5 625 X12671 49 Human gene for heterogeneous nuclear ribonucleoprotein (hnRNP) core protein A1
6 1067 T70062 45 Human nuclear factor NF45 mRNA, complete cds 7 1406 U26312 44 Human heterochromatin protein HP1Hs-γ mRNA,
par-tial cds
8 992 X12466 41 Human mRNA for snRNP E protein
9 241 M36981 41 Human putative NDP kinase (nm23-H2S) mRNA, com-plete cds
10 780 H40095 39 Macrophage migration inhibitory factor (human) Table 3 Other benchmark tumor microarray datasets
Dataset Quantity Reference Genes Samples Classes
Leukemia 7,129 72 2 Golubet al (1) DLBCL 4,026 47 2 Alizadehet al (26) NCI60 5,726 60 9 Stuantonet al (27) Brain 5,920 90 5 Pomeroyet al (28)
Table 4 Related works on f ive datasets
Method LOOCV predictive accuracy (Size of selected marker genes)
Colon Leukemia DLBCL NCI60 Brain
ACO/SVM 91.5%±1.5% (7.5) 100% (8.6) 100% (7.2) 82.4%±1.9% (8.8) 90.7%±1.9% (7.9) MMACO/SVM 95.0%±0.3% (10.8) 100% (6.3) 100% (5.7) 84.2%±1.8% (12.6) 91.0%±1.4% (8.1) SNR (top-ranked 100)/SVM 87.1% (100) 97.2% (100) 95.7% (100) 71.7% (100) 84.4% (100) GA/SVM (24) 90.2%±0.5% (28.4) 100% (17.6) 100% (15.4) 80.7%±2.2% (23.6) 88.9%±1.6% (25.1) SVM (29) 90.3% (2,000) 94.1% (500) – – – Bagboost (30) 83.9% (200) 95.9% (200) 98.4% (200) – 76.1% (200) SWKC (31) 88.4% (15.0) 98.2% (14.2) 99.3% (14.1) 75.2% (32.5) 81.9% (41.5) OVR-SVM (32) – – – 65.2% (5,726) 91.7% (5,920)
almost all datasets. Therefore, our proposed algo-rithms are more effective for marker gene subset se-lection and pattern classification.
Conclusion
Marker gene selection plays a crucial role in develop-ing a successful disease diagnostic system based on mi-croarray data. In the present work, a simple modified ACO algorithm is proposed and combined with SVM for mining tumor-related marker genes. The experi-mental results running on several benchmark tumor microarray datasets have demonstrated that the
pro-posed approach may extract better marker gene sub-set than many other methods and the modified ACO algorithm is a useful tool for selecting marker genes.
Acknowledgements
This work was partially supported by National Natural Science Foundation of China (Grant No. 60873036), China Postdoctoral Science Foundation (Grant No. 20060400809) and Science and Technol-ogy Special Foundation for Young Researchers of Hei-longjiang Province of China (Grant No. QC06C022).
Authors’ contributions
HY designed and implemented the algorithm, con-ducted experiments and drafted the manuscript. GG and HL conceived the idea of using this approach and assisted with manuscript preparation. JS and JZ col-lected the dataset and conducted data analysis. All authors read and approved the final manuscript.
Competing interests
The authors have declared that no competing inter-ests exist.
References
1. Golub, T.R., et al. 1999. Molecular classification of cancer: class discovery and class prediction by gene expression monitoring. Science 286: 531-537.
2. Alon, U., et al. 1999. Broad patterns of gene ex-pression revealed by clustering analysis of tumor and normal colon tissues probed by oligonucleotide arrays.
Proc. Natl. Acad. Sci. USA96: 6745-6750.
3. Dougherty, E.R. 2001. Small sample issues for microarray-based classification. Comp. Funct. Ge-nomics 2: 28-34.
4. Xing, E.P., et al. 2001. Feature selection for high-dimensional genomic microarray data. In Proceed-ings of the 18th International Conference on Machine Learning, pp. 601-608. Morgan Kaufmann Publishers Inc., San Francisco, USA.
5. Roth, F.P. 2001. Bringing out the best features of expression data. Genome Res. 11: 1801-1802. 6. Guyon, I., et al. 2002. Gene selection for cancer
classification using support vector machines. Mach. Learn. 46: 389-422.
7. Inza, I., et al. 2004. Filter versus wrapper gene selec-tion approaches in DNA microarray domains. Artif. Intell. Med. 31: 91-103.
8. Liu, H.,et al. 2002. A comparative study on feature selection and classification methods using gene expres-sion profiles and proteomic patterns. Genome Inform.
13: 51-60.
9. Su, Y., et al.2003. RankGene: identification of diag-nostic genes based on expression data. Bioinformatics
19: 1578-1579.
10. Li, T.,et al. 2004. A comparative study of feature se-lection and multiclass classification methods for tissue classification based on gene expression. Bioinformat-ics 20: 2429-2437.
11. Shipp, M.A., et al. 2002. Diffuse large B-cell lymphoma outcome prediction by gene-expression
profiling and supervised machine learning. Nat. Med.
8: 68-74.
12. Cho, S.B. and Won, H.H. 2003. Machine learning in DNA microarray analysis for cancer classification. InProceeding of the First Asia-Pacific Bioinformatics Conference, pp. 189-198. Adelaide, Australia. 13. Wang, Y., et al. 2005. HykGene: a hybrid approach
for selecting marker genes for phenotype classification using microarray gene expression data. Bioinformat-ics 21: 1530-1537.
14. Kohavi, R. and John, G.H. 1997. Wrappers for feature subset selection. Artif. Intell. 97: 273-324.
15. Shah, S. and Kusiak, A. 2007. Cancer gene search with data-mining and genetic algorithms. Comput. Biol. Med. 37: 251-261.
16. Shen, Q.,et al. 2007. A combination of modified par-ticle swarm optimization algorithm and support vector machine for gene selection and tumor classification.
Talanta71: 1679-1683.
17. Colorni, A., et al. 1992. Distributed optimization by ant colonies. InToward a Practice of Autonomous Sys-tems: Proceedings of the First European Conference on Artificial Life(eds. Verela, F.J. and Bourgine, P.), pp. 134-142. MIT Press, Cambridge, USA.
18. Caro, G.D. and Dorigo, M. 1998. AntNet: distributed stigmergetic control for communications networks. J. Artif. Intell. Res. 9: 317-365.
19. Parpinelli, R.S.,et al. 2002. Data mining with an ant colony optimization algorithm. IEEE Trans. Evol. Comput. 6: 321-332.
20. Shmygelska, A. and Hoos, H.H. 2005. An ant colony optimization algorithm for the 2D and 3D hydrophobic polar protein folding problem. BMC Bioinformatics6: 30.
21. Wang, J., et al. 2007. Prediction of surface tension for common compounds based on novel methods using heuristic method and support vector machine. Talanta
73: 147-156.
22. St¨utzle, T. and Hoos, H.H. 2000. MAX-MIN ant sys-tem. Future Generation Comput. Syst. 16: 889-914. 23. Vapnik, V.N. 1998. Statistical Learning Theory. John
Wiley & Sons, Inc., New York, USA.
24. Peng, S., et al. 2003. Molecular classification of can-cer types from microarray data using the combination of genetic algorithms and support vector machines.
FEBS Lett. 555: 358-362.
25. Li, X.,et al. 2004. Gene mining: a novel and power-ful ensemble decision approach to hunting for disease genes using microarray expression profiling. Nucleic Acids Res. 32: 2685-2694.
26. Alizadeh, A.A., et al. 2000. Distinct types of diffuse large B-cell lymphoma identified by gene expression profiling. Nature 403: 503-511.
27. Staunton, J.E., et al. 2001. Chemosensitivity predic-tion by transcrippredic-tional profiling. Proc. Natl. Acad.
Sci. USA98: 10787-10792.
28. Pomeroy, S.L.,et al. 2002. Prediction of central ner-vous system embryonal tumour outcome based on gene expression. Nature 415: 436-442.
29. Furey, T.S.,et al. 2000. Support vector machine clas-sification and validation of cancer tissue samples using microarray expression data. Bioinformatics 16: 906-914.
30. Dettling, M. 2004. BagBoosting for tumor clas-sification with gene expression data. Bioinformatics
20: 3583-3593.
31. Shim, J.,et al. 2009. Selecting marker genes for cancer classification using supervised weighted kernel cluster-ing and the support vector machine. Comput. Stat. Data Anal. 53: 1736-1742.
32. Statnikov, A., et al. 2005. A comprehensive eval-uation of multicategory classification methods for microarray gene expression cancer diagnosis. Bioin-formatics 21: 631-643.