Title
New Candidate Drugs or Targets by Ensemble Learning to
Rank.
Author(s)
Yuan, Qingjun; Gao, Junning; Wu, Dongliang; Zhang, Shihua;
Mamitsuka, Hiroshi; Zhu, Shanfeng
Citation
Bioinformatics (2016), 32(12): i18-i27
Issue Date
2016-06-11
URL
http://hdl.handle.net/2433/218455
Right
© The Author 2016. Published by Oxford University Press;
This is an Open Access article distributed under the terms of
the Creative Commons Attribution Non-Commercial License (
http://creativecommons.org/licenses/by-nc/4.0/ ), which
permits non-commercial re-use, distribution, and reproduction
in any medium, provided the original work is properly cited.
For commercial re-use, please contact
[email protected]
Type
Journal Article
Textversion
publisher
DrugE-Rank: improving drug–target interaction
prediction of new candidate drugs or targets by
ensemble learning to rank
Qingjun Yuan
1,2, Junning Gao
1,2, Dongliang Wu
1,2, Shihua Zhang
3,
Hiroshi Mamitsuka
4,5and Shanfeng Zhu
1,2,6,*
1
School of Computer Science, Fudan University, Shanghai, China,
2Shanghai Key Lab of Intelligent Information
Processing, Fudan University, Shanghai, China,
3National Center for Mathematics and Interdisciplinary Sciences,
Academy of Mathematics and Systems Science, Chinese Academy of Sciences, Beijing, China,
4Bioinformatics
Center, Institute for Chemical Research, Kyoto University, Uji, Japan and
5Department of Computer Science, Aalto
University, Finland and
6Centre for Computational System Biology, Fudan University, Shanghai, China
*To whom correspondence should be addressed
Abstract
Motivation:
Identifying drug–target interactions is an important task in drug discovery. To reduce
heavy time and financial cost in experimental way, many computational approaches have been
proposed. Although these approaches have used many different principles, their performance is
far from satisfactory, especially in predicting drug–target interactions of new candidate drugs or
targets.
Methods:
Approaches based on machine learning for this problem can be divided into two types:
feature-based and similarity-based methods. Learning to rank is the most powerful technique in
the feature-based methods. Similarity-based methods are well accepted, due to their idea of
con-necting the chemical and genomic spaces, represented by drug and target similarities,
respect-ively. We propose a new method, DrugE-Rank, to improve the prediction performance by nicely
combining the advantages of the two different types of methods. That is, DrugE-Rank uses LTR, for
which multiple well-known similarity-based methods can be used as components of ensemble
learning.
Results:
The performance of DrugE-Rank is thoroughly examined by three main experiments using
data from DrugBank: (i) cross-validation on FDA (US Food and Drug Administration) approved
drugs before March 2014; (ii) independent test on FDA approved drugs after March 2014; and (iii)
independent test on FDA experimental drugs. Experimental results show that DrugE-Rank
outper-forms competing methods significantly, especially achieving more than 30% improvement in Area
under Prediction Recall curve for FDA approved new drugs and FDA experimental drugs.
Availability:
http://datamining-iip.fudan.edu.cn/service/DrugE-Rank
Contact:
[email protected]
Supplementary information:
Supplementary data
are available at
Bioinformatics
online.
1 Introduction
The identification of drug–target interactions is a crucial process in drug discovery, which can facilitate the understanding of drug ac-tion mechanism, disease pathology and drug side effect (Keiser
et al., 2009;Lounkineet al., 2012;Nunezet al., 2012). Using bio-chemical experiments to identify these interactions is a reliable, yet expensive and time-consuming approach. In fact, the cost of
developing a new FDA approved drug has doubled every 9 years since 1950, with only around 20 drugs approved by FDA per year (Scannellet al., 2012). Furthermore, there exist a huge number of unexplored compounds and human proteins, which makes it impos-sible to examine their interactions effectively by experimental approaches. For instance, there are over 35 million chemical com-pounds in PubChem database, and only less than 7000 have protein
VCThe Author 2016. Published by Oxford University Press. i18
This is an Open Access article distributed under the terms of the Creative Commons Attribution Non-Commercial License (http://creativecommons.org/licenses/by-nc/4.0/), which permits non-commercial re-use, distribution, and reproduction in any medium, provided the original work is properly cited. For commercial re-use, please contact [email protected]
Bioinformatics, 32, 2016, i18–i27 doi: 10.1093/bioinformatics/btw244 ISMB 2016
target information (Boltonet al., 2008). On the other hand, more than 140 000 human proteins are recorded in UniProtKB database (Boutetet al., 2007). It is estimated that the number of possible tar-gets is between 6000 and 8000 (Overingtonet al., 2006), whereas only around 1300 known drugs are in DrugBank (Lawet al., 2014). To reduce the huge time and financial cost of experimental approaches, many computational approaches have been proposed to select a small number of most promising candidate drug–target interactions for further experimental validation (Dinget al., 2014;
Mousavian and Masoudi-Nejad, 2014;Yamanishi, 2013).
Traditional computational approaches for identifying drug–tar-get interactions usually focus on a particular tardrug–tar-get of interest. These approaches can be divided into two categories, target-based meth-ods (Lyne, 2002) and ligand-based methods (Acharyaet al., 2011). The target-based methods rely on known 3D structure of targets and use docking techniques to simulate the interactions between targets and candidate drugs. However, the 3D structures of many important targets, especially G-protein coupled receptors and ion channels, are unavailable. On the other hand, ligand-based methods rely on the known interacting ligands of target proteins to define a pharmaco-phore model that describe the common characteristic of binding lig-ands. In this case, if the number of known binding ligands is very small, ligand-based methods cannot work well.
To overcome the limitation of traditional approaches and also realize large-scale prediction, machine learning has attracted lots of attention (Dinget al., 2014;Mousavian and Masoudi-Nejad, 2014;
Yamanishi, 2013). This approach can use not only known drug–tar-get interactions, but also various types of information on drug and targets, implementing the idea of integrating the chemical space of drugs and genomic space of targets. The methods of this approach can be roughly divided into two groups: feature-based methods (Nagamine and Sakakibara, 2007; Yabuuchi et al., 2011; Tabei
et al., 2012) and similarity-based methods (Dinget al., 2014). In feature-based methods, drugs and targets are represented by feature vectors, which are derived from their properties, such as drug fingerprints and the sequence descriptors of targets. Currently, the most high performance approach in this direction uses ‘Learning To Rank (LTR)’ (Agarwalet al., 2010;Rathkeet al., 2010;Zhang
et al., 2015), a rather new paradigm in machine learning. In prin-ciple, LTR is very powerful. For example, in binary classification, positive examples ranked lower and negative examples ranked higher are more penalized, while examples are rather treated equally in any classification method (Li, 2011). LTR has been originally de-veloped in information retrieval for ranking web pages, according to multiple users’ queries, meaning that LTR is considered for ‘multilabel classification’, in which each instance is labeled by mul-tiple labels (Liu, 2009). Identifying drug–target interactions can also be multilabel classification, in the sense that drugs can be interacted (labeled) by multiple targets. In fact, statistics from DrugBank (be-fore March 2014) shows 4.58 interacting targets on average for each FDA approved small molecule drug, and 4.5 interacting FDA approved small molecule drugs on average for each target protein. So each drug (target) is labeled around 4.5 times on average, and LTR is perfectly fitted to drug–target interaction prediction.
In similarity-based methods, different types of similarity among drugs (e.g. chemical structure similarity) and among targets (e.g. protein sequence similarity) can be used to learn models to predict the interaction between drug and targets. A common assumption of these methods is that similar drugs will interact with similar targets and vice versa. A distinct advantage of similarity-based methods is that this assumption can be explicitly incorporated into the predic-tion model for identifying novel drug–target interacpredic-tions. Following
the pioneering work of (Yamanishiet al., 2008), a lot of similarity-based methods have been developed by using different techniques, such as kernel learning (Bleakley and Yamanishi, 2009;Jacob and Vert, 2008; Mei et al., 2013; van Laarhoven et al., 2011; van Laarhoven and Marchiori, 2013), matrix factorization (Go¨nen, 2012; Zheng et al., 2013), regularized least squares (Xia et al., 2010) and multilabelk-nearest neighbor (Shi et al., 2015). These methods are thought to be reasonable and valid, because the drug and target similarities generate the chemical space of drugs and gen-omic space of targets, respectively, and the methods try to under-stand the connection between the two spaces. This point leads to the high-performance of similarity-based methods.
We address the problem of predicting drug–target interactions for new drugs or new targets, which is especially challenging (Ding
et al., 2014), due to three main reasons. First, new drugs or targets do not have known interactions, which makes the training of predic-tion models difficult. Second, the connecpredic-tions among different drugs or targets are not well considered in the existing computational models. Third, given a new drug (or target), there are many possible interacting targets (or drugs). Until December 2015, there are at least approximately 1200 FDA approved small molecule drugs and also at least 1300 target human proteins in DrugBank (Lawet al., 2014). To this end, we propose a new method, DrugE-Rank, to take the most advantage of both the feature-based and similarity-based machine learning methods. First, DrugE-Rank uses LTR, which provides currently the most powerful performance and is totally suitable for this problem. Second, in the framework of LTR, DrugE-Rank performs an ensemble learning, that is integrating the predic-tion by diverse cutting-edge techniques. It has adopted different prediction methods as well as regular inputs (i.e. features of drug and targets). Third, in the ensemble framework, LTR has only the top promising drugs (or targets) suggested by each component meth-ods as the input, instead of considering all possible chemical com-pounds. This manner avoids using irrelevant chemical compounds and eventually reduces computational burden heavily.
We examined the performance of DrugE-Rank by using manu-ally annotated drug–target interactions in DrugBank (Law et al., 2014). We generated three different datasets from DrugBank: (i) FDA approved drugs appeared in DrugBank before March 2014; (ii) new targets and FDA approved targets appeared in DrugBAnk after March 2014; and (iii) FDA experimental drugs. We first com-pared the performance of DrugE-Rank with competing methods by cross-validation on the first dataset. Experimental results on this cross-validation show that DrugE-Rank outperformed all competing methods, being statistically significant. The improvement when hav-ing new drug was especially promishav-ing, where DrugE-Rank achieved an Area under Prediction Recall curve (AUPR) of 0.4917, 27.3% higher than that by the best component method (an AUPR of 0.3864). The performance of DrugE-Rank was further validated by two different independent tests using the second and third datasets. For example, for the new FDA approved drugs appearing in DrugBank after March 2014, DrugE-Rank achieved an AUPR of 0.2031, 60.8% improvement against that by the best component method (an AUPR of 0.1263). Also we analyzed top predicted drugs and targets from a variety of viewpoints, giving several insights on the data of drug–target interactions.
2 Related work
Feature-based learning is a general framework of machine learning, especially classification, for which various approaches have been
proposed and successfully used in a wide variety of applications. LTR is a rather new paradigm in machine learning, which is moti-vated by information retrieval, where with respect to users’ queries, more relevant web pages should be ranked higher (Li, 2011). LTR is powerful for binary classification in the sense that lower ranked positive examples and higher ranked negatives are penalized more, while general classification methods treat all examples equally. Already a variety of methods for LTR have been proposed. One of such method is LambdaMART (Burges, 2010), which has been used in many applications (Liuet al., 2015b). Currently, LTR has proven to be a powerful approach not only in information retrieval, but also in many other applications, even in computational biology, such as protein remote homology detection (Liuet al., 2015a), pep-tide identification from proteomics data (Qeliet al., 2014) and bio-medical semantic indexing (Liuet al., 2015b). In particular, recently LTR has been applied to ligand-based virtual screening (Agarwal
et al., 2010;Rathkeet al., 2010; Zhanget al., 2015). Initially, a pair-wise LTR method, SVMRank, was rather straightforwardly applied to rank chemical structures for drug discovery, showing higher performance than support vector regression (SVR) (Agarwal
et al., 2010). Then this method with SVMRank was outperformed by StructRank (Rathkeet al., 2010). Also in a more application-oriented manner, six already available software/algorithms of LTR were compared for ligand-based virtual screening (Zhang et al., 2015). In this line of work, we emphasize that our proposed method, DrugE-Rank, has several unique points, to outperform the existing work: (i) DrugE-Rank can use ensemble learning or information from multiple component methods, for which cutting-edge similar-ity-based machine learning methods can be used. In addition, in training, we filter candidate drugs (or targets) by using component methods, and this step works well to remove irrelevant drugs (false positives) and as a result reduce the entire computational cost. (ii) The focus of DrugE-Rank is on predicting new drugs (or new tar-gets), while the existing work are for ligand-based virtual screening (to rank the candidate chemical compounds), where the target is not necessarily new. (iii) DrugE-Rank uses all known drug–target inter-actions in DrugBank, meaning that this work is a thorough study, while the data used in existing work are interactions of a single tar-get or a small number of tartar-gets only.
One uniqueness of the problem of predicting drug–target inter-actions is that given data are not only interinter-actions between drugs and targets, but also similarities between drugs (and those of tar-gets), which can be thought to represent the chemical and genomic spaces, respectively. This is a well-advocated paradigm in chemoge-nomics. Thus, similarity-based approaches are well accepted by pharmacologists and relevant methods have been widely proposed, achieving high predictive performance (Dinget al., 2014). DrugE-Rank uses cutting-edge similarity-based methods as components of ensemble learning. See Section 3.3 for their schemes which are ex-plained as component methods of DrugE-Rank.
3 Methods: DrugE-Rank
3.1
Notations
We useD¼ fdignd
i¼1to represent drug set, andT¼ ftjg
nt
j¼1for target
set.Yis the drug–target interaction matrix, whereYij ¼1 if there is
interaction betweendiandtj, otherwiseYij ¼0. Letydibe a binary vector, calledinteraction profileof drugdi, where thej-th element of
ydiis 1 if drugdiinteracts with targettj; otherwise 0. Similarly letytj be a binary vector, called interaction profile of targettj.Stis the
gen-omic similarity matrix of targets, andstðti;tjÞis genomic similarity
betweentiandtjinSt;Sdis the chemical similarity matrix of drugs,
andsdðdi;djÞis the genomic similarity betweendianddjinSd;xtis the feature vector of targett, andXTis the feature matrix ofT.xdis the feature vector of drugd, andXDis the feature matrix ofD.
3.2
Overview
The framework of DrugE-Rank is to predict drugs (or targets) given a new target (or a new drug). For simplicity, in this section, we ex-plain our method by the case that a new target is given (and then ranking drugs). We note that the reverse case can be easily explained by replacing drugs and targets with targets and drugs, respectively. Given a new target, each target can be viewed as an instance, and all drugs can be viewed as labels. That is, given a new targett2T, identifying relevant drugs is to predict the labels of instancet, which can be considered as a multilabel classification, since not only one label (drug) but also multiple labels (drugs) are considered. To solve this problem, DrugE-Rank uses LTR, which is originally developed in information retrieval for ranking web pages with respect to user’ query. That is, in information retrieval,tandDcan be a query and a set of web pages, respectively, and predicting drugs interacting with tcan be solved by ranking drugs inDby LTR.
The procedure of DrugE-Rank has four steps. Before explaining the detail of the four steps, we will briefly explain the six component methods of DrugE-Rank.
3.3 Component methods
We select six well-known, cutting-edge similarity-based methods as component methods: k-nearest neighbor (k-NN), Bipartite Local Model with support vector classification (BLM-svc) (Bleakley and Yamanishi, 2009), Bipartite Local Model with support vector re-gression (BLM-svr) (Bleakley and Yamanishi, 2009), Laplacian regularized least squares (LapRLS) (Xia et al., 2010), Network-based Laplacian regularized least squares (NetLapRLS) (Xiaet al., 2010), Weighted Nearest Neighbor-based Gaussian Interaction Profile classifier (WNN-GIP) (van Laarhoven et al., 2011; van Laarhoven and Marchiori, 2013).
(i)k-NN
Given a new targettnew, we select a set of topkmost similar tar-gets,Mby usingSt. Then the interaction profile oftnewcan be computed as follows:ytnew¼
P
t2Mstðtnew;tÞyt P
t2Mstðtnew;tÞ
k-NN uses the closest instances (targets) to estimate interaction profile of a given new target, meaning thatk-NN only uses local information of drug– target interactions.
(ii) BLM-svc
Given a new targettnew, to predict the interaction betweentnew and drugd, BLM generates a prediction model by regarding each of other targets as one instance. That is, each instance (tar-get) has one binary label showing if the corresponding target is interacting with drugd. The prediction model of BLM-svc is support vector classification, for which the kernel is generated from drug similaritiesSd.
(iii) BLM-svr
BLM-svr uses the framework of BLM-svc, just by replacing svc with svr.
(iv) LapRLS
LapRLS minimizes the squared loss between Y and F (inter-action score matrix:parameter) with a regularized term of using StandF. This minimization leads to an analytical solution, by whichFcan be obtained easily by a rule consisting ofStandY. (v) NetLapRLS
NetLapRLS is an extension of LapRLS by incorporating the net-work information of drug–target interaction into the regularizer under the same regularized least squares framework.
(vi) WNN-GIP
Gaussian interaction profile (GIP) generates a Gaussian kernel for drug pairs using the similarity of interaction profiles of drugs and also a Gaussian kernel for target pairs from those of targets. From these kernels, GIP then generates a kernel between drug– target pairs, which is used for predicting drug–target inter-actions by regularized least squares. KNN-GIP is a slight exten-sion of GIP by usingk-NN for computing Gaussian interaction profiles.
3.4 Entire procedure of DrugE-Rank
Figure 1 shows the entire procedure of DrugE-Rank, with four steps.
3.4.1 Step 1: preprocessing data
For a given new targettnew, we generate 147-dimension feature vec-torxtnew (target feature vector or TFV) by Composition, Transition and Distribution (CTD), which is extensively used and sequence-derived physicochemical features. We obtain this data from a web server, PROFEAT (Rao et al., 2011). The genomic similarity be-tweentnewand a targettinT, that isstðtnew;tÞ, is computed by
nor-malized Smith–Waterman score on sequence similarity (Yamanishi
et al., 2008).
For the drug side, each drugdis represented by a 36-dimension GD (general descriptors) feature vectorxd0(drug feature vector or
DFV), which is generated by an open-source Chemoinformatics soft-ware, RDKit.1The GD features are, for each chemical compound, a set of physical molecular properties, such as van der Waals surface area, molar refractivity, log P (octanol/water), and partial charge. The chemical similarity betweendand drugd0inD, that issdðd;d0Þ,
is calculated by Tanimoto coefficient over 2D chemical substruc-tures of drugs.
Table 1summarizes the information on drug and target feature vectors.
3.4.2 Step 2: running component methods
We run six component methods to predict the score of drug–target interaction between any drugdand the given new targettnew,fiðd;
tnewÞfor i-th component, using the similarity between new target
tnewand another targett, that is stðtnew;tÞ, as the input. The
ob-tained score is further normalized to be a value between 0 and 1 as follows:
b
fiðd;tnewÞ ¼
fiðd;tnewÞ mini
maximini ;
where maxiand miniare the maximum and minimum prediction
scores ofi-th component method. This means, for a given new target tnewand a drugd, we can have a 6-dimension vectorxðd;tnewÞ(pair feature vector or PFV), where the i-th element of this vector is
b fiðd;tnewÞ.
3.4.3 Step 3: setting up feature vector
We generate the final feature vector for any pair of drugdand a newly given targettnew, by concatenating the following three types of features:
TFV: target feature vector
As described in Step 1, targettnewis represented by a 147-dimen-sion feature vector,xtnew.
DFV: drug feature vector
Also as mentioned in Step 1, each drugdis represented by a 36-dimension feature vector,xd.
PFV: pair feature vector
As described in Step 2, each drug–target pairðd;tnewÞcan be
rep-resented by a 6-dimension feature vector dðd;tnewÞ, showing the strength of interaction betweendandtnew.
Fig. 1.A four-step procedure of DrugE-Rank for predicting drugs’ interactions with a given targett0: (1) DrugE-Rank first computes feature vectors of targett0and arbitrary drugdand also similarity of targets and that of drugs, (2) DrugE-Rank runs six component methods by using similarities computed in Step 1 and the re-turning scores are generated as pair features, (3) A feature vector for drugdis generated from drug and target features, generated in Step 1 and pair features in Step 2, (4) Finally, the features are input into LTR and the resultant ranked drug list fort0can be returned
Table 1.Drug and target feature vectors
DFV TFV
Name General descriptor CTD
Dimension 36 147
Calculation RDKit PROFEAT
Description PEOE_VSA1 - PEOE_VSA14, SMR_VSA1 - SMR_VSA10, SlogP_VSA1 - SlogP_VSA12
Composition, transition and distribution
Thus, each drug–target pair is represented by 189 features, which are the input of Step 4 for ranking drugs to interact withtnew. 3.4.4 Step 4: ranking drugs by LTR
We use LambdaMART (Burges, 2010) for training LTR. Given a new targettnew, we can have the feature vector of a drug, according to Step 3, by which for drugs, we can generate multiple feature vec-tors, which are given as the input to the trained LTR. A ranked list of drugs is then returned as the final prediction result.
We note that when training LTR, we do not use all possible drug–target pairs, and instead for each target, we use only topK drugs highly predicted to be interacting with the target by each com-ponent method. In fact drug–target interaction is highly sparse data, by which false positives can occur easily. So this manner of using only topKdrugs is highly effective to avoid this type of false posi-tives and eventually reduce the computational cost in training LTR.
4 Experiments
4.1
Data
Drug–target interaction (binary) data are obtained from DrugBank, a high-quality human annotated database (Law et al., 2014), in which drugs are labeled with protein targets. In the data of DrugBank, we used only small molecules (FDA approved or experi-mental drug) and human proteins for targets. We first focused on FDA approved drugs and then conducted preliminary data analysis over the drug–target interactions with FDA approved drugs. In total, this data consists of 1242 drugs, 1324 targets and 5701 interactions (0.4% of all possible drug–target pairs).
4.1.1 Promiscuity of drugs and targets
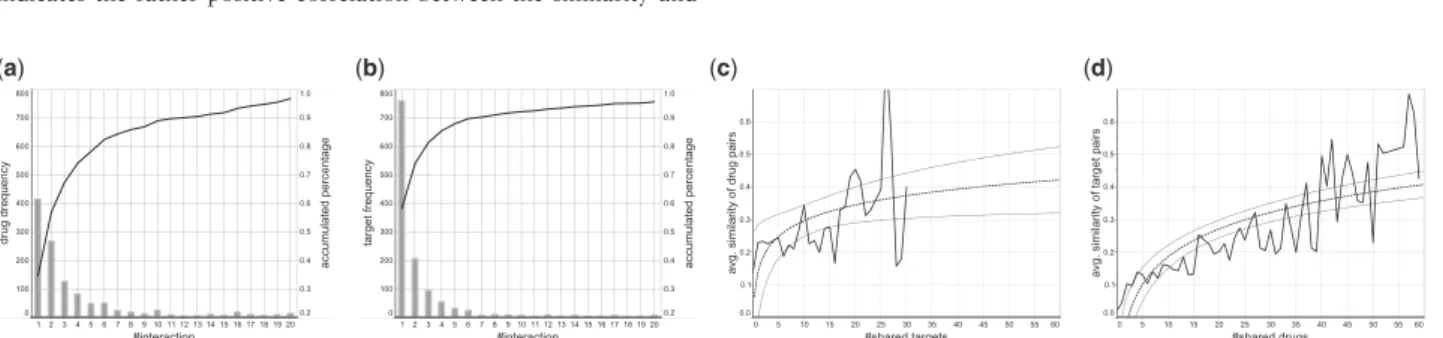
Figure 2shows the distribution of the number of (a) drugs and (b) targets when they are classified by the number of interactions. The result shows that more than 95% drugs/targets are involved in less than 20 interactions, meaning the sparseness and unbalancedness of the data, while in both drugs and targets, around half of them have more than one interactions, implying high promiscuity of those drugs and targets.
4.1.2 Correlation between #shared drugs/targets and similarity A hypothesis of similarity-based methods is that similar drugs will interact with similar or the same targets, and vice versa.Figure 2
shows the average similarity between (c) drugs due to the number of shared targets and (d) targets due to the number of shared drugs (both by the solid lines). The dashed lines show trend lines, which indicates the rather positive correlation between the similarity and
the number of shared drugs/targets, confirming the hypothesis of similarity-based methods,that is component methods in DrugE-Rank.
4.1.3 Generating subsets
We divided the entire DrugBank data into five subsets, named by Data-1 to Data-5, where Data-1 to Data-4 have FDA approved drugs and Data-5 has experimental drugs. Data-1 and Data-3 are distinct from Data-2 and Data-4 by the time (March, 2014) when drugs appear in DrugBank. Similarly, Data-1 and Data-2 are distinct from Data-3 and Data-4 by when (also March, 2014) targets appear in DrugBank.Table 2shows the summary of this classification of subsets, andTable 3shows the information on these datasets.
4.2
Experimental procedures
4.2.1 Competing methods
We compared DrugE-Rank with six component methods which are cutting-edge similarity-based machine learning methods for predict-ing drug–target interactions. Also we used two feature-based ma-chine learning methods, that is random forest (RF) and gradient boosting decision tree (GBDT) as competing methods, where only the DFV and TFV were used for RF and GBDT. Furthermore, within DrugE-Rank, we tested three different sets of feature vectors includ-ing: (i) DFV and TFV, (ii) PFV and (iii) all features (¼DFV, TFV and PFV), to check the contribution of the feature vectors to the per-formance improvement. We note that DrugE-Rank with DFV and
(a) (b) (c) (d)
Fig. 2.Analysis on drug–target interactions with FDA-approved drugs consisting of 5701 known interactions between 1242 FDA approved drugs and 1324 human protein targets. (a) #interactions versus #drugs, (b) #interactions versus #targets, (c) #shared targets versus average similarity between drugs and (d) #shared drugs versus average similarity between targets. In (c) and (d), the dashed lines show the trend lines, being fitted on a logarithmic function, and the two outside lines show the confidence interval of the estimation ((c):P¼0.046,R2
¼0.19 and (d):P¼0.001,R2¼0:57)
Table 3.Information on data subsets
Data-1 Data-2 Data-3 Data-4 Data-5
#Targets 1200 1200 124 124 1324
#Drugs 1178 64 1178 64 1753
#Interactions 5400 149 147 5 2094
Interaction rate (%) 0.382 0.194 0.101 – 0.09 #Interactions per target 4.5 – 1.19 – 1.58 #Interactions per drug 4.58 2.33 – – 1.19 Table 2.Binary drug–target interaction datasets from DrugBank
FDA drugs (before 03/2014) FDA drugs (after 03/2014) Experimental drugs
Targets (before 03/2014) Data-1 Data-2
Data-5 Targets (after 03/2014) Data-3 Data-4
TFV only is substantially equivalent to the existing work of using LTR, which is one of the most powerful feature-based machine learning approaches.
4.2.2 Evaluation criteria
Drug–target interactions are really sparse, by which false positives should be punished more in evaluation. Thus, we use AUPR, instead of AUC (Area Under the receiver operator characteristics curve), which treats all examples equally (Davis and Goadrich, 2006). Note that precision is the ratio of the correctly predicted positives to all predicted positives, and recall is the ratio of predicted positives to all positives.
4.2.3 Three types of experimental settings
Cross-validation over Data-1.We conducted 10 times 5-fold
cross-validation over Data-1, thinking about new drugs or new targets, meaning repeating randomly dividing drugs or targets of Data-1 into five parts (one for testing, one for training LTR and the rest for training component models) for 10 times. Pairedt-test was used to confirm the statistical significance of performance differences.
Independent test on Data-21Data-3 (new targets or new FDA
approved drugs (appearing in DrugBank after March 2014)).We
used Data-1 for training and Data-2 and Data-3 for testing. In train-ing, all targets (or drugs) in Data-1 were randomly divided into five subsets, four out of the five for training component models and the rest one for training LTR. We repeated this procedure 10 times and reported the average prediction performance.
Independent test on Data-5 (interactions with experimental drugs). We used all Data-1 to Data-4 for training and Data-5 for testing. The procedure is the same as the above independent test setting.
4.3
Parameter setting
4.3.1 Choosing parameter values
Fork-NN, kwas selected from {5,7,9,11,13,15,17} to maximize
AUPR under cross-validation. BLM-svc, BLM-svr, LapRLS, NetLapRLS and WNN-GIP were implemented exactly following their publications, where LibSVM was used for svc and BLM-svr, with regularization coefficient C of 1. RF, GBDT and LambdaMART were implemented by RankLib.2The default param-eter setting was used for LapRLS and NetLapRLS. The decay rateT of WNN-GIP was selected from {0.7, 0.8, 0.85, 0.9, 0.95} by 5fold
cross-validation to maximize AUPR. For RF, the number of bags was selected from {8,16,32,64,128} to maximize AUPR in cross-validation. Also for LambdaMART and GBDT, the number of trees and the number of leaves for each tree were selected from {8,16,32,64,128} and {4,8,16}, respectively, in a similar manner.
Component methods were used in DrugE-Rank, and also for comparing their performances with that of DrugE-Rank. Please note that data are different between the above two cases. For example, in DrugE-Rank, only a part of data was used, like in 5-fold cross-validation over Data-1, three among five folds for training component methods, one for training LTR and the last one for per-formance evaluation, while in perper-formance comparison, the same last one for performance evaluation and the rest are for training the component method.
4.3.2 SelectingK, the number of labels
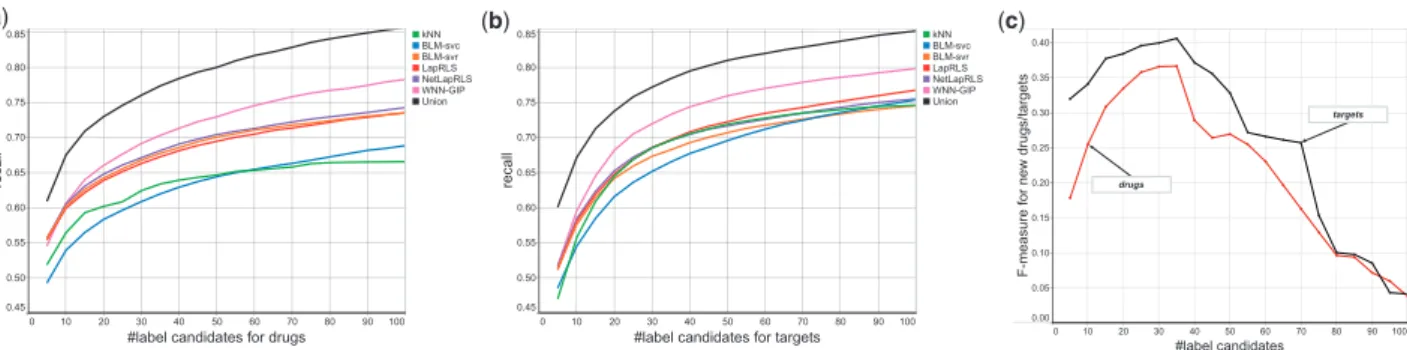
As shown by data analysis, drug–target interactions are very sparse and likely to cause false positives, meaning that reducing possible labels would be very useful. So we did a preliminary experiment to decide the number ofK, that is possible number of labels or candi-date drugs (for a given new target), by dividing Data-1 into five parts, one for training LTR, one for prediction and the rest for train-ing component models. After prediction, we checked the precision and recall of topKprediction results by component models and the union of their prediction results, changingK ¼ 5 to 100.Fig. 3(a) and (b)show that the recall values obtained by the results of this preliminary experiment. The union of the results obtained by com-ponent models reached 0.75 by integrating top 30, that is around 3% of all possible labels (drugs). This is much higher than that of each component model, implying that focusing on most confidently predicted drugs/targets is very useful. Finally, we computed F-meas-ure, the harmonic mean of precision and recall, for predicting new drugs or targets.Fig. 3(c)shows theF-measure against the number of label candidates, indicating that theF-measure can be maximized forK¼35, which we used for all experiments in this article.
4.4
Experimental results
4.4.1 Cross-validation over Data-1
Table 4 shows the performance results (AUPR) by six similarity-based methods, two feature-similarity-based methods and DrugE-Rank with three different sets of features. Among six similarity-based methods, BLM-svr was the best in both new drugs and new targets, being es-pecially significant in new target prediction. On the other hand, feature-based methods gave worse results than BLM-svr. For ex-ample, for predicting new drugs, BLM-svr achieved an AUPR of
(a) (b) (c)
Fig. 3.Selecting the number of labels by 105-fold cross-validation over Data-1. (a) Recall values by the prediction of component models and the union of their results, changed by the candidate drugs. (b) Also recall values, changed by the candidate targets. (c)F-measure values for predicting drugs/targets, obtained by the union of prediction results
0.3864, outperforming an AUPR of 0.3418 by RF and of 0.3328 by GBDT. DrugE-Rank, when all features were used, achieved the highest AUPR of 0.4917 for predicting new drugs and 0.5906 for new targets, being statistically significant against all other cases ex-cept DrugE-Rank with pair features. In particular, the AUPR of 0.4917 for new drugs is around 27% higher than that by BLM-svr, the best similarity-based prediction method. On the other hand, DrugE-Rank with drug and target features only showed comparative performance with BLM-svr, being much worse than DrugE-Rank with pair features or all features. This result indicates that pair fea-tures are much more important than drug and target feafea-tures. Also integrating pair features into drug and target features is important, confirming the usefulness of our idea.
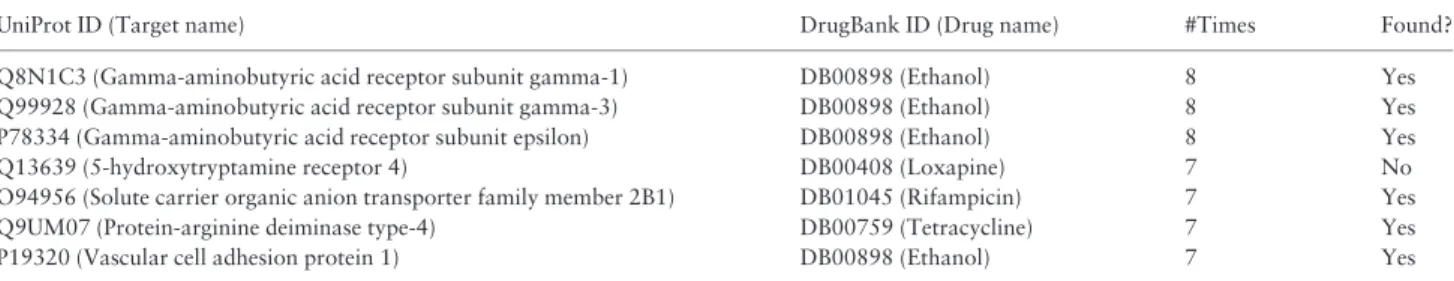
Furthermore, by using the 10 trained models of DrugE-Rank, we predicted unknown drug–target interactions (for Data-1) and checked if they are in the latest DrugBank. The interactions were sorted by how many times they are predicted in the top ten out of the 10 mod-els.Tables 5 and6show the results obtained by target-based and drug-based cross-validation, respectively. Surprisingly, six out of the top seven predicted interactions inTable 5and five out of the seven predicted interactions inTable 6can be found in the latest DrugBank (seesupplementary materialsfor more results). This result also indi-cates the high predictive performance of DrugE-Rank.
4.4.2 Independent test on Data-2 and Data-3
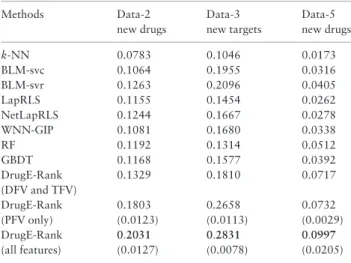
Table 7 shows the AUPR results obtained by applying models trained by Data-1 to independent datasets, Data-2 and Data-3. We can first see that the performance of all methods dropped signifi-cantly from the cross-validation results ofTable 4. This implies that the data distribution drastically changed between training and test-ing, being different from cross-validation. However, the relative per-formance order of different methods were still kept. First, BLM-svr achieved the higher AUPR than all other similarity-based methods and also two feature-based methods. Second, two feature-based methods did not perform well, against not only BLM-svr but also most of other similarity-based methods. Third, DrugE-Rank with all features was the best performer among all methods, being followed by DrugE-Rank with pair features. For example, for new drug pre-diction, DrugE-Rank with all features achieved the highest AUPR of 0.2031 with standard deviation of 0.0127, which is amazingly 61% higher than that by the best similarity-based method, BLM-svr with 0.1263. Again this result confirmed the importance of pair features and the advantage of DrugE-Rank.
We further checked the performance of the competing methods in more details, using AUPR by each method for one drug (in 2) and that for one target (in 3). That is, for example, in Data-2, we checked the method which gave the highest AUPR for each drug and then, for each method, counted the number of drugs to
Table 5.New interactions predicted by using target-based 105-fold cross validation results (models) on Data-1
UniProt ID (Target name) DrugBank ID (Drug name) #Times Found?
Q8N1C3 (Gamma-aminobutyric acid receptor subunit gamma-1) DB00898 (Ethanol) 8 Yes
Q99928 (Gamma-aminobutyric acid receptor subunit gamma-3) DB00898 (Ethanol) 8 Yes
P78334 (Gamma-aminobutyric acid receptor subunit epsilon) DB00898 (Ethanol) 8 Yes
Q13639 (5-hydroxytryptamine receptor 4) DB00408 (Loxapine) 7 No
O94956 (Solute carrier organic anion transporter family member 2B1) DB01045 (Rifampicin) 7 Yes
Q9UM07 (Protein-arginine deiminase type-4) DB00759 (Tetracycline) 7 Yes
P19320 (Vascular cell adhesion protein 1) DB00898 (Ethanol) 7 Yes
Note:Predicted (top 7) interactions were sorted by how many times they are predicted out of 10 times (shown by #times), and the last column shows Yes or
No, indicating if the interaction was found in the latest DrugBank database or not. Table 4.AUPR for 105-fold cross-validation over Data-1 (P-values
of pairedt-test against DrugE-Rank with all features)
Method Drug-based interactions Target-based interactions k-NN 0:3490ð1:971034Þ 0:4569ð2:241014Þ BLM-svc 0:3712ð7:691032Þ 0:5138ð6:231009Þ BLM-svr 0:3864ð7:251030Þ 0:5631ð1:301003Þ LapRLS 0:3848ð1:011033Þ 0:5517ð9:551004Þ NetLapRLS 0:3769ð2:101034Þ 0:5124ð8:841010Þ WNN-GIP 0:3641ð1:381029Þ 0:5281ð2:031005Þ RF 0:3418ð8:351029Þ 0:5014ð1:801010Þ GBDT 0:3328ð1:071029Þ 0:5278ð1:091006Þ DrugE-Rank 0:3874ð1:441021Þ 0:5427ð7:571005Þ (DFV and TFV) DrugE-Rank 0:4853ð0:065Þ 0:5841ð0:51Þ (PFV only) DrugE-Rank 0:4917 0:5906 (all features)
The AUPRs achieved by the best model, DrugE-Rank (all features), are highlighted in bold face.
Table 6.New interactions found by using drug-based 105-fold cross validation on Data-1
UniProt ID (Target name) DrugBank ID (Drug name) #Times Found?
Q16850 (Lanosterol 14-alpha demethylase) DB01045 (Rifampicin) 10 Yes
O94956 (Solute carrier organic anion transporter family member 2B1) DB01045 (Rifampicin) 10 Yes P48051 (G protein-activated inward rectifier potassium channel 2) DB00898 (Ethanol) 10 Yes
P20309 (Muscarinic acetylcholine receptor M3) DB01339 (Vecuronium) 10 No
P21728 (D(1A) dopamine receptor) DB00933 (Mesoridazine) 10 No
Q12809 (Potassium voltage-gated channel subfamily H member 2) DB00537 (Ciprofloxacin) 10 Yes Q02641 (Voltage-dependent L-type calcium channel subunit beta-1) DB00898 (Ethanol) 9 Yes
which the highest AUPR was given.Table 8shows the results. Both for drugs and targets, DrugE-Rank achieved the highest number. For example, DrugE-Rank performed the best in 74 out of all 124 targets, being followed by k-NN and BLM-svr, both having achieved the highest AUPR for 36 targets (please note that two or more methods may have achieved the same highest AUPR). This re-sult also confirmed the performance advantage of DrugE-Rank.
We finally explored the complementarity between different similarity-based methods, since they are used as component methods for ensemble learning of DrugE-Rank. We selected top 200 drugs predicted by each method, and plotted the rank of true interacting drugs by each method for a pair of two component methods, such as
k-NN versus BLM-svr. Figure 4 shows the results by (a) k-NN
versus BLM-svr, (b) NetLapRLS versus BLM-svr, (c) WNN-GIP
versus NetLapRLS and (d) BLM-svr versus WNN-GIP. So each point in the figure is a drug ranked higher than 200 in at least either of the competitive two methods, where red and blue points show those ranked lower than 200 by only one method. The points close to the diagonal line are the drugs for which two competing methods perform similarly, while the points far from the diagonal line are the drugs for which one method performs much better than the other method.Figure 4shows that no methods can beat other methods clearly. Even between the worst component methodk-NN and the best component method BLM-svr, shown in (a), there are a few true interacting drugs on the side of BLM-svr, meaning that they are ranked higher by k-NN than BLM-svr. Also shown in (c), NetLapRLS and WNN-GIP, which achieved almost similar AUPR values of around 0.167 inTable 7, have very few drugs close to the diagonal line, meaning that their rankings are totally different. All these results confirm the complementarity of different component methods, which must bring diverse effects to allow DrugE-Rank to improve the predictive performance by their ensemble.
4.4.3 Independent test on Data-5
Table 7 shows the AUPR results obtained by applying models trained by Data-1 to Data-4 to independent dataset Data-5. The val-ues are further decreased from those obtained when Data-2 and Data-3 were used for independent test sets. This indicates that inter-actions with experimental drugs in Data-5 have totally different na-ture from interactions in other subsets. However, the performance order was again kept the same as that in the cross-validation experi-ment over Data-1. Concretely, BLM-svr achieved the best perform-ance among six similarity-based methods, and DrugE-Rank outperformed BLM-svr. In particular DrugE-Rank with drug and target features outperformed BLM-svr rather clearly, and are rather close to the other two DrugE-Rank settings. Overall we can say that the framework of DrugE-Rank is useful for predicting unknown, in-dependent drug–target interactions with new drugs (or targets).
4.5
Two cases
We present two specific cases with sample drugs and targets, which are correct and were ranked high by DrugE-Rank, with their rank-ings by other competing methods.Table 9shows the top three drugs ranked by DrugE-Rank, meaning that they were predicted to inter-act with a given new target, ‘inhibitor of nuclear finter-actor kappa-B kin-ase subunit alpha’. Also Table 10 shows the top five targets, predicted by DrugE-Rank, and the rankings obtained by other com-peting methods. We can see that even if the rankings of drugs (or targets) by component methods were very low by multiple compo-nent methods, DrugE-Rank could identify these drugs successfully. For example, inTable 10, given Nintedanib, DrugE-Rank success-fully identify the targets which interact with Nintedanib, such as Table 7.AUPR for independent testing data (FDA approved, new
drugs and experimental drugs)
Methods Data-2 Data-3 Data-5
new drugs new targets new drugs
k-NN 0.0783 0.1046 0.0173 BLM-svc 0.1064 0.1955 0.0316 BLM-svr 0.1263 0.2096 0.0405 LapRLS 0.1155 0.1454 0.0262 NetLapRLS 0.1244 0.1667 0.0278 WNN-GIP 0.1081 0.1680 0.0338 RF 0.1192 0.1314 0.0512 GBDT 0.1168 0.1577 0.0392 DrugE-Rank 0.1329 0.1810 0.0717 (DFV and TFV) DrugE-Rank 0.1803 0.2658 0.0732 (PFV only) (0.0123) (0.0113) (0.0029) DrugE-Rank 0:2031 0:2831 0:0997 (all features) (0.0127) (0.0078) (0.0205)
Table 8The number of drugs and targets, for which each method achieved highest AUPR.
Methods Drugs (Data-2) Targets (Data-3)
k-NN 9 36 BLM-svc 14 35 BLM-svr 14 36 LapRLS 13 26 NetLapRLS 13 32 WNN-GIP 17 34 DrugE-Rank 24 74 (a) (b) (c) (d)
Fig. 4.Complementarity between component methods. The 200 drugs correctly predicted for a new given target by each method is compared with that of an-other. The comparison is between (a)k-NN versus BLM-svr, (b) NetLapRLS versus BLM-svr, (c) WNN-GIP versus NetLapRLS and (d) BLM-svr versus WNN-GIP
Vascular endothelial growth factor receptor 3, which was ranked out of top 50 by four component methods,k-NN, svc, BLM-svr and WNN-GIP. Overall, this result also shows the good predict-ive ability of DrugE-Rank.
5 Discussion
Identifying drug–target interactions of new, unknown drugs or tar-gets is a very challenging task, where interactions of new drugs or targets are unavailable. Previous methods can be divided into two groups, feature- and similarity-based methods. DrugE-Rank incorp-orates the outputs of similarity-based methods as features to im-prove the prediction performance. This point has not been considered in any existing work including those using LTR. Our ex-perimental results clearly demonstrated that the novel combination of similarity- and feature-based methods such as DrugE-Rank is significantly better than independent approaches. Moreover, DrugE-Rank provides a robust framework to integrate other types of infor-mation to improve the accuracy of drug–target interaction prediction.
Compared with drug and target features, pair features from the similarity based component methods are the key to improve the per-formance of DrugE-Rank. A common assumption behind similarity-based methods is that similar drugs (targets) are likely to interact with similar targets (drugs). We validated this assumption in DrugBank data analysis. In addition, we compared the drugs highly predicted by component methods directly, confirming that compo-nent methods in DrugE-Rank can provide diverse results and are complement to each other. This must contribute to the performance improvement of DrugE-Rank. Currently we select the component methods by considering their accuracy, diversity and efficiency. With the increase of possible component methods, an interesting problem would be how to automatically choose the most suitable component methods.
We found that identifying interactions of new drugs is more diffi-cult than the one of new targets, which is consistent with previous study (Dinget al., 2014). This suggests that the action mechanism of drug is complicated, where one drug may have multiple types of tar-gets and sometimes similar drugs may have different mechanisms. In this case, Rank would be particularly useful since DrugE-Rank can integrate the diverse component methods effectively for better performance. In fact, the performance improvement over the
component methods by DrugE-Rank for a new drug is much higher than the one for a new target. Another interesting discovery is that relative low prediction performance on FDA experimental drugs. One main reason is that the ratio of drug–target interaction for ex-perimental drugs is much lower than the one for FDA approved drugs (training data). Many non-interaction pairs might be false negatives. DrugE-Rank can be used to predict top drug–target pairs as the promising candidates for further experimental verification.
6 Conclusion
We have developed DrugE-Rank to improve the performance of pre-dicting drug–target interactions of new drugs or targets. The idea of DrugE-Rank are three folds: (i) the problem of predicting drug–tar-get interactions can be modeled as a multilabel classification task; (ii) this problem can be suitably solved by using LTR, a powerful feature-based machine learning approach, which converts multilabel classification to label ranking; (iii) the outputs of cutting-edge simi-larity-based machine learning methods can be features like drug and target features, all being able to be the input of LTR. DrugE-Rank outperformed all competing methods, in both cross-validation and several independent test scenarios, which demonstrate the predictive advantage of DrugE-Rank. In addition, in contrast to previous stud-ies with a small number of targets, all known interactions in DrugBank have been used in this work, indicating the thoroughness and validity of our results. Overall we believe that this high-performance software, DrugE-Rank will contribute to the develop-ment of pharmaceutical sciences and relevant industry.
Funding
This work was supported by the National Natural Science Foundation of China (61572139, 61379092 and 61422309), Scientific Research Starting Foundation for Returned Overseas Chinese Scholars, Ministry of Education, China. H.M. would like to thank MEXT for KAKENHI #16H02868 and Tekes for FiDiPro. Conflict of Interest: none declared.
References
Acharya,C.et al. (2011) Recent advances in ligand-based drug design: rele-vance and utility of the conformationally sampled pharmacophore ap-proach.Curr. Comput.-Aided Drug Des.,7, 10.
Table 10.Ranks by competing methods for top five targets predicted by DrugE-Rank for drug ‘Nintedanib’ (DrugBank ID: DB09079, in Data-2)
UniProt ID (Name) DrugE-Rank k-NN BLM-svc BLM-svr LapRLS NetLapRLS WNN-GIP
P35916 (Vascular endothelial growth factor receptor 3) 1 78 105 72 7 13 60
P17948 (Vascular endothelial growth factor receptor 1) 2 79 113 73 11 14 61
P36888 (Receptor-type tyrosine-protein kinase FLT3) 3 38 13 17 67 39 4
P35968 (Vascular endothelial growth factor receptor 2) 4 77 32 77 17 22 65
P21802 (Fibroblast growth factor receptor 2) 5 40 156 18 93 72 15
Table 9.Ranks by competing methods for top three drugs predicted by DrugE-Rank for new protein target ‘inhibitor of nuclear factor kappa-B kinase subunit alpha’ (UniProt ID: O15111, in Data-3)
DrugBank ID (Name) DrugE-Rank k-NN BLM-svc BLM-svr LapRLS NetLapRLS WNN-GIP
DB00244 (Mesalazine) 1 3 3 3 3 4 35
DB00795 (Sulfasalazine) 2 4 1177 4 4 5 3
DB00233 (Aminosalicylic Acid) 3 25 269 382 308 960 13
Agarwal,S.et al. (2010) Ranking chemical structures for drug discovery: a new machine learning approach.J. Chem. Inf. Model.,50, 716–731. Bleakley,K. and Yamanishi,Y. (2009) Supervised prediction of drug–target
interactions using bipartite local models.Bioinformatics,25, 2397–2403. Bolton,E.E.et al. (2008) Pubchem: integrated platform of small molecules and
biological activities.Ann. Rep. Comput. Chem.,4, 217–241.
Boutet,E. et al. (2007) Uniprotkb/swiss-prot. Methods Mol. Biol., 406, 89–112.
Burges,C.J. (2010) From ranknet to lambdarank to lambdamart: an overview.
Technical reportMSR-TR-2010-82, Microsoft Research.
Davis,J. and Goadrich,M. (2006) The relationship between precision-recall and roc curves.Machine Learning, Proceedings of the Twenty-Third International Conference ICML 2006, Pittsburgh, Pennsylvania, USA, 233–240.
Ding,H.et al. (2014) Similarity-based machine learning methods for predict-ing drug–target interactions: a brief review.Brief. Bioinfo.,15, 734–747. Go¨nen,M. (2012) Predicting drug–target interactions from chemical and
gen-omic kernels using bayesian matrix factorization. Bioinformatics, 28, 2304–2310.
Jacob,L. and Vert,J.P. (2008) Protein–ligand interaction prediction: an im-proved chemogenomics approach.Bioinformatics,24, 2149–2156. Keiser,M.et al. (2009) Predicting new molecular targets for known drugs.
Nature,462, 175–181.
Law,V.et al. (2014) Drugbank 4.0: shedding new light on drug metabolism.
Nucleic Acids Res.,42,-D1, D1091–D1097.
Li,H. (2011) A short introduction to learning to rank.IEICE Trans.,94-D, 1854–1862.
Liu,B.et al. (2015a) Application of learning to rank to protein remote hom-ology detection.Bioinformatics,31, 3492–3498.
Liu,K.et al. (2015b) Meshlabeler: improving the accuracy of large-scale mesh indexing by integrating diverse evidence.Bioinformatics,31, 339–347. Liu,T.Y. (2009) Learning to rank for information retrieval.Found. Trends Inf.
Retriev.,3, 225–331.
Lounkine,E.et al. (2012) Large-scale prediction and testing of drug activity on side-effect targets.Nature,486, 361–367.
Lyne,P.D. (2002) Structure-based virtual screening: an overview. Drug
Discov. Today,7, 1047–1055.
Mei,J.P.et al. (2013) Drug–target interaction prediction by learning from local information and neighbors.Bioinformatics,29, 238–245.
Mousavian,Z. and Masoudi-Nejad,A. (2014) Drug-target interaction predic-tion via chemogenomic space: learning based methods.Expert Opin. Drug Metabol. Toxicol.,10, 1273–1287.
Nagamine,N. and Sakakibara,Y. (2007) Statistical prediction of protein– chemical interactions based on chemical structure and mass spectrometry data.Bioinformatics,23, 2004–2012.
Nunez,S.et al. (2012) Target-drug interations: first principles and their appli-cation to drug discovery.Drug Discov. Today,17, 10–22.
Overington,J.et al. (2006) How many drug targets are there.Nat. Rev. Drug Discov.,5, 993–996.
Qeli,E.et al. (2014) Improved prediction of peptide detectability for targeted proteomics using a rank-based algorithm and organism-specific data. J. Proteomics.,108, 269–283.
Rao,H.et al. (2011) Update of profeat: a web server for computing structural and physicochemical features of proteins and peptides from amino acid se-quence.Nucleic Acids Res.,39(suppl 2), W385–W390.
Rathke,F.et al. (2010) Structrank: a new approach for ligand-based virtual screening.J. Chem. Inf. Model.,51, 83–92.
Scannell,J.et al. (2012) Diagnosing the decline in pharmaceutical r&d effi-ciency.Nat. Rev. Drug Discov.,11, 191–200.
Shi,J.et al. (2015) Predicting drug–target interaction for new drugs using enhanced similarity measures and super-target clustering.Methods,83, 98–104. Tabei,Y.et al. (2012) Identification of chemogenomic features from drug–
target interaction networks using interpretable classifiers.Bioinformatics, 28, i487–i494.
van Laarhoven,T.et al. (2011) Gaussian interaction profile kernels for predict-ing drug–target interaction.Bioinformatics,27, 3036–3043.
van Laarhoven,T. and Marchiori,E. (2013) Predicting drug-target interactions for new drug compounds using a weighted nearest neighbor profile.PloS One,8, e66952.
Xia,Z.et al. (2010) Semi-supervised drug-protein interaction prediction from heterogeneous biological spaces.BMC Syst. Biol.,4, S6.
Yabuuchi,H.et al. (2011) Analysis of multiple compound–protein interactions reveals novel bioactive molecules.Mol. Syst. Biol.,7, 472.
Yamanishi,Y. (2013) Chemogenomic approaches to infer drug-target inter-action networks.Methods Mol. Biol.,939, 97–113.
Yamanishi,Y.et al. (2008) Prediction of drug–target interaction networks from the integration of chemical and genomic spaces.Bioinformatics,24, i232–i240.
Zhang,W.et al. (2015) When drug discovery meets web search: learning to rank for ligand-based virtual screening.J. Cheminf.,7, 5.
Zheng,X.et al. (2013) Collaborative matrix factorization with multiple simi-larities for predicting drug–target interactions. InACM KDD, 1025–1033. ACM.