High-density multi-population consensus
genetic linkage map for peach
Cassia da Silva Linge1, Laima Antanaviciute1, Asma Abdelghafar
ID1, Pere Aru´ s2,
Daniele Bassi3, Laura RossiniID3, Stephen Ficklin4, Ksenija GasicID1*
1 Clemson University, Department of Plant and Environmental Sciences, Clemson, SC, United States of
America, 2 Institut de Recerca i Tecnologia Agroalimentàries (IRTA), Centre de Recerca en Agrigenòmica Consejo Superior de Investigaciones Cientı´ficas (CSIC)-IRTA–Universitat Autònoma de Barcelona (UAB)– University of Barcelona (UB), Campus UAB, Bellaterra (Cerdanyola del Vallès), Barcelona, Spain,
3 Universitàdegli Studi di Milano, Department of Agricultural and Environmental Sciences–Production, Landscape, Agroenergy, Milan, Italy, 4 Washington State University, Department of Horticulture, Pullman, WA, United States of America
Abstract
Highly saturated genetic linkage maps are extremely helpful to breeders and are an essen-tial prerequisite for many biological applications such as the identification of marker-trait associations, mapping quantitative trait loci (QTL), candidate gene identification, develop-ment of molecular markers for marker-assisted selection (MAS) and comparative genetic studies. Several high-density genetic maps, constructed using the 9K SNP peach array, are available for peach. However, each of these maps is based on a single mapping population and has limited use for QTL discovery and comparative studies. A consensus genetic link-age map developed from multiple populations provides not only a higher marker density and a greater genome coverage when compared to the individual maps, but also serves as a valuable tool for estimating genetic positions of unmapped markers. In this study, a previ-ously developed linkage map from the cross between two peach cultivars ‘Zin Dai’ and ‘Crimson Lady’ (ZC2) was improved by genotyping additional progenies. In addition, a peach consensus map was developed based on the combination of the improved ZC2 genetic linkage map with three existing high-density genetic maps of peach and a reference map of Prunus. A total of 1,476 SNPs representing 351 unique marker positions were mapped across eight linkage groups on the ZC2genetic map. The ZC2linkage map spans 483.3 cM with an average distance between markers of 1.38 cM/marker. The MergeMap and LPmerge tools were used for the construction of a consensus map based on markers shared across five genetic linkage maps. The consensus linkage map contains a total of 3,092 molecular markers, consisting of 2,975 SNPs, 116 SSRs and 1 morphological marker associated with slow ripening in peach (SR). The consensus map provides valuable infor-mation on marker order and genetic position for QTL identification in peach and other genetic studies within Prunus and Rosaceae.
a1111111111 a1111111111 a1111111111 a1111111111 a1111111111 OPEN ACCESS
Citation: da Silva Linge C, Antanaviciute L, Abdelghafar A, Aru´s P, Bassi D, Rossini L, et al. (2018) High-density multi-population consensus genetic linkage map for peach. PLoS ONE 13(11): e0207724.https://doi.org/10.1371/journal. pone.0207724
Editor: Rosalyn B. Angeles-Shim, Texas Tech University, UNITED STATES
Received: August 24, 2018
Accepted: November 4, 2018 Published: November 21, 2018
Copyright:©2018 da Silva Linge et al. This is an open access article distributed under the terms of theCreative Commons Attribution License, which permits unrestricted use, distribution, and reproduction in any medium, provided the original author and source are credited.
Data Availability Statement: The ZC2improved map and peach consensus map reported in this study are available at the Genome Database for Rosaceae (www.rosaceae.org) under the accession number tfGDR1036.
Funding: This project was supported in part by the USDA-NIFA-Specialty Crop Research Initiative project, RosBREED: Enabling marker-assisted breeding in Rosaceae (2009-51181-05808) to KG, and RosBREED 2: Combining disease resistance with horticultural quality in new rosaceous cultivars
Introduction
A genetic linkage map represents positions and genetic distances of molecular markers on chromosomes allocated based on segregation data and recombination events of individuals in a mapping population [1,2]. Genetic maps are important tools for a vast number of genetic applications and are widely used in plant breeding programs, genetics and genomics studies. In particular, these maps are crucial for a better understanding of marker-trait associations through quantitative trait loci (QTL) mapping, discovery of genes associated with economi-cally important fruit quality and disease resistance traits, and successful deployment of molec-ular markers in plant breeding programs via marker-assisted selection (MAS) [3–5]. In addition, linkage maps provide an important foundation for other biological applications including candidate gene identification, map-based gene cloning, genome evolution, compara-tive genomics studies and genome assembly [6–11]. High-resolution maps which cover the entire genome with co-segregating, reproducible and high-throughput markers at short inter-vals are most valuable because of the increased resolution that leads to more effective QTL mapping, candidate gene detection, and more precise estimates of QTL effect [5,12,13].
Peach is a recognized model for Rosaceae genetics and genomics with a wealth of publicly available resources [14,15]. Recent advances in next-generation high-throughput sequencing and genotyping techniques, such as development of the IPSC 9K peach array [16], have per-mitted rapid development of high-quality genetic linkage maps [17–20].
In peach (Prunus persicaL. Batsch), linkage maps have been used in QTL discovery of phys-iological traits, key fruit quality traits such as fruit size, diameter, firmness, acidity, individual sugars (fructose, glucose, sucrose and sorbitol), aroma, flesh, peel related phenolic compounds, and disease resistance traits [17,18,21–31]. These maps were typically developed for mapping particular traits in specific parental backgrounds and differ in population size and molecular markers used [4,5] resulting in limited value for comparative studies.
Multiple maps developed for the same species usually contain many common markers, which can be used as anchor points for consensus map integration [4,5,32,33]. Highly satu-rated genetic maps with evenly distributed markers across linkage groups, with no regions of low marker density are most suitable for the construction of a consensus map. Consensus maps developed from multiple populations provide a higher marker density and a greater genome coverage when compared to the individual maps. They also serve as valuable tools for estimating genetic positions, detecting inconsistencies among maps, comparing marker distri-butions and QTL locations [5]. Consensus maps could also aid estimation of genetic positions of unmapped markers (markers without genetic position) included in genotyping arrays. This is especially important in pedigree-based QTL analyses [34] that require precise genetic posi-tions of the markers to accurately detect QTLs in pedigree-related individuals, when develop-ment of mapping populations is improbable. To assign genetic positions to unmapped markers, the common approach was to use a genome-wide mean as a conversion factor [35]. In order to overcome the problem of using the static conversion factor, Fresnedo et al. [30] developed a consensus RosBREED [36] linkage map (RC1) for peach predicting genetic dis-tances by incorporating the physical and genetic positions of 68 markers from thePrunusbin map [37]. However, this map was developed by calculating genetic positions using polynomial equations, not by merging individual peach linkage maps.
In the Rosaceae family, a consensus map was developed for pear [38] and two integrated linkage maps have been reported in apple based on merging five and three populations [5,39]. Although a peach consensus map was previously reported [25], it was constructed using only two peach linkage maps and the GoldenGate genotyping platform which is less commonly used in the peach community compared to the IPSC 9k SNP array.
(2014-51181-22378) to KG. The Spanish Ministry of Economy and Competitiveness (project RTA2015-00050-00-00, Severo Ochoa Program for Centres of Excellence in R&D 201-2019 (SEV-2015-0533) and CERCA Programme-Generalitat de Catalunya). This work was in part supported by the Ministero delle Politiche Agricole Alimentari e Forestali (MiPAAF, Italy) through the projects DRUPOMICS (grant DM14999/7303/08), and ’MAS.PES: apricot and peach breeding by molecular-assisted selection’ a project funded by private and public agencies.
Competing interests: The authors have declared that no competing interests exist.
Consensus maps built using freely available MergeMap [40] and LPMerge algorithms [41] were reported in different plants, including barley [42,43], cowpea [44], rapeseed [45], spring wheat [46], loblolly pine [47], cassava [48], oak [49], oilseed rape [50] and faba bean [51], pear [38], and two integrated linkage maps in apple [5,39].
In this study, we report the improvement of the previously developed peach linkage map ‘Zin Dai’ x ‘Crimson Lady’ (ZC2) by genotyping additional progenies. In addition, a consensus peach linkage map was created based on the improved ZC2map and four other unrelated high-density maps using two algorithms (MergeMap and LPMerge). The consensus map pro-vides valuable information on marker order and genetic position and will be useful in future studies of pedigree-based QTL analyses in peach.
Materials and methods
Plant material and DNA extraction
An F2mapping population obtained from selfing an individual from the cross between ‘Zin
Dai’ and ‘Crimson Lady’ (ZC2) was previously reported [17]. A map was elaborated based on 25 selected seedlings, genotyped with the 9k peach SNP array [16]. In this paper, we have geno-typed an additional set of 65 individuals (for a total of 90 individuals) for the development of an improved genetic linkage map. DNA was isolated from young and healthy leaf tissue as described previously by Dellaporta et al. [52]. The concentration and purity of DNA was mea-sured by a NanoDrop ND-1000 spectrophotometer. The final concentrations of all DNA sam-ples were adjusted to 50 ng/μl for high-throughput genotyping.
Genotypic data
DNA samples for a total of 65 ‘Zin Dai’בCrimson Lady’ seedlings and parental genotypes were submitted to the Research Technology Support Facility at Michigan State University (East Lansing, MI, USA) for genotyping by the peach Illumina 9K SNP array v1. The iScan data output files were analyzed as previously described by Frett et al. [17]. Briefly, the Geno-meStudio software was used to verify the quality for all samples and SNPs observed. Markers with GenTrain score above 0.4 were inspected. The failed and monomorphic markers were excluded, whereas the polymorphic SNPs were further inspected for clustering analysis. Mark-ers with more than three expected clustMark-ers (AA, AB and BB) and missing in at least one of the parental genotypes were excluded from further analysis. SNP markers for which the number of missing genotypes was greater than 10% were not considered for map construction.
SNP-based linkage map construction
The improvement of the existing SNP-based genetic linkage map was based on combining polymorphic SNP marker data, observed in this study, with previously mapped marker data from the ZC2mapping population [17]. A genetic linkage map was constructed using SNPs homozygous for alternate allele in two grandparents (AA in one parent and BB in other) as well as SNPs homozygous in one and heterozygous in the other grandparent. F2population
type codes were applied [53].
SNP markers mapped to the same location, identical markers, were grouped into single bins with the purpose of reducing map complexity for linkage analysis. A single SNP contain-ing no misscontain-ing data for a progeny was used for linkage analysis from each bin.
Linkage map construction was performed by the JoinMap 4.1 (Kyazma, NL) software applying Maximum Likelihood (ML) function [53]. The parameters used for map construction were as follows: a minimum of a logarithm of the odds (LOD) score of 3.0 was used to assign
markers to linkage groups with a maximum recombination fraction of 0.4, goodness-of-fit jump threshold of 5.0 and a triplet threshold of 1.0. Markers exhibiting segregation distortion were identified applying the Chi-square (X2)-goodness-of-fit test (p<0.05) and also inte-grated into the map. Graphical presentation of an improved SNP-based genetic linkage map of the ZC2progeny consisting of eight linkage groups was generated by MapChart version 2.3 software [54]. Marker genetic distances on the linkage groups were presented in centimorgans (cM).
Comparison of an improved ZC
2linkage map with the peach genome
sequence v2.0
The genetic positions of each SNP marker mapped to the ZC2linkage map was aligned with their physical position on the peach genome v2.0 sequence [55] by MapChart 2.3 [54], simi-larly to what had been previously described by Frett et al. [17].
Consensus map construction
Genetic distances of SSR and SNP markers, as well as slow ripening locus (Sr), mapped across four integrated F2linkage maps: PI91459(‘NJ Weeping’)בBounty’ (WB) [18], ‘O’Henry’×
‘Clayton’ (OC) [19], ‘Venus’בVenus’ (VxV) [20] and ‘Texas’בEarlygold’ (T×E) [56] were obtained from the Genome Database for Rosaceae (GDR) [14–15]. The MergeMap software [40] and LPmerge R package [41] were used to merge four previously reported genetic linkage maps with the improved (ZC2) map developed in this study. To prepare input data for Merge-map and LPmerge, the SNP markers that were non-collinear in comparison with the peach genome were removed from individual maps. For LPmerge, the maximum interval parameter K varied from 1 to 4, and the composite map with the lowest root mean square error (RMSE) was selected. The consistency of all marker names across five linkage maps was verified to avoid marker duplications on the consensus map. The consensus map was constructed by merging a single linkage group (LG) of all five maps at the time, following the protocol reported by Khan et al. [5]. A weight of 1.0 was applied to all linkage groups across all maps. The RMSE in marker order between the consensus maps and the input maps, were calculated by the R package hydroGOF [57], as described in Westbrook et al. [47], and the consensus map with the lowest average RMSE was used for further analysis. The physical positions of all markers mapped to the consensus peach linkage map were compared to the peach genome sequence v2.0 [55] and visualized in Mapchart 2.0 [54].
Estimating the genetic position (cM) for unmapped SNP markers in the 9K
SNP array
A Perl Script was developed to estimate the genetic positions for the unmapped SNP markers in the 9K SNP array using the peach consensus map as a reference. The term “unmapped” des-ignates the markers from the genotyping array that were not mapped in one of the individual maps used for building the consensus map. The genetic position for each unmapped marker was estimated using the two closest mapped SNPs in the peach consensus map reported in this study. The equations are as follows:
delta bp¼snp2bp snp1bp
delta cM¼snp2cM snp1cM
where: delta_bp is distance in bp between mapped SNPs in the consensus map; delta_cM is distance in cM between mapped SNPs in the consensus map; snp_bp is the physical position of the peach SNP being estimated (in bp); snp1_bp and snp2_bp are the immediate left and right physical positions (bp) of SNPs that map to the genetic map and snp1_cM and snp2_cM are their corresponding genetic positions (in cM).
In cases where a SNP was beyond the last mapped SNP, the same delta_cM from the last two SNPs on the linkage group and snp2_bp became the position at the scaffold end.
Results
The improved linkage map for ZC
2population
The construction of the improved SNP-based linkage map was based on heterozygous SNPs observed in this study combined with SNP marker data previously reported by Frett et al. [17]. A total of 1,478 SNPs were informative in the ZC2progeny. Out of those, 2 SNPs were
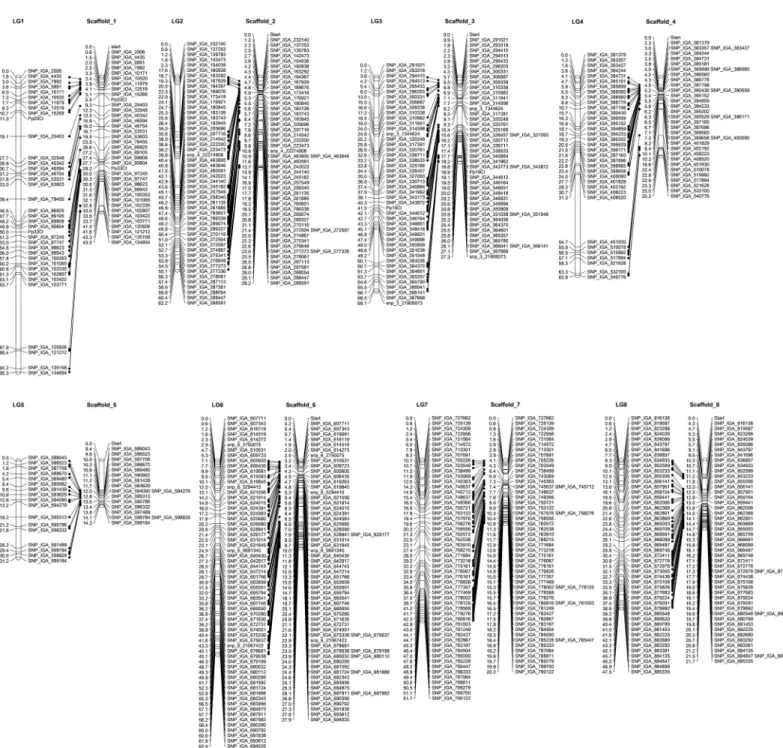
unlinked (0.1%) and 1,476 were used for map construction. Maximum Likelihood mapping successfully mapped 1,476 SNP markers with 351 unique positions (S1 Table;Fig 1).
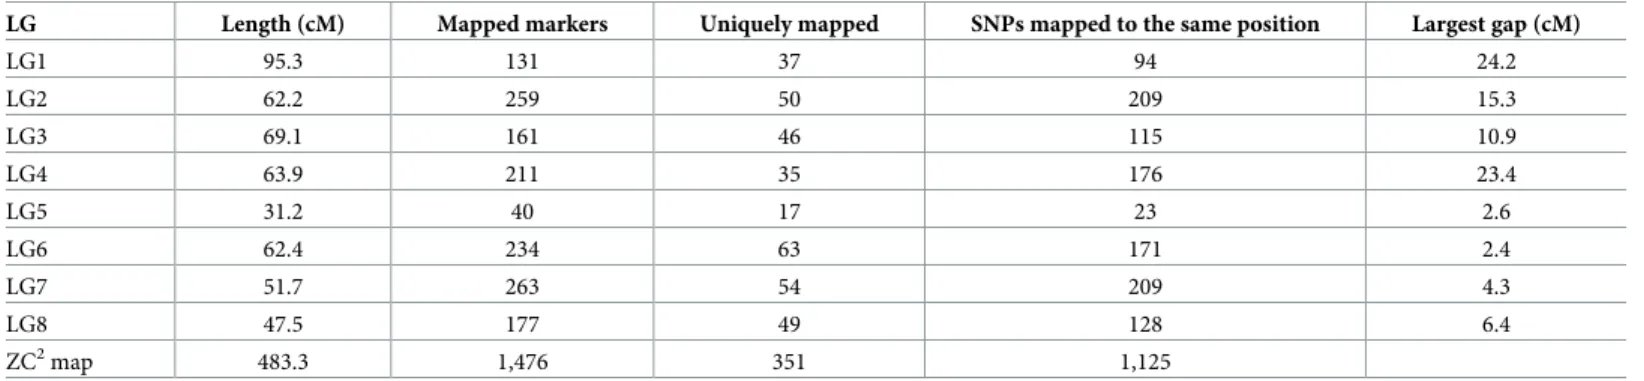
The revised linkage map of the ZC2progeny spanned a total genetic distance of 483.3 cM, with linkage group 1 (LG1) being the longest (95.3 cM) and LG5 the shortest (31.2 cM). The highest number of SNPs mapped to a single linkage group was 263 on LG7 and the lowest was 40 on LG5. The number of unique map positions mapped on a single linkage group ranged from 63 on LG6 to 17 on LG5. The largest gap was observed in LG1 (24.2 cM) between SNP_IGA_103771 and SNP_IGA_120926 (Table 1). SNP marker density per linkage group ranged from 0.96 to 2.58 cM with the average of 1.38 cM.
Comparison of the ZC
2linkage map with the peach physical map v 2.0
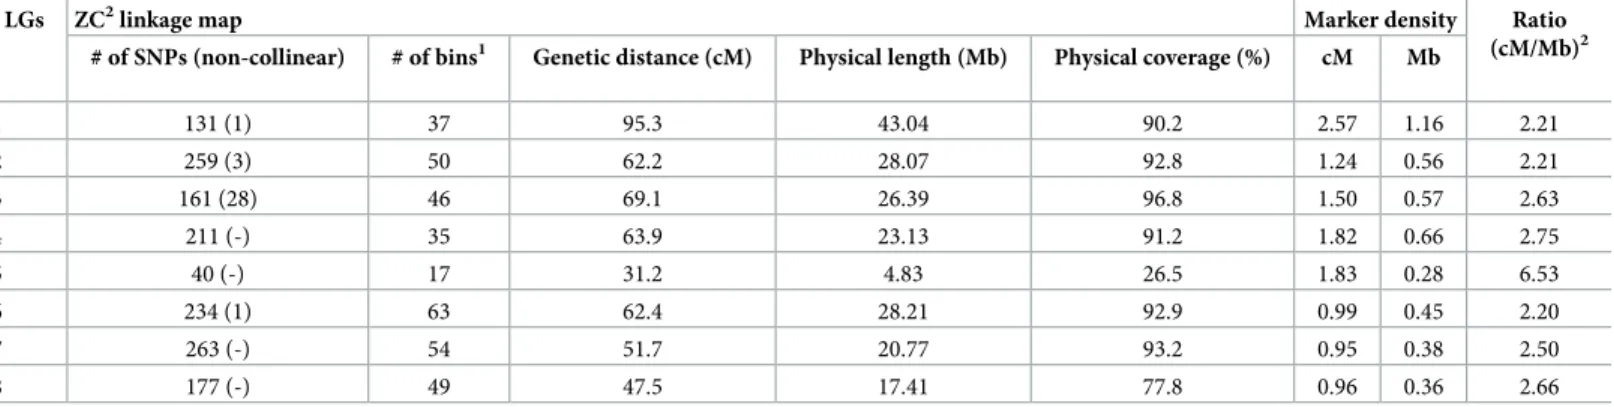
The ZC2map covers approximately 82.7% of the peach genome v2.0 (Table 2). LG3 had the largest coverage (96%), while the lowest coverage (26%) was observed on LG5. The improved ZC2genetic map had 97.8% of all SNP markers in agreement with their positions on the scaf-folds of the peach genome v 2.0 with differences in the marker order identified in LGs 1, 2, 3 and 6 (Table 2,Fig 2). LG3 had the highest number of non-collinear SNP markers (28). The recombination rate of different chromosomes was estimated as the quotient between the genetic distance (cM) covered by the corresponding LG and the size in Mb of the chromosome fragment covered with markers. This value ranged from 2.20 cM/Mb on LG6 to 6.53 cM/Mb on LG5, almost a three-fold difference in the recombination rate of the corresponding geno-mic regions (Table 2).Comparison of the two versions of the ZC
2map
The reconstruction of the ZC2linkage map resulted in a higher number of mapped markers, from 1,335 mapped on existing map [17] up to 1,476 SNPs mapped on the improved ZC2map. The number of unique SNP positions mapped increased from 190 in the previous map to 351 in the improved map. In addition, the SNP marker density in the improved map (1.38 cM/ marker) was higher than that reported in the previous one (2.3 cM/marker). The improved genetic linkage map consisted of eight linkage groups, corresponding to the number of scaf-folds in the peach genome, while the previous map consisted of 14 linkage groups.
Consensus genetic map of peach
Four previously published bi-parental linkage maps, WB [18], OC [19], VxV [20], TxE [56] and an improved ZC2map developed in this study, were used to construct the consensus
peach map. The number of markers mapped on these maps ranged from 1,948 in TxE to 877 in WB.
SNPs that mapped to positions that are non-collinear with their physical position on the peach genome were removed from individual maps and 3,092 markers, including 2,975 SNPs, 116 SSRs and one morphological marker (SR) associated with slow ripening in peach [31] Fig 1. The improved SNP-based genetic linkage map of ‘Zin Dai’בCrimson Lady’ (ZC2) progeny. Marker names are listed at the right side of each LG and the genetic position (in cM) is listed at the left of each marker.
https://doi.org/10.1371/journal.pone.0207724.g001
Table 1. The improved SNP-based genetic linkage map of ‘Zin Dai’בCrimson Lady’ (ZC2) progeny.
LG Length (cM) Mapped markers Uniquely mapped SNPs mapped to the same position Largest gap (cM)
LG1 95.3 131 37 94 24.2 LG2 62.2 259 50 209 15.3 LG3 69.1 161 46 115 10.9 LG4 63.9 211 35 176 23.4 LG5 31.2 40 17 23 2.6 LG6 62.4 234 63 171 2.4 LG7 51.7 263 54 209 4.3 LG8 47.5 177 49 128 6.4 ZC2map 483.3 1,476 351 1,125 https://doi.org/10.1371/journal.pone.0207724.t001
distributed in eight linkage groups, were used to build the consensus map by two different algorithms, i.e. MergeMap and LPmerge.
A total of 1,416 SNPs were common to at least two linkage maps with 2,547 anchor points
(Table 3). There were 457 anchor points between VxV and TxE maps, while only 98 anchor
points were observed between WB and ZC2maps. LG4 had the highest number of anchors points (648), while the lowest number was detected in LG5 (100). The highest number of com-mon markers acom-mong the LGs was observed in LG4 (325) and the lowest was observed on the LG5 with only 70 common markers.
Consensus genetic maps built by MergeMap and LPmerge algorithms
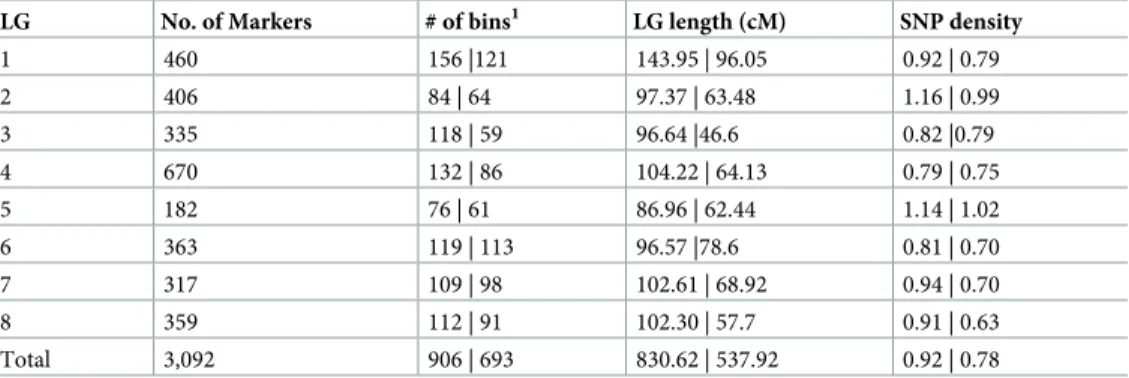
Consensus maps were successfully developed by MergeMap and LPMerge algorithms. How-ever, mismatch in marker order between the two versions of the consensus map was observed (S2andS3Tables). The MergeMap consensus map had a genetic distance of 830.62 cM with the length of individual LGs ranging from 86.96 to 143.95 cM, observed in LG5 and LG1, respectively (S2 Table). Average distance between the markers was 0.92 cM and the largest gap size was 8.8 cM on LG2. There were 906 uniquely mapped positions ranging from 156 on LG1 to 76 on LG5 (Table 4;S1 Fig).The consensus map built with the LPMerge algorithm spanned 537.92cM, with the length of individual LGs ranging from 46.6 to 96.05cM for LG3 and LG1, respectively (S3 Table). Average distance between the markers was 0.78 cM and the largest gap of 7.31 cM was observed on LG5 (Table 4;Fig 3). The number of uniquely mapped positions were 693, with the lowest in LG3 (59), and the largest in LG1 (121). The LPMerge peach consensus map had the lowest average RMSE and was further referred to as the peach consensus map (S4 Table).
Comparison of the peach consensus map with the peach physical map v2.0
The physical length of the peach consensus map was estimated to cover approximately 98% of the pseudomolecules of peach genome v2.0 with most of the scaffolds having a coverage above 95%, except for scaffold 5 (91.0%). The recombination rate of different chromosomes ranged from 1.63 cM/Mb on LG4 to 3.77 cM/Mb on LG5. The consensus map was collinear with the peach genome revealing complete agreement in the SNP marker order (S2 Fig;Table 5). Table 2. Comparison of the ZC2linkage map with the peach physical map v 2.0.LGs ZC2linkage map Marker density Ratio
(cM/Mb)2 # of SNPs (non-collinear) # of bins1 Genetic distance (cM) Physical length (Mb) Physical coverage (%) cM Mb
1 131 (1) 37 95.3 43.04 90.2 2.57 1.16 2.21 2 259 (3) 50 62.2 28.07 92.8 1.24 0.56 2.21 3 161 (28) 46 69.1 26.39 96.8 1.50 0.57 2.63 4 211 (-) 35 63.9 23.13 91.2 1.82 0.66 2.75 5 40 (-) 17 31.2 4.83 26.5 1.83 0.28 6.53 6 234 (1) 63 62.4 28.21 92.9 0.99 0.45 2.20 7 263 (-) 54 51.7 20.77 93.2 0.95 0.38 2.50 8 177 (-) 49 47.5 17.41 77.8 0.96 0.36 2.66 1
Groups of markers with the same genetic position
2
Ratio between genetic distance and physical length that estimates the recombination rate per chromosome
The peach consensus map was used as a reference with a Perl script (developed in-house) to calculate genetic positions of markers from the peach 9K array, and the genetic positions of 6,019 unmapped SNP markers were provided inS5 Table.
Discussion
The improved linkage map for ZC
2population
Genotyping of additional 65 F2individuals from the cross ‘Zin Dai’ and ‘Crimson Lady’
improved the existing ZC2map [17] and resulted in a map with a better resolution and more
Fig 2. Alignment of the ZC2linkage map and the peach genome sequence v2.0. Peach genome scaffolds and ZC2linkage groups are shown on the left and right of each pair, respectively.
uniquely mapped positions. In comparison to the previous ZC2map, the number of linkage groups decreased from 14 to eight and the number of mapped markers increased from 1,335 to 1.476. The number of unique positions increased by approximately 84% (Table 1) as well as marker density (from 2.4 to 1.38cM/marker). The first version of the map covered 61.6% of the pseudomolecules of the peach genome, while the improved map covered 82.7%. Genetic length (483.3 cM) and SNP density (1.38 cM/SNP) of the improved ZC2map were similar to previously reported SNP maps in peach [25,28,19]. The new ZC2map had a higher marker density than the other maps based on the 9K SNP array [28,19]. The observed gaps on LGs 1 and 6 (24.2 and 23.4 cM, respectively) agreed with those reported by Yang et al. [19] and Frett et al. [17] who used the same genotyping strategy.
Marker order comparison between the ZC2genetic map and the physical map, based on peach genome v2.0, revealed discrepancies in marker positions across LGs 1, 2, 3 and 6. Non-Table 3. Comparison between five peach genetic maps for common markers and anchor points across different linkage groups used to construct a consensus genetic map.
Linkage Maps LG1 LG2 LG3 LG4 LG5 LG6 LG7 LG8 Anchors/Map
WB vs. OC 51 11 35 33 6 12 33 29 210 WB vs. VxV 82 10 45 54 1 19 22 26 259 WB vs. TxE 62 24 44 38 36 37 29 33 303 WB vs. ZC2 14 2 9 19 13 12 14 15 98 OC vs. VxV 89 19 76 138 1 10 38 26 397 OC vs. TxE 38 66 45 110 14 20 53 38 384 OC vs. ZC2 10 11 17 22 10 1 42 20 133 VxV vs. TxE 75 39 65 144 1 45 32 56 457 VxV vs. ZC2 6 8 16 62 1 9 13 14 129 TxE vs. ZC2 13 15 17 28 17 25 30 32 177 Anchors/LG 440 205 369 648 100 190 306 289 2547 Number of markers 217 149 178 325 70 133 177 167
The anchor points between pair of genetic maps and corresponding linkage groups, as well as the total number of markers in common on each linkage group are shown. WB, ‘NJ Weeping’ x ‘Bounty’ [18]; OC, ‘O’Henry’ x ‘Clayton’ [19]; VxV, ‘Venus’בVenus’ [20]; TxE, ‘Texas’ x ‘Earlygold’ [56]; ZC2, ‘Zin Dai’ x ‘Crimson Lady’ improved map.
https://doi.org/10.1371/journal.pone.0207724.t003
Table 4. Comparison between peach consensus maps built using MergeMap and LPmerge.
LG No. of Markers # of bins1 LG length (cM) SNP density
1 460 156 |121 143.95 | 96.05 0.92 | 0.79 2 406 84 | 64 97.37 | 63.48 1.16 | 0.99 3 335 118 | 59 96.64 |46.6 0.82 |0.79 4 670 132 | 86 104.22 | 64.13 0.79 | 0.75 5 182 76 | 61 86.96 | 62.44 1.14 | 1.02 6 363 119 | 113 96.57 |78.6 0.81 | 0.70 7 317 109 | 98 102.61 | 68.92 0.94 | 0.70 8 359 112 | 91 102.30 | 57.7 0.91 | 0.63 Total 3,092 906 | 693 830.62 | 537.92 0.92 | 0.78
Number of bins, linkage group length and marker density per linkage group generated by MergeMap and LPmerge are shown on left and right, respectively.
1
Groups of markers with the same genetic position.
collinearity in other peach maps has been reported when both the peach genome v1 [24–
25,17,18] and v2.0 [28] were used for comparison. Non-collinearity in marker order could be due to specific characteristics of the population, such as size, presence of chromosome rear-rangements, and/or linkage mapping and genotyping errors. It could also indicate misassem-blies in the peach genome sequence v2.0 [55]. The improved ZC2map provides an excellent resource for mapping QTLs associated with fruit quality and phytochemical compounds, since the ZC2progeny segregate for many traits including flowering and ripening time, blush, fruit size, flesh adhesion and texture, and phytochemical content [58]. Thus, the improved ZC2 map provides a valuable tool for future work to better understand genetic mechanisms that control these traits in peach.
Consensus genetic map of peach
The peach research community has been using aPrunusgenetic map based on an interspecific cross between almond ‘Texas’ and peach ‘Earlygold’ (TxE) [3,56,59] as a reference for estab-lishing linkage group orientation and comparative QTL studies. Prior to the availability of the peach genome sequence, the TxE map was a valuable tool as a source of mapped and transfer-able markers (mainly SSRs and RFLPs) for the construction of low density maps and the com-parison between intraspecific peach and otherPrunusspecies maps [59]. The release of the peach genome sequence [55,60] triggered the development of the 9K peach SNP array [16] and promoted genetic studies in peach using a common genotyping strategy [17,18,19,20,56]. This established the foundation for the development of the peach consensus map reported in this study.
The five highly saturated maps used for building the consensus peach map were based on SSR and SNP markers [20,56] or exclusively SNP markers [17,18]. The high number of com-mon markers (1,416) and anchor points (2,547) facilitated the integration of the individual linkage maps into the consensus map and provided reliable information about SNP marker order and genetic distance in the consensus map. The number of anchor points observed in the peach consensus map was higher than that observed in the consensus maps developed for apple [5,39] and pear [38].
Fig 3. Peach consensus linkage map built using four previously published bi-parental linkage maps, PI91459(‘NJ Weeping’)בBounty’ (WB) [18], ‘O’Henry’בClayton’ (OC) [19], ‘Venus’בVenus’ (VxV) [20] and ‘Texas’× ‘Earlygold’ (T×E) [56], and an improved ‘Zin Dai’בCrimson Lady’2map developed in this study with LPMerge
algorithm. Marker names are listed at the right side of each LG and the genetic position (in cM) is listed at the left of each marker.
https://doi.org/10.1371/journal.pone.0207724.g003
Table 5. Comparison of the peach consensus map with the peach genome sequence v2.0.
LG No. of Markers Genetic distance Physical length Physical coverage Marker density Ratio
(cM) (Mb) (%) cM Mb (cM/Mb)1 1 460 96.05 47.44 99 0.79 0.39 2.03 2 406 63.48 30.13 99 0.99 0.47 2.10 3 335 46.60 27.25 99 0.79 0.46 1.71 4 670 64.13 25.15 99 0.75 0.29 2.59 5 182 62.44 16.52 91 1.02 0.27 3.77 6 363 78.60 30.10 99 0.70 0.27 2.59 7 317 68.92 22.19 98 0.70 0.22 3.18 8 359 57.70 21.91 97 0.63 0.24 2.63 1
Ratio genetic distance/physical length that estimates the recombination rate per chromosome.
The MergeMap algorithm resulted in consensus map with a higher genetic length
(830.62cM) and a lower marker density (0.92cM/marker) compared to the LPMerge algorithm (537.92 cM and 0.78cM/marker, respectively). A possible explanation for the observed differ-ences between the two algorithms is that the MergeMap assigned unique positions to most of the markers, while the LPMerge binned markers into the same map positions. Thus, the non-binning attribute of the MergeMap provided higher genetic length of the consensus map [47]. The overestimated genetic length in the consensus map constructed by the MergeMap was previously reported in pear [38], barley [43]Pinus taeda, andPinus elliottii[47]. On the other hand, the genetic length of the LPMerge peach consensus map was within the range of the five individual maps used in this study (336.0–536.6 cM). In addition, each algorithm ordered markers differently in the consensus map resulting in non-collinearity in the MergeMap peach consensus map with peach genome v2.0. A possible explanation is that MergeMap simplified consensus graphs were not ordinally equivalent to the original linkage maps used for building the consensus map [61]. The LPMerge map had the lowest RMSE compared to the input maps and was chosen as the consensus map.
The peach consensus map described here exhibited approximately 98% coverage and full SNP collinearity with the pseudomolecules/scaffolds of the peach genome v2.0 [55], which is similar to coverage obtained with consensus maps developed for apple [5] and pear [38]. The high level of genome coverage confirms the correct positioning of the markers in the consen-sus map that emerges as reliable tool for future genetic studies such as QTL mapping and can-didate gene analyses [5].
This is, to our knowledge, the most comprehensive peach consensus map constructed thus far. Although two consensus peach maps have been previously reported, their application is limited due to either small number of genotypes providing recombination events and less common genotyping platform in the peach community [25], or being developed not by merg-ing individual peach linkage maps but by calculatmerg-ing genetic positions [30]. The consensus map reported in this study is an alternative source of information for calculating genetic posi-tions of unmapped markers in the 9K peach SNP array and QTL mapping via pedigree [34].
Conclusions
In this study, we genotyped 65 additional F2individuals using the 9K SNP array and
signifi-cantly increased the resolution of the previously published ZC2map. Using the improved ZC2 map with four other high-density linkage maps (all genotyped with the 9K SNP array), we developed a high-resolution consensus map for peach using LPMerge algorithm. The peach consensus linkage map contains a total of 3,092 molecular markers (2,975 SNPs, 116 SSRs and 1 morphological marker associated with slow ripening in peach), 2,547 anchor points and cov-ers approximately 98% of the physical length of the peach genome v2.0. This consensus genetic linkage map represents the most comprehensive peach map available to date and could serve as a new reference map for peach. The consensus map provides valuable information on marker order and genetic position for QTL identification and molecular marker development in peach and other genetic studies within thePrunusand Rosaceae.
Supporting information
S1 Fig. MergeMap peach consensus map with 3,092 markers. Marker names are listed at the right side of each LG and the genetic position (in cM) are listed at the left of each marker. (TIF)
S2 Fig. Alignment of the peach consensus map and the peach genome sequence v2.0. Peach genome scaffolds and linkage groups are shown on the left and right of each pair, respectively. (TIF)
S1 Table. The improved SNP-based genetic linkage map of ‘Zin Dai’בCrimson Lady’ (ZC2) progeny.
(XLSX)
S2 Table. Peach consensus map with 3,092 molecular markers and constructed using Mer-geMap algorithm.
(XLSX)
S3 Table. Peach consensus map with 3,092 molecular markers and constructed using LPMerge algorithm.
(XLSX)
S4 Table. Root mean squared error (RMSE) in marker order between the MergeMap and LPmerge peach consensus maps and the five input maps.
(XLSX)
S5 Table. Estimated genetic position of the SNPs markers from 9K SNP array using peach consensus map as a reference.
(XLSX)
Author Contributions
Conceptualization: Ksenija Gasic.Formal analysis: Cassia da Silva Linge, Laima Antanaviciute. Funding acquisition: Ksenija Gasic.
Investigation: Asma Abdelghafar.
Resources: Asma Abdelghafar, Pere Aru´s, Daniele Bassi, Laura Rossini, Stephen Ficklin, Kse-nija Gasic.
Supervision: Ksenija Gasic.
Writing – original draft: Cassia da Silva Linge, Laima Antanaviciute.
Writing – review & editing: Pere Aru´s, Daniele Bassi, Laura Rossini, Stephen Ficklin, Ksenija Gasic.
References
1. Collard BC, Jahufer MZ, Brouwer J, Pang EC. An introduction to markers, quantitative trait loci (QTL) mapping and marker-assisted selection for crop improvement: The basic concepts. Euphytica 2005; 142:169–196.
2. Wu J, Li LT, Li M, Khan MA, Li XG, Chen H, et al. High-density genetic linkage map construction and identification of fruit-related QTLs in pear using SNP and SSR markers. J Exp Bot. 2014; 65(20): 5771– 5781.https://doi.org/10.1093/jxb/eru311PMID:25129128
3. Joobeur T, Viruel MA, de Vicente MC, Ja´uregui B, Ballester J, Dettori MT, et al. Construction of a satu-rated linkage map for Prunus using an almond×peach F2progeny. Theor. Appl. Genet. 1998; 97:
1034–1041.
4. Wu Y, Close TJ, Lonardi S. On the accurate construction of consensus genetic maps. Comput. Syst. Bioinformatics Conf. 2008; 7: 285–296. PMID:19642288
5. Khan MA, Han Y, Zhao YF, Troggio M, Korban SS. A multi-population consensus genetic map reveals inconsistent marker order among maps likely attributed to structural variations in the apple genome. PLoS ONE 2012; 7: e47864.https://doi.org/10.1371/journal.pone.0047864PMID:23144832
6. Diaz A, Fergany M, Formisano G, Ziarsolo P, Blanca J, Fei Z, et al. A consensus linkage map for molec-ular markers and quantitative trait loci associated with economically important traits in melon (Cucumis
melo L.). BMC plant biology 2011; 11: 111.https://doi.org/10.1186/1471-2229-11-111PMID:
21797998
7. Illa E, Sargent DJ, Lopez Girona E, Bushakra J, Cestaro A, Crowhurst R, et al. Comparative analysis of rosaceous genomes and the reconstruction of a putative ancestral genome for the family. BMC Evolu-tionary Biology 2011; 11:9.https://doi.org/10.1186/1471-2148-11-9PMID:21226921
8. Pirona R, Eduardo I, Pacheco I, Da Silva Linge C, Miculan M, Verde I, et al. Fine mapping and identifica-tion of a candidate gene for a major locus controlling maturity date in peach. BMC Plant Biol 2013; 13 (1):166.https://doi.org/10.1186/1471-2229-13-166PMID:24148786
9. Yagi M, Yamamoto T, Isobe S, Hirakawa H, Tabata S, Tanase K. Construction of a reference genetic linkage map for carnation (Dianthus caryophyllus L.). BMC Genomics 2013; 14(1): 734.https://doi.org/ 10.1186/1471-2164-14-734PMID:24160306
10. Longhi S, Giongo L, Buti M, Surbanovski N, Viola R, Velasco R, et al. Molecular genetics and genomics of the Rosoideae: state of the art and future perspectives. Horticulture Research 2014; 1.https://doi. org/10.1038/hortres.2014.1PMID:26504527
11. Vendramin E, Pea G, Dondini L, Pacheco I, Dettori MT, Gazza L, et al. A unique mutation in a MYB gene cosegregates with the nectarine phenotype in peach. PLoS ONE 2014; 9:e90574.https://doi.org/ 10.1371/journal.pone.0090574PMID:24595269
12. Davey JW, Hohenlohe PA, Etter PD, Boone JQ, Catchen JM, Blaxter ML. Genome-wide genetic marker discovery and genotyping using next-generation sequencing. Nature Reviews Genetics 2011; 12: 499– 510.https://doi.org/10.1038/nrg3012PMID:21681211
13. Xu Y, Huang L, Ji D, Chen C, Zheng H, Xie C. Construction of a dense genetic linkage map and map-ping quantitative trait loci for economic traits of a doubled haploid population of Pyropia haitanensis (Bangiales, Rhodophyta). BMC Plant Biol 2015; 15:228.https://doi.org/10.1186/s12870-015-0604-4
PMID:26391981
14. Jung S, Staton M, Lee T, Blenda A, Svancara R, Abbott A, et al. GDR (Genome Database for Rosa-ceae): integrated web-database for Rosaceae genomics and genetics data. Nucleic Acids Research, 2008; 36(Database issue): D1034–D1040.https://doi.org/10.1093/nar/gkm803PMID:17932055 15. Jung, S., Lee, T., Cheng, C-H., Buble, K., Zheng, P., Yu, J., et al (2018) 15 years of GDR: New data and
functionality in the Genome Database for Rosaceae. Nucleic Acid Researchhttps://doi.org/10.1093/ nar/gky1000
16. Verde I, Bassil NV, Scalabrin S, Gilmore B, Lawley CT, Gasic K, et al. Development and Evaluation of a 9K SNP Array for Peach by Internationally Coordinated SNP Detection and Validation in Breeding Germplasm. PLoS One 2012; 7(6): e35668.https://doi.org/10.1371/journal.pone.0035668PMID:
22536421
17. Frett T, Reighard G, Okie W, Gasic K. Mapping quantitative trait loci associated with blush in peach [Prunus persica (L.) Batsch]. Tree Genet Genomes 2014; 10: 367–381.
18. Da Silva Linge C, Bassi D, Bianco L, Pacheco I, Pirona R, Rossini L. Genetic dissection of fruit weight and size in an F2 peach (Prunus persica (L.) Batsch) progeny. Mol Breed 2015; 35:71.https://doi.org/ 10.1007/s11032-015-0271-z
19. Yang N, Reighard GL, Ritchie D, Okie WR, Gasic K. Mapping quantitative trait loci associated with resistance to bacterial spot (Xanthomonas arboricola pv. pruni) in peach. Tree Genet Genomes 2013;
https://doi.org/10.1007/s11295-012-0580-x
20. Nuñez-Lillo G, Cifuentes-Esquivel A, Troggio M, Micheletti D, Infante R, Campos-Vargas R, et al. Identi-fication of candidate genes associated with mealiness and maturity date in peach [Prunus persica (L.) Batsch] using QTL analysis and deep sequencing. Tree Genet. Gen. 2015; 11:86https://doi.org/10. 1007/s11295-015-0911-9
21. Foulongne M, Pascal T, Pfeiffer F, Kervella J. QTLs for powdery mildew resistance in peach×Prunus davidiana crosses: consistency across generations and environments. Mol Breed 2003; 12: 33–50. 22. Fan S, Bielenberg DG, Zhebentyayeva TN, Reighard GL, Okie WR, Holland D, et al. Mapping
quantita-tive trait loci associated with chilling requirement, heat requirement and bloom date in peach (Prunus
persica). The New Phytologist 2010; 185: 917–930.https://doi.org/10.1111/j.1469-8137.2009.03119.x
PMID:20028471
23. Eduardo I, Pacheco I, Chietera G, Bassi D, Pozzi C, Vecchietti A, et al. QTL analysis of fruit quality traits in two peach intraspecific populations and importance of maturity date pleiotropic effect. Tree Genet Genomes 2011; 7: 323–335.
24. Eduardo I, Chietera G, Pirona R, Pacheco I, Troggio M, Banchi E, et al. Genetic dissection of aroma vol-atile compounds from the essential oil of peach fruit: QTL analysis and identification of candidate genes using dense SNP maps. Tree Genet Genomes 2013; 9: 189–204.
25. Martınez-Garcıa P, Parfitt D, Ogundiwin E, Fass J, Chan H, Ahmad R, Lurie S, et al. High-density SNP mapping and QTL analysis for fruit quality characteristics in peach (Prunus persica L.). Tree Genet Genomes 2013; 9: 19.https://doi.org/10.1007/s11295-012-0522-7
26. Pacheco I, Bassi D, Eduardo I, Ciacciulli A, Pirona R, Rossini L, et al. QTL mapping for brown rot
(Moni-linia fructigena) resistance in an intraspecific peach (Prunus persica L. Batsch) F1 progeny. Tree Genet
Genomes 2014; 10: 1223–1242.https://doi.org/10.1007/s11295-014-0756-7
27. Zeballos J, Abidi W, Gime´nez R, Monforte AJ, Moreno MA, Gogorcena Y. QTL analysis of fruit quality traits in peach [Prunus persica (L.) Batsch] using dense SNP maps. Acta Hortic 2015; 1084: 703–710.
28. Zeballos JL, Abidi W, Gime´nez S, Monforte AJ, Moreno MA., Gogorcena Y. Mapping QTLs associated with fruit quality traits in peach [Prunus persica (L.) Batsch] using SNP maps. Tree Genet. Genomes 2016; 12:37.https://doi.org/10.1007/s11295-016-0996-9
29. Fresnedo-Ramı´rez J, Bink M, de Weg E, Famula TR, Crisosto CH, Frett TJ, et al. QTL mapping of pomological traits in peach and related species breeding germplasm. Mol Breeding 2015; 35: 166.
https://doi.org/10.1007/s11032-015-0357-7
30. Fresnedo-Ramı´rez J, Frett TJ, Sandefur PJ, Salgado-Rojas A, Clark JR, Gasic K, et al. QTL mapping and breeding value estimation through pedigree-based analysis of fruit size and weight in four diverse peach breeding programs. Tree Genet Genomes 2016; 12: 25. https://doi.org/10.1007/s11295-016-0985-z
31. Cirilli M, Bassi D, Ciacciulli A. Sugars in peach fruit: a breeding perspective. Horticulture Research 2016; 3: 15067.https://doi.org/10.1038/hortres.2015.67PMID:26816618
32. Yan Z, Denneboom C, Hattendorf A, Dolstra O, Debener T, Stam P, et al. Construction of an integrated map of rose with AFLP, SSR, PK, RGA, RFLP, SCAR and morphological markers. Theor. Appl. Genet. 2005; 110: 766–777.https://doi.org/10.1007/s00122-004-1903-6PMID:15672277
33. N’Diaye A, Van de Weg WE, Kodde LP, Koller B, Dunemann F, Thiermann M, et al. Construction of an integrated consensus map of the apple genome based on four mapping populations. Tree Genet. Genomes 2008; 4: 727–743.https://doi.org/10.1007/s11295-008-0146-0
34. Bink M, Jansen J, Madduri M, Voorrips R, Durel C, Kouassi A, et al. Bayesian QTL analyses using pedi-greed families of an outcrossing species, with application to fruit firmness in apple. TheorAppl Genet 2014; 127: 1073–1090.
35. Herna´ndez Mora JR, Micheletti D, Bink M, Van de Weg E, Cantı´n C, Nazzicari N, et al. Integrated QTL detection for key breeding traits in multiple peach progenies. BMC Genomics 2017; 18: 404.https://doi. org/10.1186/s12864-017-3783-6PMID:28583082
36. Iezzoni A, Weebadde C, Luby J, Yue C, Van de Weg E, Fazio G, et al. RosBREED: enabling marker-assisted breeding in Rosaceae. Acta Hortic 2010; 859: 389–394.
37. Howad W, Yamamoto T, Dirlewanger E, Testolin R, Cosson P, Cipriani G, et al. Mapping with a few plants: using selective mapping for microsatellite saturation of the Prunus reference map. Genetics 2005; 171: 1305–1309.https://doi.org/10.1534/genetics.105.043661PMID:16118196
38. Li L, Deng C, Knaebel M, Chagne D, Kumar S, Sun J, et al. Integrated high-density consensus genetic map of Pyrus and anchoring of the ‘Bartlett’ v1.0 (P. communis) genome. DNA Res 2017; 24: 289–301.
https://doi.org/10.1093/dnares/dsw063PMID:28130382
39. Clark M, Schmitz C, Rosyara U, Luby J, Bradeen J. A consensus ‘Honeycrisp’ apple (Malus× domes-tica) genetic linkage map from three full-sib progeny populations. Tree Gen Genomes 2014; 10(3):
627–639.
40. Wu Y, Close TJ, Lonardi S. Accurate construction of consensus genetic maps via integer linear pro-gramming. IEEE/ACM Trans. Comput. Biol. Bioinform. 2011; 8: 381–394.
41. Endelman JB, Plomion C. LPmerge: an R package for merging genetic maps by linear programming. Bioinformatics 2014; 30: 1623–1624.https://doi.org/10.1093/bioinformatics/btu091PMID:24532720 42. Close TJ, Bhat PR, Lonardi S, Wu Y, Rostoks N, Ramsay L, et al. Development and implementation of
high throughput SNP genotyping in barley. BMC Genomics 2009; 10: 582.https://doi.org/10.1186/ 1471-2164-10-582PMID:19961604
43. Muñoz-Amatriaı´n M, Moscou MJ, Bhat PR, Svensson JT, Bartos J, Sucha´nkova´ P, et al. An improved consensus linkage map of barley based on flow-sorted chromosomes and single nucleotide polymor-phism markers. The Plant Genome 2011; 4: 238–249.
44. Muchero W, Diop NN, Bhat PR, Fenton RD, Wanamaker S, Pottorff M, et al. A consensus genetic map of cowpea [Vigna unguiculata (L) Walp.] and synteny based on EST-derived SNPs. Proc. Natl Acad. Sci. 2009; 106: 18159–18164.https://doi.org/10.1073/pnas.0905886106PMID:19826088
45. Wang J, Lydiate IA, Parkin IAP, Falentin C, Delourme R, Carion PWC, et al. Integration of linkage maps for the amphidiploid Brassica napus and comparative mapping with Arabidopsis and Brassica rapa. BMC Genomics 2011; 12:101.https://doi.org/10.1186/1471-2164-12-101PMID:21306613
46. Patel JS, Mamidi S, Bonman JM, Adhikari T. Identification of QTL in spring wheat associated with resis-tance to a novel isolate of Pyrenophoratritici-repentis. Crop Sci 2013; 53: 842–852.
47. Westbrook JW, Chhatre VE, Wu L-S, Chamala S, Neves LG, Muñoz P, et al. A consensus genetic map for Pinus taeda and Pinus elliottii and extent of linkage disequilibrium in two genotype-phenotype dis-covery populations of Pinus taeda. G3: Genes Genomes. Genetics 2015; 5: 1685–1694.https://doi. org/10.1534/g3.115.019588PMID:26068575
48. International Cassava Genetic Map Consortium. High-resolution linkage map and chromosome-scale genome assembly for cassava (Manihot esculenta Crantz) from 10 populations. G3: Genes/Genomes/ Genetics 2015; 5: 133–144.
49. Bode´ nès C, Chancerel E, Ehrenmann F, Kremer A, Plomion C. High-density linkage mapping and distri-bution of segregation distortion regions in the oak genome. DNA Research 2016; 23: 115–124.https:// doi.org/10.1093/dnares/dsw001PMID:27013549
50. Yu B, Boyle K, Zhang W, Robinson SJ, Higgins E, Ehman L, et al. Multi-trait and multi-environment QTL analysis reveals the impact of seed colour on seed composition traits in Brassica napus. Mol Breeding 2016; 36: 111.https://doi.org/10.1007/s11032-016-0521-8
51. Webb A, Cottage A, Wood T, Khamassi K, Hobbs D, Gostkiewicz K, et al. A SNP-based consensus genetic map for synteny-based trait targeting in faba bean (Vicia faba L.). Plant Biotechnology 2015; 14: 177–185.
52. Dellaporta SL, Wood J, Hicks JB. A plant DNA minipreparation: version II. Plant Mol Biol Rep 1983; 1: 19–21.
53. Van Ooijen JW. JoinMap 4. Software for the Calculation of Genetic Linkage Maps in Experimental Pop-ulations. Kyazma BV, Wageningen, The Netherlands. 2006.
54. Voorrips RE. MapChart: software for the graphical presentation of linkage maps and QTLs. J. Hered. 2002; 93: 77–78. PMID:12011185
55. Verde I, Jenkins J, Dondini L, Micali S, Pagliarani G, Vendramin E, et al. The Peach v2.0 release: high-resolution linkage mapping and deep resequencing improve chromosome-scale assembly and contigu-ity. BMC Genomics 2017; 18: 225.https://doi.org/10.1186/s12864-017-3606-9PMID:28284188 56. Donoso JM, Eduardo I, Picañol R, Batlle I, Howad W, Aranzana MJ, et al. High-density mapping
sug-gests cytoplasmic male sterility with two restorer genes in almond×peach progenies. Hortic Res 2015; 2: 15016.https://doi.org/10.1038/hortres.2015.16PMID:26504569
57. Zambrano-Bigiarini, M. hzambran/hydroGOF: v0.3–10: CITATION change (Version v0.3–10). Zenodo 2017;https://doi.org/10.5281/zenodo.840087
58. Abdelghafar A, Reighard G, Gasic K. Antioxidant capacity and bioactive compounds accumulation in modern peach breeding germplasm. J Am Pomo Soc 2018; 72(1):40–69.
59. Dirlewanger E, Graziano E, Joobeur T, Garriga-Caldere´ F, Cosson P, Howad W. Comparative mapping and marker-assisted selection in Rosaceae fruit crops. Proc Natl Acad. Sci. 2004; 101: 9891–9896.
https://doi.org/10.1073/pnas.0307937101PMID:15159547
60. International Peach Genome Initiative. The high-quality draft genome of peach (Prunus persica) identi-fies unique patterns of genetic diversity, domestication and genome evolution. Nat Genet 2013; 45: 487–494.https://doi.org/10.1038/ng.2586PMID:23525075
61. Endelman JB. New algorithm improves fine structure of the barley consensus SNP map. BMC Geno-mics 2011; 12: 407.https://doi.org/10.1186/1471-2164-12-407PMID:21831315
![Fig 3. Peach consensus linkage map built using four previously published bi-parental linkage maps, PI91459(‘NJ Weeping’) × ‘Bounty’ (WB) [18], ‘O’Henry’ × ‘Clayton’ (OC) [19], ‘Venus’ × ‘Venus’ (VxV) [20] and ‘Texas’ ×](https://thumb-us.123doks.com/thumbv2/123dok_us/9028117.2800686/11.918.50.872.847.1039/consensus-linkage-previously-published-parental-linkage-weeping-clayton.webp)
