Calhoun: The NPS Institutional Archive
Theses and Dissertations Thesis Collection
2004-03
Distributed team collaboration in a
computer mediated task
Halin, Amy L.
Monterey, California. Naval Postgraduate School
NAVAL
POSTGRADUATE
MONTEREY, CALIFORNIA
THESIS
Approved for public release; distribution is unlimited
SCHOOL
DISTRIBUTED TEAM COLLABORATION IN A
COMPUTER MEDIATED TASK
by
Amy L. Halin
March 2004
Thesis Advisor:
Rudolph P. Darken
i
REPORT DOCUMENTATION PAGE Form Approved OMB No. 0704-0188
Public reporting burden for this collection of information is estimated to average 1 hour per response, including the time for reviewing instruction, searching existing data sources, gathering and maintaining the data needed, and completing and reviewing the collection of information. Send comments regarding this burden estimate or any other aspect of this collection of information, including suggestions for reducing this burden, to Washington headquarters Services, Directorate for Information Operations and Reports, 1215 Jefferson Davis Highway, Suite 1204, Arlington, VA 22202-4302, and to the Office of Management and Budget, Paperwork Reduction Project (0704-0188) Washington DC 20503.
1. AGENCY USE ONLY (Leave blank) 2. REPORT DATE March 2004
3. REPORT TYPE AND DATES COVERED
Master’s Thesis
4. TITLE AND SUBTITLE:
Distributed Team Collaboration in a Computer Mediated Task
6. AUTHOR(S) Halin, Amy L.
5. FUNDING NUMBERS
7. PERFORMING ORGANIZATION NAME(S) AND ADDRESS(ES)
Naval Postgraduate School Monterey, CA 93943-5000
8. PERFORMING ORGANIZATION REPORT NUMBER
9. SPONSORING / MONITORING AGENCY NAME(S) AND ADDRESS(ES)
N/A
10. SPONSORING / MONITORING AGENCY REPORT NUMBER
11. SUPPLEMENTARY NOTES The views expressed in this thesis are those of the author and do not reflect the official policy or position of the Department of Defense or the U.S. Government.
12a. DISTRIBUTION / AVAILABILITY STATEMENT Approved for public release; distribution is unlimited
12b. DISTRIBUTION CODE
13. ABSTRACT (maximum 200 words)
Due to the rapid development of technology, many simple tasks can now be automated, leaving more difficult and cognitive tasks such as planning, decision making and design to teams. Technology also allows these teams to be distributed through time and space. While this is becoming more and more prevalent in the business world, distributed teams also exist in the military where the stresses are much different.
One of the key factors associated with collaboration in military teams is situational awareness. This research used a commercial command and control type video game to investigate the issues of collaboration and situational awareness. The amount of information subjects had access to was varied to see if there was a significant impact upon their level of situational awareness which was measured by the accuracy of maps that the subjects drew.
Results from this research may provide insight into how much information is needed by distributed teams and when they need it. Ideas for future research in this area have also been proposed.
15. NUMBER OF PAGES
187
14. SUBJECT TERMS Teams, Situational Awareness, Computer Based Environment
16. PRICE CODE 17. SECURITY CLASSIFICATION OF REPORT Unclassified 18. SECURITY CLASSIFICATION OF THIS PAGE Unclassified 19. SECURITY CLASSIFICATION OF ABSTRACT Unclassified 20. LIMITATION OF ABSTRACT UL
NSN 7540-01-280-5500 Standard Form 298 (Rev. 2-89) Prescribed by ANSI Std. 239-18-298-102
ii
iii
Approved for public release; distribution is unlimited
DISTRIBUTED TEAM COLLABORATION IN A COMPUTER MEDIATED
TASK
Amy L. Halin
Lieutenant Commander, United States Navy
B.A., University of Pennsylvania, 1993
Submitted in partial fulfillment of the
requirements for the degree of
MASTER OF SCIENCE IN MODELING, VIRTUAL ENVIRONMENTS, AND
SIMULATION
from the
NAVAL POSTGRADUATE SCHOOL
March 2004
Author: Amy
L.
Halin
Approved by:
Rudolph P. Darken
Thesis Advisor
Susan
G.
Hutchins
Co-Advisor
Rudolph P. Darken
iv
v
ABSTRACT
Due to the rapid development of technology, many simple tasks can now be
automated, leaving more difficult and cognitive tasks such as planning, decision making
and design to teams. Technology also allows these teams to be distributed through time
and space. While this is becoming more and more prevalent in the business world,
distributed teams also exist in the military where the stresses are much different.
One of the key factors associated with collaboration in military teams is
situational awareness. This research used a commercial command and control type video
game to investigate the issues of collaboration and situational awareness. The amount of
information subjects had access to was varied to see if there was a significant impact
upon their level of situational awareness which was measured by the accuracy of maps
that the subjects drew.
Results from this research may provide insight into how much information is
needed by distributed teams and when they need it. Ideas for future research in this area
have also been proposed.
vi
vii
TABLE OF CONTENTS
I.
INTRODUCTION...1
A.
MOTIVATION ...1
B.
PROBLEM STATEMENT ...3
C.
THESIS ORGANIZATION...3
II.
BACKGROUND ...5
A.
TEAMS ...5
1.
Definition ...5
2.
Team Tasks...6
3.
Teamwork...6
B.
SITUATIONAL AWARENESS ...7
1.
Definition ...7
2.
Contributors to SA...8
3.
Elements of SA ...8
4.
Factors Affecting SA...9
5.
Team SA...11
III.
APPROACH...15
A.
STARCRAFT® ...15
1.
Features...15
2.
Campaign Editor...19
B.
COMMUNICATION...19
C.
MAPS ...20
IV.
METHODOLOGY ...21
A.
PARTICIPANTS...21
B.
APPARATUS ...22
1.
Maps ...22
a.
Map 1 ...23
b.
Map 2 ...23
c.
Map 3 ...24
d.
Map 4 ...25
2.
Apparatus Layout ...26
C.
PROCEDURE ...27
V.
ANALYSIS ...31
A.
GAME SCORES ...31
B.
COMMUNICATIONS ...33
C.
SCREEN SHOTS VS. MAP COMPARISON ...34
1.
Data Generation ...34
2.
Statistical Analysis ...36
VI.
RESULTS AND DISCUSSION ...43
viii
1.
Distribution...43
2.
Shared Vision ...43
B.
INDIVIDUAL VS. TEAM PLAY...44
VII.
CONCLUSION ...45
A.
EXPERIMENT DISCUSSIONS...45
1.
StarCraft®...45
2.
Maps ...45
3.
Treatment Effects...46
B.
FUTURE WORK ...46
APPENDIX A. LIST OF TRIGGERS APPLIED TO MAPS...49
A.
COMPUTER TRIGGERS ...49
B.
ALLIED TRIGGERS ...50
C.
TRIGGERS FOR ALL PLAYERS ...51
APPENDIX B. DEMOGRAPHICS QUESTIONNAIRE FOR PARTICIPANTS ...53
APPENDIX C. SCRIPT FOR EXPERIMENT...55
APPENDIX D. IN-STUDY QUESTIONNAIRE FOR PARTICIPANTS ...57
APPENDIX E. GAME SCORES...61
APPENDIX F. STATISTICAL COMPUTATIONAL FORMULAS ...63
APPENDIX G. EXPERIMENT TRANSCRIPTS ...67
APPENDIX H. SCREEN VS MAP COMPARISON DATA ...163
LIST OF REFERENCES ...167
BIBLIOGRAPHY ...169
ix
LIST OF FIGURES
Figure 1.
Relationship Between Individual and Team SA ...12
Figure 2.
Example of Screen at Beginning of Play ...16
Figure 3.
Mini-map Display Showing “Fog of War” ...17
Figure 4.
Display Showing “Shrouded” Area in Main Screen...17
Figure 5.
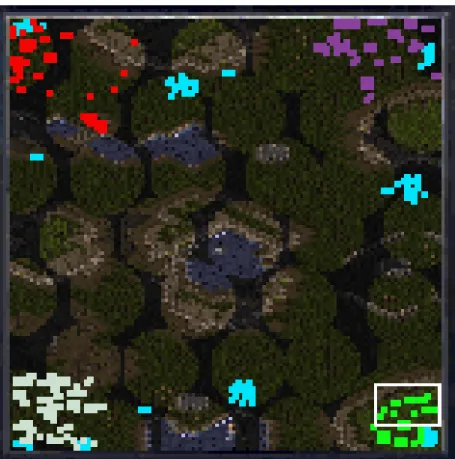
Screenshot of Multiplayer Game with Shared Vision On ...18
Figure 6.
Map 1 ...23
Figure 7.
Map 2 ...24
Figure 8.
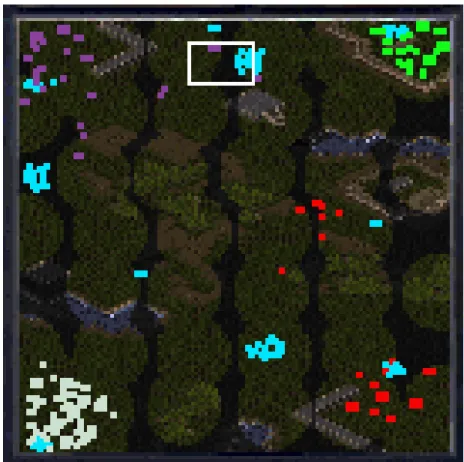
Map 3 ...25
Figure 9.
Map 4 ...26
Figure 10.
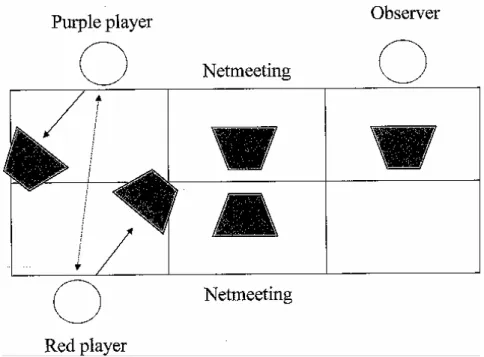
Experiment Set-up ...27
Figure 11.
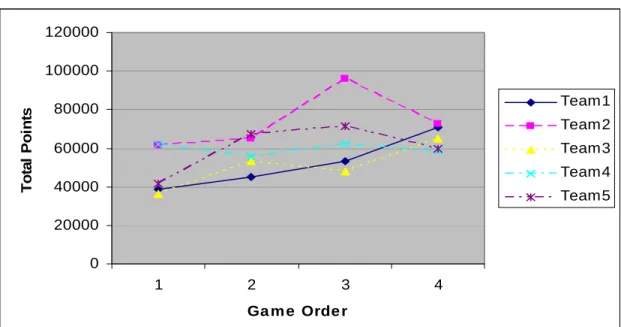
Performance by Game Order ...31
Figure 12.
Performance by Map...33
Figure 13.
Example of Map Comparison and Scoring...35
Figure 14.
Display of Computer Triggers ...49
Figure 15.
Display of Allied Triggers ...50
x
xi
LIST OF TABLES
Table 1.
Summary Table for the Analysis of Variance by Game Order...32
Table 2.
Summary Table for the Analysis of Variance by Map ...33
Table 3.
Individual Scores, Uncovered Features, 20 Minutes Left...37
Table 4.
Individual Scores, Drawn Features, 20 Minutes Left ...37
Table 5.
Individual Scores, Uncovered Features, 10 Minutes Left...38
Table 6.
Individual Scores, Drawn Features, 10 Minutes Left ...38
Table 7.
Individual Scores, Uncovered Features, Game End ...38
Table 8.
Individual Scores, Drawn Features, Game End ...39
Table 9.
Team Scores, Uncovered Features, 20 Minutes Left...39
Table 10.
Team Scores, Drawn Features, 20 Minutes Left...39
Table 11.
Team Scores, Uncovered Features, 10 Minutes Left...40
Table 12.
Team Scores, Drawn Features, 10 Minutes Left...40
Table 13.
Team Scores, Uncovered Features, Game End...40
Table 14.
Team Scores, Drawn Features, Game End ...41
Table 15.
Scores for Games 1 and 2 ...61
Table 16.
Scores for Games 3 and 4 ...62
Table 17.
Summary Table for Analysis of Variance with Formulas ...64
Table 18.
Summary Table for Two-Factor Analysis of Unweighted Means...66
Table 19.
Individual Data with 20 Minutes Left...163
Table 20.
Individual Data with 10 Minutes Left...164
Table 21.
Individual Data at Game End...164
Table 22.
Team Data with 20 Minutes Left ...165
Table 23.
Team Data with 10 Minutes Left ...165
xii
xiii
ACKNOWLEDGMENTS
I would like to acknowledge Dr. C.A.P. Smith and LCDR Dylan Schmorrow,
USN, for their original idea of using StarCraft® to investigate distributed collaboration in
a multi-tasking environment. Thank you.
I would like to thank Dr. Rudy Darken and Susan Hutchins for their support and
patience.
Lastly, I would like to thank my parents, Victor and Patricia Halin, and my
brother, Eric, and his wife, Jaime, for their love and support through this process.
xiv
I. INTRODUCTION
A. MOTIVATION
Advances in technology have had a significant effect on the workplace. Where
once communications were conducted primarily by phone, letter, or in person, now email,
online chats, faxes, and video-teleconferencing can be added to the mix. These advances
in technology have not only affected the way people work, but also the type of work that
is required of humans. Simple, less cognitive tasks are being left more and more to
automated systems in many situations, while humans are required to perform more
complex, dynamic tasks such as planning, decision-making, process monitoring, and
design. Furthermore, because these types of tasks are more cognitively demanding, they
are often assigned to teams as opposed to being left to an individual (Cooke, Salas,
Cannon-Bowers and Stout, 2000). Teams are better able to handle complex tasks
because responsibilities and workload can be divided among the team members, and the
ideal team would have members with different areas of expertise. In the area of
acquisitions, for instance, an Integrated Product Team may have members from finance,
contracting, security, systems engineering, and Automated Information Systems. This
broader base of knowledge makes a team much more flexible when it comes to adapting
to and handling different situations more effectively. With resident expertise already
present on the team, problems can be dealt with more quickly and effectively when they
arise.
Another feature of teams is that they may be distributed through time and space.
No longer do team members have to be co-located in the same office or town; rather, they
can be in different countries and time zones and still work on projects together. As
technology becomes cheaper and more accessible and new products are developed, they
will be incorporated into team tasks in greater numbers. Businesses are now able to
employ people working from home due to the advent of the computer, fax machine,
email, and software that allows for video-teleconferencing or voice communication over
the Internet.
2
Business is not the only arena that employs distributed teams. The United States
Navy has often had distributed teams, even before the advent of the technological
advances in the world today. The Officer of the Deck of an aircraft carrier and the ship
that serves as its plane guard can be seen as a distributed team. Likewise, an operational
watch team located on a ship may need to collaborate and coordinate their actions with
watch teams located elsewhere on the ship, on different ships, and on shore. While both
the military and business world employ distributed teams, the circumstances under which
they operate are very different. Military operational situations often involve inherent
time constraints that may affect what strategies teams employ. Decisions need to be
made quickly on currently available information, and it may not be possible to wait
minutes, let alone hours, for more information. Communications – especially between
ships or between ship and shore – may be of lower quality, or not available at all, due to
bandwidth constraints. It is entirely possible that one part of a distributed team will have
access to information that the other team members do not have access to which could
help that subteam to maintain or improve situational awareness (SA). The information
could be key to helping the team understand the situation, which would enable them to
develop better goals and strategies to meet those goals. Probably the most significant
difference between military teams and those in the business world is that the military is
more likely to be involved in situations where making the right decision can mean life or
death. For all these reasons, it is important that the team members be able to work
together to reach a common goal and overcome any differences in information that may
exist.
Because military and business tasks occur in situations that are very diverse, it is
important to study teamwork in a military-type task to determine how members
collaborate and coordinate to meet a goal. A key element to the successful completion of
the task would be the team members’ understanding of the given situation and the task
that needs to be completed. For a military command and control type task, studying a
team’s level of situational awareness can provide important insight into how individual
members work together to meet a common goal.
B. PROBLEM
STATEMENT
The purpose of this thesis is to investigate teamwork within a simple military
command and control type of situation by studying two team members’ collaboration and
their level of SA. This study manipulated each team member’s access to information and
to the facial cues and body language of their partner in an attempt to measure the impact
of these two variables on the team members’ level of SA. It was anticipated that team
members will develop better SA when they have access to the same information as their
partner, and when they can see their partner. The results of this research may help in
understanding collaboration and the development of SA in a more complex, military-type
task.
C. THESIS
ORGANIZATION
Chapter II focuses on background and previous work on teams, teamwork, and
situation awareness. Chapter III delineates the approach to studying teamwork in a
distributed task. Chapter IV describes the methodology used for the experiment,
including the design, and issues associated with the set-up and implementation of the
experiment. Chapter V covers the analysis of the data, and Chapter VI provides the
results and discussion. Chapter VII is the conclusion and includes a critique of the
experiment and suggestions for future work.
4
II. BACKGROUND
A. TEAMS
1. Definition
It is important to distinguish the difference between a team and a group of
individuals. Salas, Dickinson, Converse, and Tannenbaum (1992) proposed a definition
for a team that is widely quoted throughout the literature:
[A team is] a distinguishable set of two or more people who interact
dynamically, interdependently, and adaptively toward a common and
valued goal/objective/mission, who have each been assigned specific roles
or functions to perform, and who have a limited life-span of membership.
Another definition found in the literature defines a team as:
A group of two or more individuals who must interact cooperatively and
adaptively in purpose of shared value objectives. Further, team members
have clearly defined differentiated roles and responsibilities, hold
task-relevant knowledge, and are interdependent (i.e., must rely on one another
in order to accomplish goals) (Cannon-Bowers, Salas and Converse,
1993).
Key differences between a group and a team are highlighted in these definitions.
A group is simply two or more individuals who may have something in common. Teams,
however, are groups with special distinctions: they share a common purpose, common
understanding, and commitment to a goal. (Fisher and Fisher, 1998) Both definitions
include the fact that team members work together to achieve a common goal that they
have a vested interest in. Furthermore, both definitions mention that members are
interdependent: the actions of each team member can have an effect on other members
and their actions. Both definitions also highlight the ability of teams to adapt: teams can
adapt to new situations more readily than individuals due to their pooled resources (Salas,
Cannon-Bowers, Payne, Smith-Jentsch, 1998). The fact that team members have
different roles and responsibilities allows them to handle the more cognitively
challenging tasks that are too demanding for one person alone (Cooke, Salas,
Cannon-Bowers and Stout, 2000).
6
2. Team
Tasks
Teams can often be differentiated by the types of tasks that they are assigned to
perform. Teams are required to engage in complex situations such as flying planes,
firefighting, military command and control, and surgery to name a few (Cannon-Bowers,
Salas and Converse, 1993). These situations are often characterized by “severe time
pressure; complex, multicomponent decision tasks; rapidly evolving and changing
information; high short-term memory demands; and high information ambiguity” (Ibid.).
Team tasks require members to exchange information and resources, coordinate with
each other, and adjust dynamically to the given situation (Salas, Dickinson, Converse and
Tannenbaum, 1992).
When teams are distributed, tasks can become more complex. For instance, an
already cognitively demanding task such as system design is made more complex when
team members are separated by time and distance. Communications may not be
real-time; therefore, there may be a period of days or weeks between a mistake being made
and then being corrected. When teams are distributed, it may also take longer to come to
a consensus; it is much easier to hold a meeting when everyone is in the same location.
While technology provides very good communications, there may be some concern that
the facial expressions and body language that people can observe when face-to-face are
lost over electronic communications (Palmer, Gentner, Cameron and Soest, 1997).
People cannot observe facial expressions and body language, or hear vocal intonations
that may reveal stress, deceit, or hesitation by reading emails or participating in real-time
chats. Video-teleconferencing may solve this problem to a degree, but it is dependent on
the quality of the connection.
3. Teamwork
As mentioned previously, teamwork is needed to accomplish many complex
tasks. Teamwork “can be thought of as an identifiable set of behaviors, cognitions, and
attitudes that contribute to the team’s overall functioning.” (Stout, Cannon-Bowers and
Salas, 1996) However, many disasters have been attributed to the breakdown of
teamwork: Three Mile Island, the USS Vincennes incident, and airplane crashes are a few
examples (Stout, Cannon-Bowers, Salas and Milanovich, 1999). In a study of military
command and control teams by McIntyre and Salas the following behaviors were noted
as characteristic of high-performing teams: “performance monitoring, giving and
receiving feedback, closed-loop communication, backing-up behaviors,
adaptability/flexibility, and coordination of action.” (Stout, Cannon-Bowers and Salas,
1996)
From the definitions of teams and teamwork seen throughout the literature,
collaboration and communication are very important to successful teams. Collaboration
is defined as “a coordinated, synchronous activity that is the result of a continued attempt
to construct and maintain a shared conception of a problem.” (Baker, Hansen, Joiner and
Traum, 1999) Collaboration and communication among team members can occur
real-time (i.e., using meetings, telephone conversations, text chats, voice over IP, or
video-teleconferencing) to discuss an ongoing project or in a “delayed” fashion (i.e., using
emails, letters, or faxes) to forward projects to team members for them to work on
separately to be combined at a later date. This “delayed” collaboration could also be
taken to mean that individual team members are only concerned with their phase of a
project and at a later date, parts of the project will be combined into a whole. Delayed
collaboration can cause additional problems that may affect the team, for example, if
team members do not maintain fairly close contact, one member or subteam may stray
too far from the original goal. This can lead to wasted time and effort while the team
works to get back on track.
B. SITUATIONAL
AWARENESS
1. Definition
Perhaps the simplest definition of situation awareness (SA) is that it is “knowing
what is going on around you” (Endsley, 2000). According to Charness (1995), SA is a
“default” construct; that is to say, it is easier to know what it is when it is missing.
However, SA is a complex concept and actually deserves a more explicit definition.
Endsley defines SA as “the perception of the elements in the environment within a
volume of time and space, the comprehension of their meaning, and the projection of
their status in the near future.” (1997) This definition can be broken down further into
the three levels of SA: perception, comprehension, and projection. (Endsley, 2000)
8
•
Level I: perception of information and cues in the environment. This first step
is crucial. If information in the environment is missed or perceived
incorrectly, it can affect the further development of SA, because everything
builds upon this key step.
•
Level II: comprehension of Level I data. Information gathered in the previous
level is combined, interpreted, stored and retained.
•
Level III: projection. Future events, actions, and needs are predicted. The
better the grasp of the situation, the more likely this is to be displayed.
Reaching this level is also dependent on having attained Level I and Level II
SA.
2.
Contributors to SA
Many elements contribute to developing one’s SA. External cues from the
environment such as the alarms and lights on display panels contribute information by
focusing one’s attention on a certain aspect of the situation, or by providing information
that can be used to update or confirm one’s idea of what is going on (Pew, 1995). In
different situations, such as firefighting, other sensory cues such as smell, taste, or touch
can contribute to one’s development of SA. Sensory cues can be thought of as overt, as
in alarms, or subtle, as in changes in temperature, motion, etc. (Endsley, 2000) Decision
aids and decision support systems can enhance SA by guiding one’s analysis of the
situation and thereby leading one to a better level of SA. Communication among team
members, as well as communication between the team and outside organizations, can also
contribute to developing an individual’s SA (Pew, 1995). Voice communications can add
not only content that may affect one’s SA, but also the listener may catch inflections in
speech indicating doubt, stress, nervousness, etc. that can also contribute. Furthermore,
people also use others to confirm their own level of SA, such as, “I think this is what is
happening. Do you agree?” or “What do you think is going on?” (Endsley, 2000) Each
member’s background knowledge and experience level also contributes to the
development of SA. (Pew, 1995)
3.
Elements of SA
While SA may simply be “knowing what is going on around you,” what
specifically is it that individuals are concerned about regarding SA? The following
elements are the “what” referenced in the quotes above (Pew, 1995):
•
Spatial awareness
•
Mission and goal awareness
•
System awareness
•
Resource awareness
•
Crew awareness
Spatial awareness is the awareness one has of where they are located within the
environment, and where they are located relative to others. Mission and goal awareness
is concerned with keeping current on what needs to be done and what the current goal is.
As the situation develops and conditions change, goals may change or be superseded by
other, previously lower-priority goals. Members need to be aware of individual goals and
subtasks under those goals, etc., so that they can work towards meeting them and thus
accomplishing the mission. System awareness pertains to one’s knowledge of the
system, requirements for the system, how different parts of the system interact with each
other, or how the system fits into the larger picture. The system may be technological,
but does not have to be, for example, the “system” can refer to how different offices work
together, etc. System awareness is more important in complex, highly automated
systems. Resource awareness refers to one’s ability to keep track of human and material
resources available. Not only does this mean knowing if someone is available, but also if
they are qualified or able to perform tasks. Crew awareness is the need for crew
members to share information and interpretations among themselves. This crew
awareness can lead to a commonly held picture of what is going on and what needs to be
done. (Pew, 1995)
4.
Factors Affecting SA
SA can be affected by many different factors both personal and operational
(Endsley, 1997). Information processing limitations and coping mechanisms were
identified as personal factors affecting pilots’ SA, but they are not limited only to
aviation. These factors can have an effect on the development of SA in many other
situations (Ibid). Processing limitations pertain to attention and working memory. What
information, and how that information is processed, is determined by one’s attention
10
(Endsley, 2000). Attention is limited, however, and situations that involve multitasking,
complex tasks, and information overload can all affect an individual’s information
processing capacity, such as causing something to be overlooked inadvertently or
consciously (i.e., “I don’t have time to look at that now, I’ll come back to it later.”)
(Endsley, 1997) A person’s working memory also has a limited capacity for processing
information, and situations characterized by complex tasks, large amounts of information,
or that require multitasking, may affect a person’s ability to process information.
(Endsley, 1997; Endsley, 2000) These factors can be seen as directly affecting Level I
and Level II SA, thus indirectly affecting Level III SA.
Coping mechanisms that may affect SA are mental models, goal-driven
processing, and automaticity (Endsley, 1997). Mental models can be used by individuals
to compensate for limitations in attention and working memory because information in
long-term memory is stored in the mental model (Ibid; Endsley, 2000). SA can be
described as the current state of the mental model; however, mental models may also
cause biases that can adversely affect SA (Endsley, 2000). If a mental model has been
developed for a given situation, a person may take information at face value because it
fits the mental model when actually the situation may be quite different. For example, a
watchstander may expect to see a message announcing the beginning of a training
exercise because he/she always has seen it in the past. But one day, the training exercise
occurs without a message being sent (or the message is missed). The watchstander may
assume incorrectly that the event is “live” because his/her mental model says that a
message is always sent if the event is an exercise. Goal-driven processing (or top-down
processing) may affect SA because the environment is monitored in accordance with the
current goals: only information relevant to current goals is perceived (Endsley, 1997;
Endsley, 2000). Thus, information may be missed that would otherwise change an
individual’s SA, or even more importantly, result in new goals being created.
Automaticity occurs when routine or repeated actions become automatic. This can save
on attention demands; however, this can adversely affect SA because individuals will not
be receptive to new cues. (Endsley, 1997) These factors directly affect Level I SA and
indirectly affect Levels II and III.
Operational factors affecting SA are stress, workload, system design, complexity,
and automation (Endsley, 1997). Stress can be both physical and social/psychological,
and under stressful conditions, an individual’s attention, information intake and working
memory capacity may all be adversely affected (Ibid). High workload can affect
individuals’ SA in much the same way stress can, and interestingly, low workload can
also affect SA because individuals may become too relaxed and thus miss information or
new stimuli (Ibid). System design relates to the ability to acquire and display information
(Ibid). Poor designs can cause critical information to be overlooked. Complexity in the
system can affect mental workload: the individual may need time to develop a mental
model for the situation, system, etc. in order to perform well (Ibid). Finally, automation
can affect SA by essentially removing the individual from the loop, so they may not be
aware of everything that is going on. (Endsley, 1997; Endsley, 2000)
5. Team
SA
Many researchers agree that team SA does not simply equal the sum of the
individual team members’ SA. Endsley proposed that team SA is a function of each
individual’s SA and the overlap between them (Salas, Prince, Baker and Shrestha, 1995).
Prince, Salas, Bowers and Jentsch (1995) defined team SA as individual SA plus team
processes within the context of the task. Schwarz maintains that team SA is related to the
level and quality of communication among the team members (Salas, Prince, Baker and
Shrestha, 1995). Wellens defined team SA as “the sharing of a common perspective
between two or more individuals regarding current environmental events, their meaning,
and projected future status.” (1993) Figure 1 is a representation of the relationship
between individual and team SA. Diagrams of two or more intersecting circles have been
used in the literature to represent the relationship between individual and team SA
(Endsley, 1995; Stout, Cannon-Bowers and Salas, 1996). In Figure 1, the circles
represent an individual’s SA: what is believed to be the true state of a situation at a given
point in time. The ellipses represent what an individual has contributed to team SA. The
individual’s contribution can be affected by the other team members’ understanding of
the situation; therefore, there can be a delta between what an individual believes he
contributes and what actually contributes to team SA. What is important to remember is
that team SA will not necessarily equal the sum of the individual SA’s; not all of an
individual team member’s SA information may make it to the team level of SA, or
information may be skewed or misunderstood.
Figure 1.
Relationship Between Individual and Team SA
Individual SA Individual SA Individual SATeam SA
Environment
Key among all these definitions is the importance of communication. Not only
must each person maintain their own SA, but they must now coordinate and share
information among themselves because all members need access to information in order
to develop expectations about the task that is being performed (Salas, Prince, Baker and
Shrestha, 1995). Team members are dependent on communication about goals, tasks,
and capabilities, and communications may help overcome any differences or deficiencies
in an individual’s own mental model of the situation which is stored in long-term
memory. As an individual updates his/her own SA, this will then feed back into the
team’s SA. If team members communicate well among themselves, the team SA should
be very good. (Ibid.)
Ideally, the greater the team’s SA, the more coordination and task performance
would be exhibited by individuals on the team (Wellens, 1993). Also, a proportional
relationship should exist between individual members’ SA and the SA of the team: if
each member of the team has good SA, and can perform their tasks, then the SA of the
team should be fairly good as well (Ruffner, Tullos and Muldoon, 1997). The impact the
situation has on team SA should not be overlooked. The situation and environment can
drive the actions of team members and to some extent determine their actions as well as
what information they will be seeking from the environment and from other team
members (Salas, Prince, Baker and Shrestha, 1995).
14
III. APPROACH
A. STARCRAFT®
1. Features
The original idea to use StarCraft® to investigate distributed collaboration in a
multi-tasking environment was proposed by Dr. C.A.P. Smith, Colorado State University
(formerly of SPAWAR Systems Center San Diego) and LCDR Dylan Schmorrow, USN.
StarCraft®, created by Blizzard Entertainment, is a real-time strategy game for single or
multiple (up to eight) players that can be played over a direct connection, modem, LAN
or the Internet. Players are in charge of forces and buildings, must research technologies,
gather two types of resources (minerals and vespene gas), and conduct missions with
various goals that are dependent on the scenario being played. The game was considered
an appropriate venue for studying situations involving multitasking, decision-making,
and situation awareness in single player games and can be used to study team interactions
in multiplayer games. StarCraft® games share many characteristics with situations that
researchers are interested in studying: time stress, personal consequences of actions,
dynamic environments, dynamically updating information, and changing and/or
competing goals, to name a few.
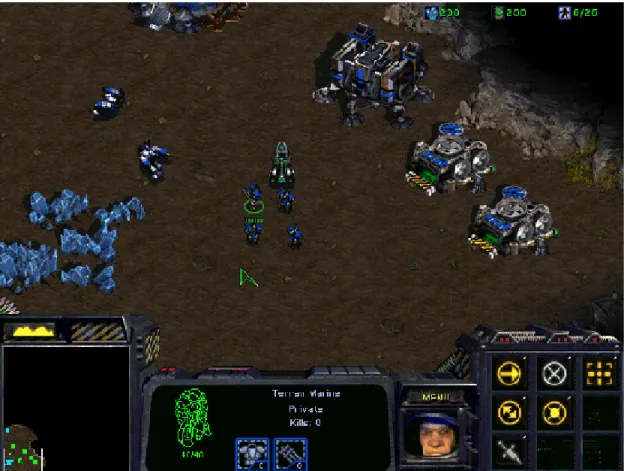
Figure 2 is an example of what a player may see at the beginning of a single
player game. Along the bottom of the screen are three displays. The display to the left is
the mini-map. In it, the player has a top-down view of the entire environment in which
the game is being played. Own forces and buildings (green squares), resources (light
blue), enemy forces and buildings (other colors), and terrain are all represented in the
mini-map (the button to the left above the mini-map toggles terrain on and off). The
white box within the mini-map shows what portion of the map is displayed in the main
part of the screen. By clicking and dragging the mouse, a player can scan over the map,
or the player can simply click the mouse to move to an area quickly.
Figure 2.
Example of Screen at Beginning of Play
The status display in the bottom middle of the screen shows the health status and
statistics of a selected unit or units. If one unit is selected, it also states what the unit is,
(i.e., Terran Marine, Terran Command Center, etc.) its rank and number of kills (if
applicable). Immediately to the right is a portrait (i.e., video display) of the selected unit,
and in the bottom right corner is a command panel that the player uses to order units to
build structures, gather resources, attack, hold their position, etc. In the upper right
corner, the amount of resources available is displayed along with a ratio of supplies
used/total supplies. Thus, a player can see if he/she has enough resources available for
upgrades, building structures, or training forces, and how many units can be built.
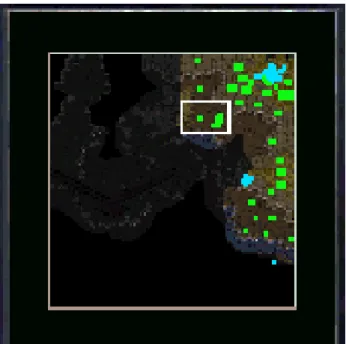
StarCraf
ent
igure 3 is an
enlargement of the mini-map area showing the fog of war. All areas where friendly
forces a
t® implem
s a feature called the “fog of war.” F
re stationed show up clearly on the mini-map. Areas that have not been explored
yet are black. Areas that have been explored, but where no friendly forces are currently
stationed, appear dark gray; units belonging to other players do not appear, but buildings
and terrain appear in their last known state.
Figure 3.
Mini-map Display Show
ing “Fog of War”
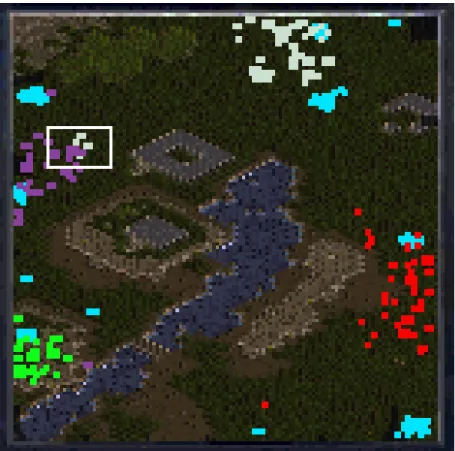
If the player moves the cursor back to one of these areas as in Figure 4, what
appeared the last time this area was viewed will be shown, but the player will not receive
an update for the area unless troops are returned to the area.
18
Three different races are available in the game for players to select (or fight
against
share v
w the other player to see everything that they can
see, bo
): Terran, Protoss, and Zerg. Each race has its own special capabilities, types of
structures, forces, etc. This adds another level of strategy to the game because players are
not necessarily playing against equally matched forces. Each one has its own strengths
and weaknesses, and players need to know how best to exploit those so that they may
win.
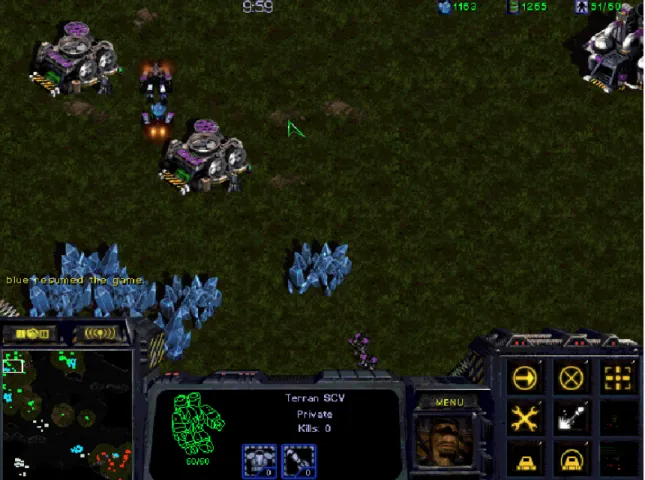
In multiplayer games, there are many additional features that can make game play
more complex. Players may become allies, thus allowing them to move forces freely
about the map without worrying about accidentally firing on friendly forces. In addition,
players can make use of a game feature called shared vision (Figure 5). When players
ision with one another, they allo
th in the mini-map and in the main screen.
Figure 5.
Screenshot of Multiplayer Game with Shared Vision On
In the multiplayer version of StarCraft®, there is no toggle feature for the terrain
in the mini-map. Instead, the buttons above the mini-map are for diplomacy (left button),
send text messages to each other. In the
mini-m
ers can be set at the beginning of the game, or can be
tions within the game. Thus, specified events can be “staged”
through
. Audio can be sent full duplex, thus allowing two people to
which allows players to set others as their allies and to share vision with them. The right
button is for messaging, allowing players to
ap in Figure 5, shared vision is turned on. The player in this game (purple) sees
himself represented as green squares. His ally (red) is represented by red squares, and the
computer opponent they are playing against is represented by white squares. Due to fog
of war some areas are shrouded, but the computer’s buildings and resources are still seen
on the mini-map even though the location of individual troops is not available.
2. Campaign
Editor
StarCraft® comes with a robust campaign editor to allow users to create their own
maps. Users can create maps based on desert, jungle, snow, and space platforms, for
example. They can create terrain features such as plateaus, cliffs, rivers, roads, bridges,
and structures. Features such as trees and neutral creatures can be added into the map for
variety. Maps can have up to eight players (human and computer). Properties, units,
upgrades, and special abilities can be set for each player. Players can further be broken
down into up to four forces, and allies can be hard-wired within the campaign editor.
A feature of the campaign editor that makes it so appealing is that “triggers” can
be built into the game. These trigg
tied to an event or ac
out the game. The campaign editor also allows various artificial intelligence
scripts to be set for the computer so it can be a very formidable enemy or toned down
somewhat to allow for longer play.
B. COMMUNICATION
Communication is very important in team activities. It is needed in order to share
ideas, strategies, and information. While StarCraft® has a text messaging capability, the
argument can be made that voice communication is more natural and less intrusive,
especially in stressful situations. There are many applications available to enable voice
communication over the Internet. Two that were investigated for this experiment were
Microsoft NetMeeting® and Roger Wilco™.
NetMeeting® has the capability to send both audio and video over the Internet
between two people
20
communicate freely without
short lag was noticed
between one person speaking and the other hearing it over the net, but this was judged to
etMeeting® could not be run on the same machine as
StarCraft® due to video resolution.
having to wait for each other. A
be minimal. Unfortunately, N
Roger Wilco™ is freeware that is downloadable from
http://rogerwilco.gamespy.com
. One advantage offered by Roger Wilco™ is that it
allows more than two people to communicate freely over the Internet. It has a full duplex
mode, so voice communications are more natural. Another feature of Roger Wilco™ is
that it can run in the background on the same computer as the game. Unfortunately, it
exhibited an even greater lag than NetMeeting®. When one pilot group tried using Roger
Wilco™ they were immediately turned off by the lag. The lag was judged to be great
enough that it might prove to be a distraction, so the decision was made to use
NetMeeting® for the experiment.
C. MAPS
The very nature of StarCraft® requires participants to explore a strange
environment; players start the game only knowing about a very small portion of the game
world and must explore it in order to find more resources, defeat the enemy, and meet up
with or rescue allies. Because players are exploring, an appropriate measure of what
players know could be represented by maps. The players see two different versions of
the environment while they play. The main screen provides a detailed close-up view of
the immediate vicinity around the player’s cursor, and the mini-map provides the view of
the entire battlespace (although in less detail). By moving through the environment,
players should come to have a mental representation of what comprises the battlespace,
including structures, enemy and friendly bases, terrain, etc. This map is constantly being
updated in accordance with information that the player discovers or that is provided by
the player’s partner.
IV. METHODOLOGY
A.
ogether for a task
collabo
d himself as a novice, one thought he was
betwee
PARTICIPANTS
Participants for the experiment were recruited from among the Naval
Postgraduate School officer-student population. The only restriction placed upon
participants was that they had to be native speakers of English. Some familiarity with the
StarCraft® game was required, thus participants who were not familiar with the game
were given time to practice the game on their own to develop familiarity with how the
game is played. Participants were randomly paired off into two-person teams for the
experiment. Participants were not tested on their ability to play StarCraft® before
starting the study other than making sure that they knew how to play. This study was not
meant to be an investigation into the differences between experts and novices, rather it
was conducted to investigate how two people who are paired t
rate in order to perform the task. This issue is relevant because in many military
situations, people may be paired together who do not know each other, and while both are
familiar with the task, they are not familiar with each other.
The ten participants were all male, with an average age of 32.3 years. Seven of
the participants were US Navy officers, one was a US Marine and two were civilians (one
of the civilians had prior service in the US Army). Participants had played
action/strategy games before, including StarCraft®, Warcraft, Half-Life™, Civilization®,
Age of Empires®, and Unreal® Tournament, and had played anywhere from 0.5 hours
per month to 2-3 hours per day. Five of the participants had played games with others,
four had played as a member of a team, and four had played over a LAN or the Internet.
Participants were asked to self-rank themselves on their game playing proficiency as it
related to other people; self-rankings ranged from “Novice/usually lose” to
“Expert/usually win.” One person ranke
n novice and average, three ranked themselves as average, two thought they were
above average, and one thought of himself as an expert compared to others.
22
he StarCraft® Campaign
Editor. Each m
28 units and used the Jungle World tileset with jungle
being the defa
ated as
allies; however, the Observer (Force 3) was not an ally. A copy of each map was made
with the Allies set to give each other shared vision. Both the allies’ condition and shared
vision condition can be set in the campaign editor for each map. By hard-wiring the
shared vision condition into the map, the participants would not have to waste time at the
beginning of the game setting allied status and shared vision.
Starting locations, buildings and units were supplied for all players so that they
would start the game with equal capability, and they would not have to spend time
gathering resources to build structures or units. Each player (human and computer) was
supplied with a command center, refinery, barracks, academy, two supply depots, four
Space Construction Vehicles (SCVs), ten marines, and five firebats (troops equipped with
flame-throwers). All players were set to receive 500 units each of the minerals and
vespene gas. Provision of resources was a trigger that was set within the campaign editor
to occur at the beginning of each game. A trigger was also applied to the computer
opponent so that it built and expanded its base and attacked any enemies it encountered
(otherwise, the computer would only have defe
lf). A trigger was also set to
prevent the computer and the subjects from killing all Observer units at the Observer
base. The len
also set by a trigger (see Appendix A for the trigger
GUIs).
iety and make the game more interesting. These
features were randomly scattered throughout the environment on all four maps. Several
additional pockets of resources were also scattered throughout each map. Additionally,
B. APPARATUS
1. Maps
Four maps were designed for the experiment using t
ap measured 128x1
ult for the map. Three forces were created for the maps, and they were all
designated as Terrans: Force 1 (Allies) consisted of the two participants (Red and
Purple); Force 2 (Computer) was the opponent (White); and Force 3 (Observer) was for
the human observer (Blue). The two participants in Force 1 were always design
nded itse
gth of the game was
Terrain features (plateaus, rivers, lakes, bridges, temple structures and ruins) were
built into the maps to provide some var
map reveale
ted”; thus, the
any area in the m
mi
.
re 6.
Map 1
b. Map
2
Map 2 (Figure 7) contains the following features: four buildings, three
plateaus (high jungle), one river, 15 resources (eight gas geysers and seven mineral
deposits) and one area of raised jungle.
rs were added for the observer, and the fog of war was “lif
observer could watch participants’ actions on the mini-maps and could quickly look at
ain screen by moving and clicking the mouse.
a. Map
1
Map 1 (Figure 6) contains the following features: four buildings, four
plateaus (high jungle), one area of water, 17 resources (nine gas geysers and eight
neral deposits), and two areas of raised jungle. These areas of raised jungle, while not
as high as a plateau, are impassable and players are forced to walk around them
Figure 7.
Map 2
c. Map
3
24
re cause by the map revealers. The
revealers were not placed close enough together, thus resulting in the shrouded areas
outside the revealers’ coverage areas.
Map 3 (Figure 8) contains the following features: three buildings, one of
which is surrounded by four walls, five plateaus (high jungle), three areas of water (one
river, a lake in the middle of the map, and a pool of water at the bottom of the map), 15
resources (eight gas geysers and seven mineral deposits), and three areas of raised jungle.
The circular areas where the map is not shrouded a
Figure 8.
Map 3
d. Map
4
Map 4 (Figure 9) contains the following features: three buildings, two
V-shaped walls, two plateaus (high jungle), three sources of water (two rivers and a pool at
bottom center), 14 resources (seven gas geysers and seven mineral deposits), six areas of
raised jungle in three groupings. As in Map 3, the map revealers were not placed close
enough to each other; this did not affect game play.
Figure 9.
Map 4
2. Apparatus
Layout
StarCraft® (v.1.05) was installed on three computers (one for each participant in
the study and one for the researcher). As shown in Figure 10, the participants sat facing
each other, with their monitors offset so that eye contact could be made. Communication
took place over the Microsoft NetMeeting® software that was installed onto two
computers that sat beside the participants (one computer ran v.2.11 while the other ran
v.3.01). The observer watched on a third computer that sat at the end of the row of desks.
Figure 10.
Experiment Set-up
Communications needed to be constant across all conditions, thus headphones and
NetMeeting® were used in all trials. Participants wore headsets with boom microphones
during each trial in the experiment. There were several reasons for this: (1) to prevent
distractions from outside noise and minimize any interference caused by the experiment
being condu
would start in the
afternoon and run into the early evening. When participants arrived to participate in the
experiment, they filled out consent forms and a demographic questionnaire (contained in
cted in an open lab, and (2) for the distributed condition, using headsets
helped the players to hear each other when a barrier was erected between the players to
prevent eye contact. Use of NetMeeting® eliminated any unintended effects on the
ability to hear voice communications. The connections were made as follows: one cable
was run from both the NetMeeting® CPU and the StarCraft® CPU into a Y-coupler
which the headphone speaker jack was then plugged into (the headphone microphone was
plugged into a cable which then was plugged into the NetMeeting® CPU microphone
jack). Thus, players could hear both the voice communications and the sound from the
game.
C. PROCEDURE
The experiments were run in February and March of 2001 in the MOVES Lab in
Spanagel Hall at the Naval Postgraduate School. The experiments
28
Append
s prevented by erecting a barrier between the players, and for two games
shared
, 576 different combinations were possible for the
experiment. To lessen the effect of interaction between a map and treatment condition,
each pair of participants was randomly assigned a map order and a treatment condition
order.
Participants played four games that ran 30 minutes each. At ten minute intervals,
the observer paused the game, and the participants were asked to draw a map from
memory and answer a questionnaire (see Appendix D) that covered the ten minute block
that had just been played. At the first pause, the players drew the map from “scratch”.
At the second pause and at the end of the game, players only needed to update their maps.
The maps were drawn using whiteboards and four colored markers (red, green, blue, and
black). A square area for participants to draw in was marked out (the whiteboards were
rectangular in shape), and participants were not held to a specific color scheme. During
these periods, participants were not allowed to talk with each other or look at each other’s
maps. Monitors were also turned off during this time. A maximum of ten minutes was
allotted for this portion of the experiment. After participants were finished, the maps
were put aside, and gameplay resumed. Participants and the observer all took a screen
capture at this time for later comparison to the maps that were drawn.
ix B). A script was then read to participants (see Appendix C), to explain details
of the experiment. Participants played as a team against the computer opponent; however
each player controlled their own forces. The goals for the participants were to stay alive
for the full 30 minutes and to explore as much of the environment as they could in that
time.
Two independent variables were manipulated in the experiment: shared vision and
distribution (whether team members could make eye contact or not). For two games, eye
contact wa
vision was turned on. Therefore, the four treatment conditions were: no barrier/no
shared vision (NSV); barrier/no shared vision (DNSV); no barrier/shared vision (SV);
and barrier/shared vision (DSV). In order to prevent practice effects, each game was
played on a different map. There are 24 different possibilities for both map order and
treatment condition order; therefore
articipants were allowed to communicate freely while the game was in play. All
communications were recorded using a lapel microphone that was secured on the desk
between the players. When the barrier was up, the microphone was placed in a hole that
was cut out thus enabling clear recording. When the 30-minute timer in the game ran out,
the last round of screen captures was taken, the observer stopped the game, the maps
were updated, and the questionnaires were filled out again. Participants were allowed
short breaks between games, but no discussion of the game or experiment was allowed at
this tim .
he following data was collected during each trial: voice communications, digital
photos of each of the maps, and screenshots of each player’s screen at the ten-minute
pauses. StarCraft® provides numerical scores at the end of each game for units,
resources, and structures. This data was collected and transferred into a Microsoft
Excel® database (see Appendix E).
P
e
T
30
V. ANALYSIS
A. GAME
SCORES
en peopl
uter game
hey often
e at th
s a
measure of how well they played the game. While the game score was not directly
related to the resear
in that th
e itself
ator of situational
awareness), the game score could be used to determine if there were any learning effects
or differences in the degree of difficulty be
aps. Appendix E contains the game
scores
laye
ls for
red and
Wh
e play comp
s t
use the scor
e end a
ch question (
e scor
is not an indic
tween m
for each p
r (including the computer opponent). Only the individual tota
purple were used in the following calculations.
First, an analysis of variance was performed to determine if there was an effect
caused by game order (i.e., the null hypothesis being tested was that there was no
difference between the games). Figure 11 is a graph of the teams’ performance by game
order.
0 20000 40000 120000 60000 80000 100000 l P o in ts 1 2 3 4 Ga m e Orde r Tot a Team1 Team2 Team3 Team4 Team5Figure 11.
Performance by Game Order
Sums for the game totals were as follows: A
G1= 239305; A
G2= 286011; A
G3=
330751; and A
G4= 326990. The number of observations for each game was n = 10.
32
this experiment. Using equations (1) through (11), the following summary table for the
Single Factor Analysis of Variance (ANOVA) was produced:
Source SS
df MS
F
A 548189290 3 182729763.3
2.0148
S/A 3265046830 36 90695745.28
Total 3813236120 39
Table 1.
Summary Table for the Analysis of Variance by Game Order
Assuming a significance level of
α =
0.05, we can use a table of Critical Values
of the F Distribution (F ta
mi
he value for F
(3, 40)). The
null hypothesis would only be rejected if F
observedwas greater than or equal to 2.84.
Becaus
squared is determined to be equal to 0.070.
Therefore, seven percent of the variance is due to the game o
xt, the gam
re studied
r each ma
ne if the
any
difference in difficulty among the maps. Figure 12 is a graph of the teams’ performance
by ma
oking at
appears th
ap 3 ma
the other
aps.
ble) to deter
ne that F
(3,36)= 2.84 (t
e it is not, the null hypothesis cannot be rejected; therefore, it appears that the
game order did not have an effect on the experiment results.
By using equation (12), omega
rder.
Ne
e scores we
fo
p to determi
re was
0 20000 1 2 3 4 Ma p Num be r 40000 60000 80000 100000 120000 Tot a l P o in ts Team1 Team2 Team3 Team4 Team5