In recent years, many learning analytics dashboards have been deployed to support insight into learning data. The objectives of these dashboards include providing feedback on learning activities, supporting UHĂHFWLRQDQGGHFLVLRQPDNLQJLQFUHDVLQJHQJDJHPHQW and motivation, and reducing dropout. These learning DQDO\WLFVGDVKERDUGVDSSO\LQIRUPDWLRQYLVXDOL]DWLRQ techniques to help teachers, learners, and other stake-KROGHUVH[SORUHDQGXQGHUVWDQGUHOHYDQWXVHUWUDFHV collected in various (online) environments. The overall objective is to improve (human) learning.
The goal of this chapter is to provide a guide to practi-tioners and researchers who want to get started with the development and evaluation of learning analytics GDVKERDUGV:HSURYLGHJXLGDQFHDQGVHYHUDOH[DP-ples, to address the following items:
1. :KDWNLQGRIGDWDFDQEHYLVXDOL]HG" 2. )RUZKRPDUHWKHYLVXDOL]DWLRQVLQWHQGHGOHDUQHU WHDFKHUPDQDJHUUHVHDUFKHURWKHU" 3. :K\ZKDWLVWKHJRDORIWKHYLVXDOL]DWLRQ" 4. +RZFDQWKHGDWDEHYLVXDOL]HG":KLFKLQWHUDFWLRQ WHFKQLTXHVFDQEHDSSOLHG":KDWWRROVOLEUDULHV data formats, et cetera can be used for the technical LPSOHPHQWDWLRQV":KDWZRUNĂRZDQGUHFLSHFDQ EHXVHGWRGHYHORSWKHYLVXDOL]DWLRQ"
In addition to these four questions, we elaborate on evaluation aspects that assess the usefulness and potential impact of the approach
To Augment the Human Intellect
There is a strong contrast between intelligent systems that try to make decisions on behalf of people, such as intelligent tutoring systems (Brusilovsky, 2000) and educational data mining systems (Santos et al., 2015), and systems that try to empower people to make better-informed decisions. For instance, visual analytics systems (Shneiderman & Bederson, 2003) SURYLGHDFOHDURYHUYLHZRIWKHFRQWH[WWKHGHFLVLRQV that can be made, and the potential implications of those decisions.
'DWDPLQLQJSOD\VWRWKHVWUHQJWKRIFRPSXWHUVWRGR QXPEHUFUXQFKLQJZKLOHYLVXDOL]DWLRQWHFKQLTXHVSOD\ to the remarkable perceptual abilities that humans possess. The difference between the two approaches is like the difference between a self-driving car and DFDUZLWKDKXPDQGULYHU'DWDPLQLQJXVHVDXWR-matic pattern matching for remote control while the dashboard provides visual communication to assist a human driver who remains in control of the vehicle. There is a certain philosophical or ethical side to this notion of two approaches as well: if learners are always WROGZKDWWRGRQH[WKRZFDQWKH\GHYHORSWKHW\SLFDO 21st-century skills of collaboration, communication, FULWLFDOWKLQNLQJDQGFUHDWLYLW\"2UDWDPRUHIXQGD-PHQWDOOHYHOKRZFDQWKH\EHFRPHFLWL]HQVHTXLSSHG with the knowledge, skills, and attitudes to participate IXOO\LQVRFLHW\",QWKLVFKDSWHUZHIRFXVRQPHWKRGV that augment the human intellect, through visual approaches for learning analytics (Engelbart, 1995).
BACKGROUND
Chapter 12: Learning Analytics Dashboards
-RULV.OHUN[.DWULHQ9HUEHUWDQG(ULN'XYDO
7KLVFKDSWHUSUHVHQWVOHDUQLQJDQDO\WLFVGDVKERDUGVWKDWYLVXDOL]HOHDUQLQJWUDFHVWRJLYH XVHUVLQVLJKWLQWRWKHOHDUQLQJSURFHVV([DPSOHVDUHVKRZQRIZKDWGDWDWKHVHGDVKERDUGV XVHIRUZKRPWKH\DUHLQWHQGHGZKDWWKHJRDOLVDQGKRZGDWDFDQEHYLVXDOL]HG,QDGGLWLRQ guidelines on how to get started with the development of learning analytics dashboards are presented for practitioners and researchers.
Keywords:,QIRUPDWLRQYLVXDOL]DWLRQOHDUQLQJDQDO\WLFVGDVKERDUGV
ABSTRACT
Department of Computer Science, KU Leuven, Belgium
Information Visualization
,QIRUPDWLRQYLVXDOL]DWLRQLVWKHXVHRILQWHUDFWLYHYLVXDO representations to amplify cognition (Card, Mackinlay, & Shneiderman, 1999). It typically focuses on abstract GDWDZLWKRXWDVWUDLJKWIRUZDUGUHSUHVHQWDWLRQLQ' RU'VSDFH9LVXDODQDO\WLFVSXWVVSHFLāFHPSKDVLV RQEXLOGLQJPRGHOVDQGYLVXDOL]LQJWKHVHLQRUGHUWR EHWWHUXQGHUVWDQGRUUHāQHWKHPRGHOV$YHU\XVHIXO JRDORILQIRUPDWLRQYLVXDOL]DWLRQLVWRUHO\RQKXPDQ perceptual abilities for pattern discovery (trends, gaps, outliers, clusters). These patterns often become more apparent visually than numerically. As Ware (2004) H[SODLQVLW
The human visual system is a pattern seeker of enormous power and subtlety. The eye and the YLVXDOFRUWH[RIWKHEUDLQIRUPDPDVVLYHO\SDUDOOHO processor that provides the highest-bandwidth channel into human cognitive centers. At higher levels of processing, perception and cognition are closely interrelated, which is the reason ZK\WKHZRUGVÜXQGHUVWDQGLQJÝDQGÜVHHLQJÝ DUHV\QRQ\PRXVS[YL
$VVXFKYLVXDOL]DWLRQKDVWKHSRWHQWLDOWREHPRUH precise and revealing than conventional statistical computations (Tufte, 2001).
6WDWLFYLVXDOL]DWLRQVLHDQLPDJHW\SLFDOO\SURYLGH answers to a limited number of questions that a user PLJKWKDYHDERXWDGDWDVHW)RUH[DPSOHVRFDOOHG infographics are often used for storytelling in jour-QDOLVP+RZHYHUORRNLQJDWDQHYRFDWLYHYLVXDOL]DWLRQ often leads to new questions that can only be answered by interacting with the data itself (Few, 2009). Adding G\QDPLFLQWHUDFWLRQWHFKQLTXHVWRWKHYLVXDOL]DWLRQ therefore, is often necessary to design meaningful YLVXDOL]DWLRQWRROVWKDWHQFRXUDJHH[SORUDWRU\GDWD analysis.
$QRWKHUDGYDQWDJHRIYLVXDOL]DWLRQLVWKHDELOLW\WR reveal problems with the data itself; for instance, about the way the data has been collected. Especially in the case of learning analytics, where (semi-) automated trackers often capture traces of learner activities, this advantage is valuable for quality control.
:KDWIROORZVLVDQRQH[KDXVWLYHRYHUYLHZLWLV LPSRUWDQWWRUHFRJQL]HWKHYDULHW\RIDSSURDFKHV This variety is not surprising given the wide variety RIOHDUQLQJDQDO\WLFVGDWDWKDWFDQEHYLVXDOL]HGIRU a wide variety of audiences and reasons, in a wide variety of ways. 9HUEHUWHWDOSUHVHQWDVXUYH\RIOHDUQLQJDQDO\W-LFVGDVKERDUGDSSOLFDWLRQVÜUDQJLQJIURPVPDOOPRELOH DSSOLFDWLRQVWROHDUQVFDSHVRQODUJHSXEOLFGLVSOD\VÝ S'DVKERDUGVWKH\VD\ÜW\SLFDOO\FDSWXUH DQGYLVXDOL]HWUDFHVRIOHDUQLQJDFWLYLWLHVLQRUGHUWR SURPRWHDZDUHQHVVUHĂHFWLRQDQGVHQVHPDNLQJDQG WRHQDEOHOHDUQHUVWRGHāQHJRDOVDQGWUDFNSURJUHVV WRZDUGVWKHVHJRDOVÝS7KHSDSHUPDNHVXVHIXO distinction between various types of dashboards: 1. 'DVKERDUGVWKDWVXSSRUWWUDGLWLRQDOIDFHWRIDFH
lectures, so as to enable the teacher to adapt the teaching, or to engage students during lecture sessions.
2. 'DVKERDUGVWKDWVXSSRUWIDFHWRIDFHJURXSZRUN and classroom orchestration, for instance by YLVXDOL]LQJDFWLYLWLHVRIERWKLQGLYLGXDOOHDUQHUV and groups of learners.
3. 'DVKERDUGVWKDWVXSSRUWRQOLQHRUEOHQGHGOHDUQ-LQJDQHDUO\IDPRXVH[DPSOHLV&RXUVH6LJQDOV WKDWYLVXDOL]HVSUHGLFWHGOHDUQLQJRXWFRPHVDV DWUDIāFOLJKWEDVHGRQJUDGHVLQWKHFRXUVHVR far, time on task and past performance (Arnold 3LVWLOOL
0RUHVRSKLVWLFDWHGDQGFRPSOH[YLVXDOL]DWLRQV for detailed analysis of course activity by teach-ers are the focus of the Student Activity Meter *RYDHUWV9HUEHUW'XYDO 3DUGR61$33 IRFXVHVRQWKHYLVXDOL]DWLRQRIVRFLDODFWLYLW\RI OHDUQHUV%DNKDULD 'DZVRQ
In terms of what is being tracked, the possibilities FRQWLQXHWRH[SDQGDVQHZRQOLQHWUDFNHUVEHFRPH available, capturing more detail of what learners and teachers do. As well, new sensors proliferate that can likewise capture what people do in the analog world. This second data source is evolving especially rapidly, with mobile devices that now include sensors to report physiological, emotional, and other kinds of learner characteristics that have so far mostly eluded automated capturing. Besides tracking, self-reporting can also be a valuable source of data. Although more HUURUSURQHDQGGLIāFXOWWRVXVWDLQV\VWHPDWLFDOO\ self-reporting offers an opportunity for awareness, UHĂHFWLRQDQGVHOIDQDO\VLV
As for what can be incorporated into a dashboard, 9HUEHUWHWDOOLVWVWKHIROORZLQJNLQGVRIGDWD
1. Artefacts produced by learners, including blog posts, shared documents, software, and other artefacts that would often end up in a student project portfolio.
2. Social interaction, including speech in face-to-face group work, blog comments, Twitter or discussion forum interactions.
3. Resource use can include consultation of documents (manuals, web pages, slides), views of videos, et
WHAT FOR, WHOM, WHY, HOW?
cetera. Techniques like software trackers and eye-tracking can provide detailed information DERXWZKDWSDUWVRIUHVRXUFHVH[DFWO\DUHEHLQJ used and how.
4. Time spent can be useful for teachers to identify students at risk and for students to compare their own efforts with those of their peers.
5. Test and self-assessment results can provide an indication of learning progress.
Figure 12.1 presents one of our more recent dashboards &KDUOHHU.OHUN[2GULR]ROD/XLV 'XYDO7KH dashboard tracks social data from blogs and Twitter. 6XFKGDWDFDWHJRUL]HGDVartefacts produced, is then YLVXDOL]HGIRUstudents. The goal is to support aware-ness about learning progress and to enable discussion
in class. To support such awareness and discussion, social interactions of students are abstracted in the form of learning badges for students to earn. Students FDQWKHQH[SORUHZKLFKEDGJHVWKH\KDYHHDUQHG)LJ-XUHWRSWKURXJKWKHYLVXDOL]DWLRQRIicons and
colour cues*UD\EDGJHVKDYHQRW\HWEHHQHDUQHG 7KHERWWRPSDUWRI)LJXUHVKRZVDYLVXDOL]DWLRQ developed for collaborative use on a tabletop that uses
a node link diagramWRHQDEOHIXUWKHUH[SORUDWLRQRI WKHVHEDGJHV$PRQJRWKHUWKLQJVVWXGHQWVFDQH[SORUH ZKLFKRWKHUVWXGHQWVKDYHHDUQHGVSHFLāFEDGJHVDV a means to compare and discuss learning progress. Figure 12.2 shows a dashboard that uses grades to predict a student’s chances of failing a particular FRXUVH2FKRD9HUEHUW&KLOXL]D 'XYDOEH-fore she starts. The dashboard is intended to support teachers in giving advice to students on their learning WUDMHFWRULHV0RUHVSHFLāFDOO\WKHGDVKERDUGSUHVHQWV WKHOLNHOLKRRGRIWKLVSDUWLFXODUVWXGHQWIDLOLQJD course in which she is interested. The dashboard uses colour cues to indicate whether the risk of failure, based on past performance, is low (green), medium \HOORZRUKLJKUHG'HSHQGLQJRQWKHRXWFRPHWKH teacher can advise the student to take the course or to GLVFXVVDOWHUQDWLYHVVXFKDVāUVWWDNLQJDSUHUHTXLVLWH course. The dashboard also supports several interaction techniques that enable the teacher to indicate which data should be taken into account to generate this prediction, including sliders at the bottom that enable the teacher to specify the range of data in terms of \HDUV)RUH[DPSOHLIDVWXGHQWGLGSRRUO\LQ%LRORJ\ LQ*UDGHEXWZRUNHGKDUGHUDQGGLGZHOOLQ*UDGH
Figure 12.1.7RS1DYL%DGJHERDUGØ3HUVRQDO%DGJH2YHUYLHZ$VWXGHQWÚVEDGJHRYHUYLHZIRUDJLYHQSHULRG
(bottom) Navi Surface: students actively using the tabletop display application during a face-to-face session (Charleer et al., 2013).
WKH*UDGHPDUNFDQEHGLVUHJDUGHG
To leverage the advanced perceptual abilities of humans WRKHOSWKHPH[SORUHDQGGLVFRYHUSDWWHUQVDGHVLJQHU must create a visual representation or encoding of the data (Card et al., 1999). Several steps, outlined below, can be distinguished in this design process.
Understand Your Goals
7KHāUVWVWHSLVJHWWLQJWRNQRZWKHSUREOHPGRPDLQ the data set, the intended end-users of the tool, the typical tasks they should be able to perform, and so on. The following questions need to be answered at this stage:
1. Why:KDWLVWKHJRDORIWKHYLVXDOL]DWLRQ":KDW
TXHVWLRQVDERXWWKHGDWDVKRXOGLWDQVZHU"
2. For whom)RUZKRPLVWKHYLVXDOL]DWLRQLQWHQGHG" Are the people involved specialists in the domain, RULQYLVXDOL]DWLRQ"
3. What:KDWGDWDZLOOWKHYLVXDOL]DWLRQGLVSOD\"'R
WKHVHGDWDH[KLELWDVSHFLāFLQWHUQDOVWUXFWXUH OLNHWLPHDKLHUDUFK\RUDQHWZRUN"
4. How+RZZLOOWKHYLVXDOL]DWLRQVXSSRUWWKHJRDO"
How will people be able to interact with the vi-VXDOL]DWLRQ":KDWLVWKHLQWHQGHGRXWSXWGHYLFH" %\FDUHIXOO\H[DPLQLQJDQGXQGHUVWDQGLQJWKHGDWDVHW a variety of questions about the data can be formed. Having these questions in mind can be useful when DFTXLULQJDQGāOWHULQJGDWDIRUWKHGDVKERDUG)RUH[-ample, consider a data set that contains the following learner traces:
• access to learning resources • WLPHRQSDJHLQGLJLWDOWH[WERRNV • contributions to discussion fora • time spent on assignments
)URPWKHVHWUDFHVZHFDQGHāQHVHYHUDOUHOHYDQW questions as a starting point in the design process. A teacher might ask questions like these:
• When did students start looking at the course PDWHULDO"
• What is the average time that a student spends UHDGLQJWKHWH[WERRN"
• +RZPDQ\KRXUVGLG3HWHUZRUNRQKLVDVVLJQPHQW" •
+RZRIWHQGLG3HWHUDVNDTXHVWLRQRQWKHGLV-FXVVLRQIRUXP"
A student will probably ask similar questions: • How much time do I spend on an assignment,
FRPSDUHGWRRWKHUVWXGHQWV"
• How much do I contribute to the discussion forum, FRPSDUHGWRRWKHUVWXGHQWV"
In both cases, we deliberately only list questions that VWDUWZLWKÜZKDWÝÜZKHQÝÜKRZPXFKÝDQGÜKRZRI-WHQÝ7KHVHVSHFLāFGLUHFWTXHVWLRQVFDQEHGLUHFWO\ PDSSHGLQDGDWDVHW4XHVWLRQVOLNHÜWhy did this student have to enroll twice in this course?ÝWKHDQVZHU
LVPRUHH[SORUDWRU\LQQDWXUH,QGLFDWRUVPD\EHWKDW he did not spend enough time on the course material, did not interact with fellow students on the discussion forum, started to study the course material too late, DQGVRRQ$QRWKHUGLIāFXOWTXHVWLRQWRDQVZHUZRXOG EHÜAre students more eager to work on assignment 1 or assignment 2?Ý(YHQLIPXFKGDWDLVFDSWXUHGLW
LVGLIāFXOWWRDQVZHUTXHVWLRQVLQYROYLQJKXPDQPR-tivations based on a plurality of (un)known variables. Especially in the early phase of design, it is therefore RIWHQDGYLVDEOHDQGHDVLHUWRIRFXVRQGLUHFWVSHFLāF questions.
Acquire and (Pre-)Process Your Data Building a visual dashboard typically entails a data-gath-HULQJDQGSUHSURFHVVLQJVWHS9LVXDOL]DWLRQH[SHUWV suggest that this step takes 80% of the time and effort YHUVXVDOORWKHUVWHSV0F'RQQHODQG(OPTYLVW identify the following intermediary steps:
1. Acquiring raw data: It is important to have a clear idea of where the data will come from (e.g., the log āOHVRIWKH/06DVVHVVPHQWUHVXOWVRWKHUDQG when the data will be updated (continuously, not at DOODWVSHFLāFLQWHUYDOV:LOOWKHGDWDEHDYDLODEOH WKURXJKDQ$SSOLFDWLRQ3URJUDPPLQJ,QWHUIDFH $3,DQH[SRUWāOHRUVRPHRWKHUVRXUFH"
2. Analyzing raw data'DWDPD\QHHGWREHFOHDQHG if some values are missing or erroneous, or pre-processed to compute aggregate values (mean, PLQLPXPPD[LPXPHWFHWHUD,QGDWDDQDO\VLV distribution can also be an issue: are there apparent RXWOLHUVFOXVWHUVHWFHWHUD"
3. 3UHSDULQJDQGāOWHULQJGDWD: Using the initial
questions from step 1, choose the relevant data IURPWKHSRRORIDQDO\]HGUDZGDWD
Mapping Design
Important in the visual mapping design is to choose a representation that best answers the questions you want users to be able to answer, i.e., that serve your YLVXDOL]DWLRQJRDOIRUWKHLQWHQGHGWDUJHWDXGLHQFH 7KHUHH[LVWVDPXOWLWXGHRIDOWHUQDWLYHV2QHZD\WR start is to look at the measurement or scale of each data characteristic. Nominal or qualitative scales differentiate objects based on discrete input domains, VXFKDVFDWHJRULHVRURWKHUTXDOLWDWLYHFODVVLāFDWLRQV
WRZKLFKWKH\EHORQJ4XDQWLWDWLYHVFDOHVKDYHFRQ-HOW TO GET STARTED
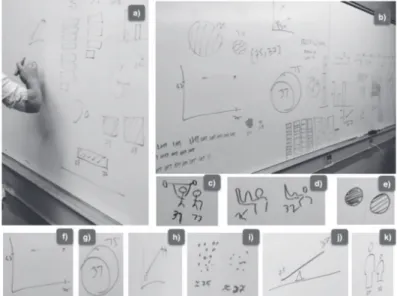
WLQXRXVLQSXWGRPDLQVHJ>@2UGLQDOVFDOHV have discrete input domains where the order of the HOHPHQWVPDWWHUVEXWWKHH[DFWGLIIHUHQFHEHWZHHQWKH YDOXHVGRHVQRW'HSHQGLQJRQWKHVFDOHRIWKHGDWD characteristic, one can choose how to encode this GDWDYLVXDOO\)LJXUHGHSLFWV0DFNLQOD\ÚV ranking of visual properties to encode quantitative, ordered, and categorical scales. For instance, the spatial position of an element is useful for encoding quantitative, ordered, and categorical differences. This is why scatterplots have been used so often to convey a variety of information. Length, on the other hand, can encode quantitative differences, but is of less value for encoding ordered and categorical dif-ferences. Shape is at the bottom of the ranking for YLVXDOL]LQJTXDQWLWDWLYHDQGRUGHUHGGLIIHUHQFHVEXW is more often used to depict categorical data. /RZāGHOLW\SURWRW\SHVVXFKDVSDSHUVNHWFKHVDUH often helpful during the design-mapping step. Figure GHSLFWVDQH[HUFLVHJLYHQWRWKHSDUWLFLSDQWVRI WKHÜ%ULQJ<RXU2ZQ'DWD9LVXDO/HDUQLQJ$QDO\WLFVÝ WXWRULDORUJDQL]HGDWWKH/HDUQLQJ$QDO\WLFV6XPPHU ,QVWLWXWH/$6,3DUWLFLSDQWVLQFOXGHGUHVHDUFKHUV with good knowledge in learning analytics, but limited NQRZOHGJHDERXWYLVXDOL]DWLRQ7KH\ZHUHDVNHGWRWDNH PLQXWHVWRVNHWFKDOOSRVVLEOHZD\VWRYLVXDOL]HD VLPSOHGDWDVHWRIWZRQXPEHUV^`7KHH[HUFLVH illustrated to participants that from the moment they VWDUWVNHWFKLQJLWLVQRWGLIāFXOWWREUDLQVWRUPYLVXDO HQFRGLQJVRIGDWD7KLVLVUHĂHFWHGLQWKHQXPEHURI sketches that two teams of two persons each were able to generate in 15 minutes (see Figure 12.4a and 12.4b). By sketching, more ideas and questions about the data set are often raised, which in turn leads to new ideas IRUYLVXDOL]DWLRQ)RUH[DPSOH
• Figure 12.4c: participants represented the difference
between the numbers quite originally by relating them to age, where a person of 37 can easily lift weights, while a person of 73 might already need a walking stick.
• )LJXUHGDGGVPXVFOHVL]H
• )LJXUHHXVHVVKDGLQJRIDQHTXDOO\VL]HGFLUFOH with 75 versus 37 stripes.
• Figure 12.4f: uses a position in a Cartesian coor-dinate system.
• )LJXUHJYLVXDOL]HVDSDUWWRZKROHUHODWLRQVKLS between the numbers.
• Figure 12.4h: assumes a time-based relationship between both numbers, which leads to a negative trend line.
• Figure 12.4i: uses point clouds.
• )LJXUHMYLVXDOL]HVDQXQEDODQFHGVFDOHWR represent a difference in weight.
• )LJXUHNFRUUHODWHVWKHVL]HRIWKHāJXUHZLWK WKHVL]HRIWKHQXPEHU $IWHUVHOHFWLQJDYLVXDOHQFRGLQJKLJKāGHOLW\SURWRW\SHV FDQEHEXLOWXVLQJYLVXDOL]DWLRQWRROVOLNH7DEOHDXRU HYHQ0LFURVRIW([FHORUH[LVWLQJYLVXDOL]DWLRQOLEUDULHV OLNH3URFHVVLQJRU'MV
Clearly some alternatives work better than others, GHSHQGLQJRQWKHFRQWH[WXDOL]DWLRQHJZHLJKWDQG age) and the ability to be interpreted by users (e.g., the mental model of a balanced scale). There is, therefore, QREHVWZD\WRYLVXDOL]HDGDWDVHWEXWVRPHWHFK-niques have been proven to work better than others, IRUH[DPSOH
• 3LHFKDUWVDUHXVXDOO\DEDGLGHD)HZ • Bar charts can be quite powerful.
• &RRUGLQDWHGJUDSKVHQDEOHULFKH[SORUDWLRQ
Figure 12.3.0DFNLQOD\ÚVUDQNLQJRIYLVXDOSURSHUWLHVIRUGDWDFKDUDFWHULVWLFVRQTXDQWLWDWLYHRUGHUHG
• 'JUDSKLFVRIWHQGRQRWFRQYH\DQ\DGGLWLRQDO information and force the reader to deal with UHGXQGDQWDQGH[WUDQHRXVFXHV/HY\=DFNV 7YHUVN\ 6FKLDQR
• Scatterplots and parallel coordinates are good representations for depicting correlations. In addition, Harrison, Yang, Franconeri, & Chang (2014) found that among the stacked chart variants, WKHVWDFNHGEDUVLJQLāFDQWO\RXWSHUIRUPHGERWK WKHVWDFNHGDUHDDQGVWDFNHGOLQH(OOLRW has presented a nice overview of these studies. Documentation
$VZLWKDQ\GHVLJQH[HUFLVHLWLVLPSRUWDQWWREH H[SOLFLWDERXW
1. Rationale: Why were certain decisions made, ZKDWZDVWKHLQWHQW"
2. Alternatives: Which alternatives were considered DQGZK\ZHUHWKH\QRWZLWKKHOG"
3. Evolution: How has the design evolved from early VNHWFKHVWRDIXOOEORZQLPSOHPHQWDWLRQ":KDW ZDVPRGLāHGIRUFRQFHSWXDOUHDVRQVDQGZKDWIRU implementation or other reasons (logistics, lack RIWLPHRWKHUUHDVRQV"
Add Interaction Techniques
9LVXDODQDO\VLVW\SLFDOO\SURJUHVVHVLQDQLWHUDWLYH SURFHVVRIYLHZFUHDWLRQH[SORUDWLRQDQGUHāQHPHQW +HHU 6KQHLGHUPDQ%HIRUHDQDO\]LQJZKLFK LQWHUDFWLRQWHFKQLTXHVDUHXVHIXOIRUDVSHFLāFYLVX-DOL]DWLRQDSSOLFDWLRQLWLVXVHIXOWRXQGHUVWDQGWKH typical analytical tasks performed by teachers who want to understand how their students are doing in FODVV6HYHUDOWDVNWD[RQRPLHVKDYHEHHQGHVFULEHG in literature for this purpose. Common tasks include:
• &RPSDULQJYDOXHVDQGSDWWHUQVWRāQGVLPLODULWLHV and differences.
• Sorting items based on a variety of data values or metrics.
• Filtering values that satisfy a set of conditions. • +LJKOLJKWLQJGDWDWRPDNHVSHFLāFYDOXHVVWDQGRXW
visually without making all other data disappear, DVLVWKHFDVHZLWKāOWHULQJGDWD
• Clustering or grouping similar items together; for H[DPSOHE\DJJUHJDWLQJTXDQWLWDWLYHGDWDHJ average, count, et cetera) to view it in a higher or lower level of detail.
• $QQRWDWLQJāQGLQJVDQGWKRXJKWV
• %RRNPDUNLQJRUUHFRUGLQJDVSHFLāFYLHZRQWKH data to enable effective navigation.
Heer and Shneiderman (2012) is essential reading on interactive dynamics for visual analytics. The authors SUHVHQWDWD[RQRP\RILQWHUDFWLYHG\QDPLFVWKDWFRQ-tribute to successful visual analytic tools. For each WDVNFDWHJRU\YDULRXVH[LVWLQJYLVXDOL]DWLRQV\VWHPV are described with useful interaction techniques that support the task at hand, such as brushing and linking, KLVWRJUDPVOLGHUV]RRPDEOHPDSVG\QDPLFTXHU\ āOWHUZLGJHWVVPDOOPXOWLSOHGLVSOD\VRUWUHOOLVSORWV multiple coordinated views, visual analysis histories, and so on.
Evaluate Continuously
'XULQJWKHGHVLJQSURFHVVWKHHODERUDWLRQRIFRQFUHWH personas and scenarios can be very rewarding as it helps to focus the design, development, and evaluation RIWKHYLVXDOL]DWLRQRQZKDWLVUHOHYDQW,WLVYHU\HDV\ WRJHWFDUULHGDZD\ZLWKWRRPXFKÜH\HFDQG\ÝDQGORVH WUDFNRIWKHZKDWIRUZKRPDQGZK\WKHYLVXDOL]DWLRQ
LVEHLQJGHVLJQHG*HQHUDOO\DXVHUFHQWUHGGHVLJQ 8&'DSSURDFKSURFHHGVZLWKLWHUDWLYHGHYHORSPHQW that keeps the target users in the loop in continuous F\FOHVRIGHVLJQ×LPSOHPHQWDWLRQ×HYDOXDWLRQ,QWKLV way, the development can focus on the most relevant issues for teachers or learners at all times.
7KHHYDOXDWLRQRILQIRUPDWLRQYLVXDOL]DWLRQV\VWHPV is essential. A plethora of techniques can be used, LQFOXGLQJFRQWUROOHGH[SHULPHQWVWKDWHYDOXDWHGLI-IHUHQWYLVXDOL]DWLRQDQGLQWHUDFWLRQWHFKQLTXHVRU āHOGVWXGLHVWKDWDVVHVVWKHLPSDFWRIDYLVXDOL]DWLRQ RQOHDUQLQJ3ODLVDQW7KHODWWHUWDNHSODFHLQ natural environments (classrooms) but are often time FRQVXPLQJDQGGLIāFXOWWRUHSOLFDWHDQGJHQHUDOL]H 1DJHOHWDO9HUEHUWHWDOVXJJHVWWKH following evaluation techniques:
1. Effectiveness, which can refer to engagement, higher grades or post-test results, higher reten-tion rates, improved self-assessment, and overall course satisfaction.
2. (IāFLHQF\LQWKHXVHRIWLPHRIDWHDFKHURUOHDUQHU 3. Usability and usefulness evaluations often focus
on teachers being able to identify learners at risk or asking learners how well they think they are performing in a course.
Typical evaluation instruments include questionnaires RUFRQWUROOHGH[SHULPHQWVZKHUHWLPHWRWDVNHUURUV PDGHWLPHWROHDUQHWFHWHUDDUHHYDOXDWHG'LOOHQ-bourg et al., 2011).
,QIRUPDWLRQYLVXDOL]DWLRQFRQFHSWVDQGPHWKRGRORJLHV are key enablers for
• Learners to gain insight into their learning actions and the effects these have.
• Teachers to stay aware of the subtle interactions in their courses.
• Researchers to discover patterns in large data sets of user traces and to communicate these data to their peers.
$VVKRZQLQWKLVFKDSWHUYLVXDOL]DWLRQKDVWKHXQLTXH potential to help shape the learning process and HQFRXUDJHUHĂHFWLRQRQLWVSURJUHVVDQGLPSDFWE\ creating learning analytics dashboards that give a concise overview of relevant metrics in an actionable ZD\DQGWKDWVXSSRUWWKHH[SORUDWLRQRISDWWHUQV 'HVLJQLQJDQGFUHDWLQJDQHIIHFWLYHLQIRUPDWLRQYL-VXDOL]DWLRQV\VWHPIRUOHDUQLQJDQDO\WLFVLVDQDUWDV WKHGHVLJQHUQHHGVERWKGRPDLQH[SHUWLVHRQOHDUQLQJ theories and paradigms as well as techniques rang-ing from visual design to algorithm design (Nagel, 6SHQFH,QWKLVFKDSWHUZHKDYHEULHĂ\ LQWURGXFHGWKHYDULRXVVWHSVLQDYLVXDOL]DWLRQGHVLJQ process, from raw data analysis to effective dashboards evaluated by target users.
CONCLUSION
$UQROG.( 3LVWLOOL0'&RXUVH6LJQDOVDW3XUGXH8VLQJOHDUQLQJDQDO\WLFVWRLQFUHDVHVWXGHQW success. Proceedings of the 2nd International Conference on Learning Analytics and Knowledge (LAK ’12), 29 $SULO×0D\9DQFRXYHU%&&DQDGDSS×1HZ<RUN$&0
%DNKDULD$ 'DZVRQ661$33$ELUGÚVH\HYLHZRIWHPSRUDOSDUWLFLSDQWLQWHUDFWLRQProceedings of the 1st International Conference on Learning Analytics and Knowledge/$.Ú)HEUXDU\×0DUFK %DQII$%&DQDGDSS×1HZ<RUN$&0
%UXVLORYVN\3$GDSWLYHK\SHUPHGLD)URPLQWHOOLJHQWWXWRULQJV\VWHPVWRZHEEDVHGHGXFDWLRQ,Q **DXWKLHU&)UDVVRQ.9DQ/HKQ(GVProceedings of the 5th International Conference on Intelligent
Tutoring Systems,76×-XQH0RQWUHDO4&&DQDGDSS×6SULQJHUGRL
B
&DUG6.0DFNLQOD\- 6KQHLGHUPDQ%(GVReadings in information visualization: Using vision to think%XUOLQJWRQ0$0RUJDQ.DXIPDQQ3XEOLVKHUV
&KDUOHHU6.OHUN[-2GULR]ROD6/XLV- 'XYDO(,PSURYLQJDZDUHQHVVDQGUHĂHFWLRQWKURXJK FROODERUDWLYHLQWHUDFWLYHYLVXDOL]DWLRQVRIEDGJHV,Q0.UDYFLN%.URJVWLH$0RRUH93DPPHU/3DQ-QHVH03ULOOD:5HLQKDUGW 7'8OOPDQQ(GVProceedings of the 3rd Workshop on Awareness and
Re-ĂHFWLRQLQ7HFKQRORJ\(QKDQFHG/HDUQLQJ$57(/Ú6HSWHPEHU3DSKRV&\SUXVSSSS×
'LOOHQERXUJ3=XIIHUH\*$ODYL+-HUPDQQ3'ROHQK6%RQQDUG4&XHQGHW6 .DSODQ) Classroom orchestration: The third circle of usability. Proceedings of the 9th International Conference
REFERENCES
on Computer-Supported Collaborative Learning&6&/×-XO\+RQJ.RQJ&KLQDYRO,SS ×,QWHUQDWLRQDO6RFLHW\RIWKH/HDUQLQJ6FLHQFHV (OOLRW.VWXGLHVDERXWKXPDQSHUFHSWLRQLQPLQXWHV3UHVHQWHGDW2SHQ9LVKWWSVPHGL-XPFRP#NHQQHOOLRWWVWXGLHVDERXWKXPDQSHUFHSWLRQLQPLQXWHVIHDUV]FKL (QJHOEDUW'7RZDUGDXJPHQWLQJWKHKXPDQLQWHOOHFWDQGERRVWLQJRXUFROOHFWLYH,4Communications of the ACM, 38×
Few, S. (2009). Now you see it: Simple visualization techniques for quantitative analysis. Berkeley, CA: Analytics 3UHVV
*RYDHUWV69HUEHUW.'XYDO( 3DUGR$7KHVWXGHQWDFWLYLW\PHWHUIRUDZDUHQHVVDQGVHOIUHĂHF-tion. CHI Conference on Human Factors in Computing Systems: Extended Abstracts&+,($Ú×0D\
$XVWLQ7;86$SS×1HZ<RUN$&0
+DUULVRQ/<DQJ))UDQFRQHUL6 &KDQJ55DQNLQJYLVXDOL]DWLRQVRIFRUUHODWLRQXVLQJ:HEHUÚV law. IEEE Transactions on Visualization and Computer Graphics, 20×
+HHU- 6KQHLGHUPDQ%)HEUXDU\,QWHUDFWLYHG\QDPLFVIRUYLVXDODQDO\VLVQueue – Microprocessors, 10(2), 30.
/HY\(=DFNV-7YHUVN\% 6FKLDQR'$SULO*UDWXLWRXVJUDSKLFV"3XWWLQJSUHIHUHQFHVLQSHUVSHF-tive. Proceedings of the SIGCHI Conference on Human Factors in Computing Systems&+,Ú×$SULO
9DQFRXYHU%&&DQDGDSS×1HZ<RUN$&0
0DFNLQOD\-$XWRPDWLQJWKHGHVLJQRIJUDSKLFDOSUHVHQWDWLRQVRIUHODWLRQDOLQIRUPDWLRQTransactions on Graphics, 5×
0F'RQQHO% (OPTYLVW17RZDUGVXWLOL]LQJ*38VLQLQIRUPDWLRQYLVXDOL]DWLRQ$PRGHODQGLPSOH-mentation of image-space operations. IEEE Transactions on Visualization and Computer Graphics, 15
×
1DJHO70DLWDQ0'XYDO(9DQGH0RHUH$.OHUN[-.ORHFNO. 5DWWL&7RXFKLQJWUDQVSRUW $FDVHVWXG\RQYLVXDOL]LQJPHWURSROLWDQSXEOLFWUDQVLWRQLQWHUDFWLYHWDEOHWRSVProceedings of the 12th
International Working Conference on Advanced Visual Interfaces$9,×0D\&RPR,WDO\SS
×1HZ<RUN$&0
Nagel, T. (2015). Unfolding data: Software and design approaches to support casual exploration of tempo-spatial data on interactive tabletops. Leuven, Belgium: KU Leuven, Faculty of Engineering Science.
2FKRD;9HUEHUW.&KLOXL]D. 'XYDO(8QFHUWDLQW\YLVXDOL]DWLRQLQOHDUQLQJDQDO\WLFV:RUNLQ progress for IEEE Transactions on Learning Technologies.
3ODLVDQW&7KHFKDOOHQJHRILQIRUPDWLRQYLVXDOL]DWLRQHYDOXDWLRQProceedings of the 2nd International
Working Conference on Advanced Visual Interfaces$9,Ú×0D\*DOOLSROL,WDO\SS×
New York: ACM.
6DQWRV2&%RWLFDULR-*5RPHUR&3HFKHQL]NL\00HUFHURQ$0LWURV3/XQD-00LKDHVFX& 0RUHQR3+HUVKNRYLW]$9HQWXUD6 'HVPDUDLV0(GVProceedings of the 8th International
Conference on Educational Data Mining
('0×-XQH0DGULG6SDLQ,QWHUQDWLRQDO(GXFD-WLRQDO'DWD0LQLQJ6RFLHW\
Shneiderman, B., & Bederson, B. B. (2003). 7KHFUDIWRILQIRUPDWLRQYLVXDOL]DWLRQ5HDGLQJVDQGUHĂHFWLRQV. Burl-LQJWRQ0$0RUJDQ.DXIPDQQ3XEOLVKHUV
Spence, R. (2001). Information visualization: Design for interaction, 1st ed. Salt Lake City, UT: Addison-Wesley.
Tufte, E. R. (2001). The visual display of quantitative information, 2ndHG&KHVKLUH&7*UDSKLFV3UHVV//&
9HUEHUW.*RYDHUWV6'XYDO(6DQWRV-$VVFKH)3DUUD* .OHUN[-/HDUQLQJGDVKERDUGV$Q overview and future research opportunities. Personal and Ubiquitous Computing, 18×
Ware, C. (2004). Information visualization: Perception for design, 2nd ed. Burlington, MA: Morgan Kaufmann