JOINT TRANSPORTATION RESEARCH PROGRAM
FHWA/IN/JTRP-2001/09
Final Report
VIRTUAL WEIGH STATION
John Green
Andrew Nichols
Ed Allen
Luke Nuber
Jose Thomaz
Darcy Bullock
Guy Boruff
Jay Wasson
Mark Newland
June 2002
FHWA/IN/JTRP-2001/09 VIRTUAL WEIGH STATION
By John G. Green Graduate Research Assistant
Andrew Nichols Graduate Research Assistant
Ed Allen, Luke Nuber Undergraduate Research Assistant
Jose Thomaz Database Analyst
And Darcy Bullock
Professor of Civil Engineering School of Civil Engineering
Purdue University And Guy Boruff Indiana State Police
And Jay Wasson
Indiana Department of Transportation And
Mark Newland
Indiana Department of Transportation Joint Transportation Research Program
Project No. C-36-17GGG File No. 8-4-60
SPR-2481
The contents of this report reflect the views of the authors, who are responsible for the facts and the accuracy of the data presented herein. The contents do not necessarily reflect the views or policies of the Indiana State Police and the Indiana Department of Transportation. This report does not constitute a standard, specification, or regulation.
Purdue University West Lafayette, IN 47907
TECHNICAL REPORT STANDARD TITLE PAGE 1. Report No. 2. Government Accession No. 3. Recipient’s Catalog No.
FHWA/IN/JTRP-2001/09
4. Title and Subtitle
Virtual Weigh Station
5. Report Date
June 2002
6. Performing Organization Code
7. Author(s)
John Green, Andrew Nichols, Ed Allen, Luke Nuber, Jose Thomaz,
8. Performing Organization Report No.
FHWA/IN/JTRP-2001/09
9. Performing Organization Name and Address
Joint Transportation Research Program 1284 Civil Engineering Building
Purdue University
West Lafayette IN 47907-1284
10. Work Unit No.
11. Contract or Grant No.
SPR-2481
12. Sponsoring Agency Name and Address
Indiana Department of Transportation State Office Building
100 North Senate Avenue
13. Type of Report and Period Covered
Final Report
14. Sponsoring Agency Code
15. Supplementary Notes
Prepared in cooperation with the Indiana Department of Transportation and Federal Highway Administration.
16. Abstract
Overweight trucks shorten highway life and indirectly increase the costs of maintaining roads. Improved methods for enforcement of commercial vehicle weight laws may increase the number of overweight vehicles caught, thereby prolonging highway life. Improved enforcement may also reduce the number of illegally operating vehicles.
This report describes the concept of using existing INDOT Weigh-In-Motion equipment, a laptop computer, and wireless communication equipment, to develop a virtual weigh station screening tool. The Virtual Weigh Station screening tool developed in this project allows officers to read the weights of vehicles crossing WIM scales, in real time, in their patrol cars. Giving officers this information increases the chances that the vehicles selected for weighing on portable scales are indeed overweight. This report documents the accuracy and precision evaluation performed on all the candidate WIM sites as well as the new infrastructure required to implement the Virtual Weigh Station concept.
The report describes several cases where significantly overweight vehicles were identified and impounded. For example the procedures described in this report, resulted in the identifying the early morning hours as the best time for enforcement in Merrillville. As a result, on May 18, 2001 vehicles weighing 98,700 lbs and 100,600 lbs were stopped. Those vehicles were impounded and resulted in fines of $1,625.00 and $1,735.50, respectively. In February 2002, Commercial Vehicle Enforcement officers stopped ten trucks on US 24 near Fort Wayne using the virtual weigh station. Eight of the trucks were determined to be overweight and fined. The three heaviest trucks weighed 90,200 lbs, 90,900 lbs, and 91,100 lbs resulting in fines of $1,099.50, $1,169.50, and $1,189.50, respectively. On April 12, 2002, another enforcement was conducted on I-65 near Merrillville. Three trucks were stopped based on the virtual weigh station data. One of the trucks weighed 87,400 lbs, resulting in a $529.50 fine. The report concludes by making several recommendations designed to improve the quality of the WIM data and facilitate wide spread deployment by the Commercial Vehicle Enforcement Division.
17. Key Words
Commercial motor vehicle, weigh in motion, pavement damage
18. Distribution Statement
No restrictions. This document is available to the public through the National Technical Information Service, Springfield, VA 22161
19. Security Classif. (of this report)
Unclassified
20. Security Classif. (of this page)
Unclassified
21. No. of Pages 22. Price
INDOT Research
TECHNICAL
S
ummary
Technology Transfer and Project Implementation Information
TRB Subject Code 53-9 Weigh-In-Motion June 2002
Publication No.: FHWA/IN/JTRP-2001/09, SPR-2481 Final Report
VIRTUAL WEIGH STATION
Introduction
Overweight trucks shorten highway
life and indirectly increase the costs of
maintaining roads. A study for the Oregon
Department of Transportation reported that a
significant relationship exists between the
rate of weight violations and a commercial
carrier’s accident rate. Improvement in
methods for enforcement of commercial
vehicle weight laws may increase the
number of overweight vehicles caught,
thereby prolonging highway life. Improved
enforcement may also reduce the number of
illegally operating vehicles.
In Indiana, officers of the
Commercial Vehicle Enforcement Division
carry out enforcement of laws regarding
trucks. Officers from this branch of the
Indiana State Police regulate any
commercial vehicle weighing greater than
10,000 lbs. The two primary methods used
to check that vehicles are in compliance
with weight limit statutes and regulations are
“Port-of-Entry” static scales and portable
scale units.
As a truck approaches a static
“Port-of-Entry” scale on the highway, the operator
is first directed whether the scale is “open”
or “closed”. If the scale is “closed” (not in
operation), the vehicle may proceed on the
highway, uninterrupted. If the scale is
“open”, then the truck enters the scale via an
exit ramp and is weighed. Because the
Port-of-Entry permanent scales are located near
Indiana’s borders with other states, Indiana
State Police deploy 46 portable scales to
check the weights of vehicles in the interior
of the state. Portable scale units are patrol
cars usually equipped with four Haenni
WL101 Wheel Load Scales.
While the portable scale
measurements are accurate for the issuing of
citations, officers must rely upon their own
experience and intuition when choosing
which vehicles to weigh. Because of the
subjective nature of the current screening
process, many legally loaded vehicles are
weighed. More importantly, many
overweight vehicles are not weighed
because they do not usually exhibit
characteristics that make it possible to
identify them as being overweight.
Findings
The concept of using existing
INDOT Weigh-In-Motion equipment, a
laptop computer, and wireless
communication equipment, to develop a
virtual weigh station system was proposed
for deployment in Indiana in 1998. The
Virtual Weigh Station screening tool
developed in this project allows officers to
read the weights of vehicles crossing WIM
scales, in real time, in their patrol cars.
53-9 6/01 JTRP-2001/09 INDOT Division of Research West Lafayette, IN 47906
Giving officers this information increases
the chances that the vehicles selected for
weighing on portable scales are indeed
overweight. This report documents the
accuracy and precision evaluation performed
on all the candidate WIM sites as well as the
new infrastructure required to implement the
Virtual Weigh Station concept.
Implementation
The report describes several cases
where significantly overweight vehicles
were identified and impounded. For
example the procedures described in this
report, resulted in the identifying the early
morning hours as the best time for
enforcement in Merrillville. As a result, on
May 18, 2001 vehicles weighing 98,700 lbs
and 100,600 lbs were stopped. Those
vehicles were impounded and resulted in
fines of $1,625.00 and $1,735.50,
respectively. In February 2002, Commercial
Vehicle Enforcement officers stopped ten
trucks on US 24 near Fort Wayne using the
virtual weigh station. Eight of the trucks
were determined to be overweight and fined.
The three heaviest trucks weighed 90,200
lbs, 90,900 lbs, and 91,100 lbs resulting in
fines of $1,099.50, $1,169.50, and
$1,189.50, respectively. On April 12, 2002,
another enforcement was conducted on I-65
near Merrillville. Three trucks were stopped
based on the virtual weigh station data. One
of the trucks weighed 87,400 lbs, resulting
in a $529.50 fine.
The report concludes by making
several recommendations designed to
improve the quality of the WIM data and
facilitate wide spread deployment by the
Commercial Vehicle Enforcement Division.
Contact
For more information:
Prof. Darcy Bullock
Principal Investigator
School of Civil Engineering
Purdue University
West Lafayette IN 47907
Phone: (765) 494-2226
Fax: (765) 496-1105
Indiana Department of Transportation
Division of Research
1205 Montgomery Street
P.O. Box 2279
West Lafayette, IN 47906
Phone: (765) 463-1521
Fax: (765) 497-1665
Purdue University
Joint Transportation Research Program
School of Civil Engineering
West Lafayette, IN 47907-1284
Phone: (765) 494-9310
Implementation Report
There is a need for real time monitoring of Weigh In Motion sites around the state and reporting of summary statistics on the web. For example the procedures described in this report, resulted in the identifying the early morning hours as the best time for enforcement in Merrillville. As a result, on May 18, 2001 vehicles weighing 98,700 lbs and 100,600 lbs were stopped. Those vehicles were impounded and resulted in fines of $1,625.00 and
$1,735.50, respectively. In February 2002, Commercial Vehicle Enforcement officers stopped ten trucks on US 24 near Fort Wayne using the virtual weigh station. Eight of the trucks were determined to be overweight and fined. The three heaviest trucks weighed 90,200 lbs, 90,900 lbs, and 91,100 lbs resulting in fines of $1,099.50, $1,169.50, and $1,189.50, respectively. On April 12, 2002, another enforcement was conducted on I-65 near Merrillville. Three trucks were stopped based on the virtual weigh station data. One of the trucks weighed 87,400 lbs, resulting in a $529.50 fine.
In order to achieve a successful, wide scale deployment of the Virtual Weigh Station concept, on line data analysis procedures should be developed that permit rapid diagnosis of WIM calibration problems. This online diagnosis should have two components:
• Tabulation, by lane, of unclassified vehicles. The number of unclassified vehicles should not exceed 10%
for any lane. The historical unclassified vehicle error rate should be presented in a format similar to that shown in Appendix E of this report. The memo in Appendix E identifies only 3 stations providing this level of accuracy in October 2000. Those stations were 4250, 5260, and 6260. All of those stations had only a WIM in a single lane.
• A crude evaluation of the accuracy and precision of a WIM can be estimated by looking at the distribution of
the front axle weights. The thresholds shown in Appendix H provide a starting point for implementing a rigorous quality control program.
The following amendments to the INDOT WIM specification are suggested:
• ”. . . documentation shall be furnished that completed installation confirms the ASTM pavement smoothness
specification defined in the ASTM WIM standard E1318-94 at time of acceptance and possibly warranty smoothness for 2 years.” This amendment is proposed because some of the recently completed WIM installations do not appear to conform to the required smoothness specification. Actually verifying conformance would require a lane closure.
• “. . . a vehicle used for calibrating a WIM shall travel across the WIM at the average speed of Class 9 trucks. Documentation of the average speed of Class 9 trucks shall be provided by WIM records for Class 9 trucks during a weekday from 9am to 4pm." This amendment is proposed because one of the sources of
calibration error was thought to be that calibration trucks were not always traveling at the prevailing speed of Class 9 trucks. In Merrillville that difference was about 10 mph.
• “. . . a vehicle used for calibration shall not be in violation of any Indiana laws.” This amendment is proposed
because the truck used to calibrate the Merrillville WIM had a tandem load of 43,400 lbs. Subsequent discussion with IRD indicated this might cause calibration problems for lower axle weight vehicles.
• “. . . a WIM shall not be accepted by INDOT until telephone service has been operational for 30 consecutive
days and the log files uploaded.” This amendment is proposed because it is very difficult to determine if a site is operating properly unless a month or so of data files, including rainy days, are uploaded and IRD error reports are run on the uploaded data.
• “. . . the panel shown in Figure J-1 with components, shown Figure J-2, shall be furnished and installed as
part of WIM system.” This amendment is proposed so that all new WIMs will be accessible as a virtual scale as soon as they are turned on.
Regarding the use of WIMs for data collection purposes:
• Based upon the sensitivity analysis performed in Chapter 2, we believe a WIM should provide accurate axle
weights within 6% (ASTM Type III) in order to effectively estimate ESALs used to compute pavement life. Based upon observations at new single load cell installations (4410 and 5130), it is not clear whether any of the current installed systems are calibrated to this accuracy. A detailed evaluation at all Single Load Cell Sites (4130, 4150, 4410, 4420, 5110, 5120, and 5130) should be conducted with Summer 2001 data, and field checks performed with Indiana Commercial Vehicle Enforcement Officers.
• Several of the older WIMs using Piezo technology are experiencing severe pavement distress and have
likely reached the end their useful life. Those stations would be of little value to a virtual weigh station concept and are likely of little value for data collection. Consideration should be given to abandoning all Piezo WIM sites and perhaps all Bending Plate sites and devoting those additional resources to improved maintenance on the remaining sites.
• The WIMs that are most promising for the Virtual Weigh Station concept are the relatively new Single Load
Cell installations. WIM 5110 on I-70 appears to hold some promise as a next Virtual Weigh Station site. However, some calibration and tuning will likely be required to eliminate some of the classification errors documented in this report.
Acknowledgements
This project was the idea of Dan Shamo, Jay Wasson, and Guy Boruff.
This study could not have been conducted without the close participation of the Indiana State Police. The efforts of Officers Deb Burkhart, Scott Fleming, Brian Nagle, Henry Davis, Gerald Young, Monty Buffum, Steve Baumgart, Jeff Ligget, and Sharon Branam were instrumental in the field verification and testing of the virtual weigh station concept.
Throughout this study Donn Klepinger, Larry Torrence, Phil Zurawski, and Scott MacCarthur provided field support and data archives necessary for several of the appendices. The figures in Appendix A are based upon Larry Torrence’s files. The “Klepinger Scale” data in Appendix A was obtained from Donn Klepinger’s qualitative site survey.
Finally, Rod Klashinsky from International Road Dynamics (IRD) provided the material for Appendix D as well as coordinated the field calibration and maintenance by Fred Kiesig.
Table of Contents
ACKNOWLEDGEMENTS ...III
TABLE OF CONTENTS ... IV
LIST OF FIGURES... VII
LIST OF TABLES ... XV
1 INTRODUCTION ...1
1.1 Definition of Overweight Problem...1
1.2 Laws and Statutes ...2
1.3 Current Enforcement Procedures ...3
1.3.1 “Port-of-Entry” Static Scales...3
1.3.2 Portable Scale Units ...6
1.4 Scope of Project...8
2 IMPACT OF OVERWEIGHT VEHICLES ...10
2.1 ESAL Computations...10
2.2 ESAL Spreadsheet ...12
2.3 Analysis of Sensitivity to Vehicle Weights ...16
3 EXISTING WIM RESOURCES ...19
3.1 Existing Technologies ...19
3.1.1 Piezoelectric Technologies ...20
3.1.2 Single Load Cell...22
3.1.3 Bending Plates...23
3.2 Suitability of Existing WIM Scales in Indiana for use with the Virtual Weigh Station ...25
3.3 WIM Scale Error Rates ...27
3.4 Front Axle Histograms ...28
3.5 Importance of WIM Accuracy ...30
4 VIRTUAL WEIGH STATION SYSTEM ...31
4.2 “In-vehicle” Equipment ...32
4.3 Description of Road Runner Software Display ...34
4.4 Procedure for System Use ...35
4.5 Stored Data -- Log File...37
5 ENFORCEMENT DETAILS ...38
5.1 Determination Procedure ...38
5.2 Results from Analysis of February 2001 WIM Data on I-65 at Milepost 253.67 ...44
5.3 Summary of Enforcement Details ...44
5.3.1 Summary of 8-10-00 Tests on I-65, near Lafayette, lN ...45
5.3.2 Summary of the 1-04-01 Tests on I-74, near Covington, IN...45
5.3.3 Summary of the Enforcement Details on I-65, near Merrillville, IN...46
5.3.4 Summary of the Enforcement Details on US 24, near Fort Wayne, IN ...50
5.3.5 Summary of the Enforcement Details on I-65, near Merrillville, IN...50
6 CONCLUSIONS...51
APPENDIX A WIM STATION CONFIGURATION...54
APPENDIX B EVALUATION OF COVINGTON WIM ...99
APPENDIX C DIVERSION ROUTES ...102
APPENDIX D INTERNATIONAL ROAD DYNAMICS COST SUMMARY MEMO...105
D.1 Kistler WIM...106
D.1.1 Common Configuration ...107
D.1.2 Scheduled Maintenance ...107
D.2 Single Load Cell Scale...108
D.2.1 Common Configuration ...108
D.2.2 Scheduled Maintenance ...109
D.3 Bending Plate Scale...109
D.3.1 Common Configuration ...110
D.3.2 Scheduled Maintenance ...110
D.4.1 Common Configuration ...112
D.4.2 Scheduled Maintenance ...112
D.5 Comparison of WIM Technology Accuracies and Costs ...113
D.6 Maintenance/Performance Monitoring Approach ...115
APPENDIX E SITE EVALUATION MEMO TO KIRK MANGOLD...117
E.1 Summary of Average Station Performance (All Lanes)...123
E.2 Summary of Average Station Performance (Individual Lanes)...129
APPENDIX F WIM CALIBRATION-JULY 2000...165
APPENDIX G MERRILLVILLE WIM TEST 3-23-01...200
APPENDIX H ASSESSMENT OF WIM ACCURACY AND PRECISION...203
APPENDIX I SUMMARY OF MERRILLVILLE ENFORCEMENT DETAIL...227
APPENDIX J AUTOCAD DRAWINGS ...235
APPENDIX K SUMMARY OF SR 1 DATA (MARCH – MAY 2001) MEMO...238
APPENDIX L SUMMARY OF SR 1 DATA (MARCH – JULY 2001) MEMO...249
APPENDIX M SPECIFICATIONS FOR SR 1 PHOTO WIM MEMO ...268
APPENDIX N SUMMARY OF US 24 DETAIL MEMO...274
APPENDIX O US 24 CALIBRATION ADJUSTMENT MEMO...279
APPENDIX P SUMMARY OF US 24 DATA (MARCH 2002) MEMO ...282
APPENDIX Q SUMMARY OF I-65 ENFORCEMENT DETAIL MEMO ...285
APPENDIX R EFFECTS OF ENFORCEMENT ON SR 1 MEMO ...287
APPENDIX S SUMMARY OF BORMAN DATA (JANUARY-MARCH 2002) MEMO...289
List of Figures
Figure 1-1: Indiana State Police Commercial Vehicle Enforcement Division Officers Ligget, Boruff, and Buffum with
INDOT official Jay Wasson in front of an illegally loaded (111,350-Lb) steel hauler, caught August 10, 2000. ... 2
Figure 1-2: Lowell, Indiana static scales on I-65 Southbound ... 4
Figure 1-3: Truck being weighed on Lowell static scales ... 5
Figure 1-4: Indiana State Police Motor Carrier Officer Monty Buffum records vehicle weights at the Lowell Scales.... 5
Figure 1-5: Lowell scale weight display panel ... 6
Figure 1-6: Haenni WL 101 (portable) Wheel Load Scale ... 7
Figure 1-7: Weighing truck with Haenni scales ... 7
Figure 2-1: ESAL v. Axle Weights for Single and Tandem Axles ... 11
Figure 2-2: Screen capture of Microsoft EXCEL Spreadsheet, set up for calculation of Pavement Life... 13
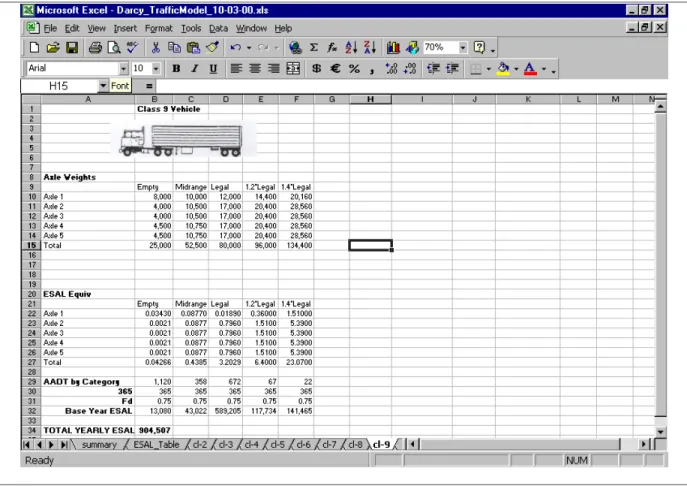
Figure 2-3: Screen Capture of Class 9 Vehicle ESAL sheet ... 14
Figure 2-4: Expected Life of Pavement for Various WIM Errors... 17
Figure 2-5: Pavement Life Expectancy with 14% of vehicles 1.2 * Legal Limit... 18
Figure 3-1: Piezoelectric WIM site configuration ... 20
Figure 3-2: Piezo-electric WIM in pavement on I-65 NB, near Lafayette, IN ... 21
Figure 3-3: A technician installs a piezo-electric sensor... 21
Figure 3-4: Single Load Cell site configuration... 22
Figure 3-5: Single load cells in each lane, I-74 WB, near Covington, IN ... 23
Figure 3-6: Front axle of truck passing over Bending Plate... 24
Figure 3-7: Failed Bending Plate Installation at WIM 5450 Filled with Asphalt... 24
Figure 3-8: Sample project record for a WIM scale installation ... 26
Figure 3-9: Station 4250, 1% Error in October 2000 ... 28
Figure 3-10: Scatter plot for Front Axle loads by lane distribution for station 4110, July 2000 ... 29
Figure 3-11: Histogram for Front Axle loads by lane distribution for station 4110, July 2000 ... 29
Figure 4-1: Sample WIM “in-cabinet” computer output screen ... 31
Figure 4-2: Virtual Weigh Station System Hardware ... 33
Figure 4-3: Virtual Weigh Station Hardware Kit... 33
Figure 4-4: Screen Capture of latest version of Road Runner software ... 35
Figure 4-5: Antenna at WIM Station 4410 on I-65 Northbound at Milepost 253.62 ... 37
Figure 5-2: Overweight Southbound Lane 1, Class 9 Vehicles ... 43
Figure 5-3: Driver Vehicle Inspection Report of Vehicle Impounded by ISP Officer Henry Davis on May 18, 2001, caught using the “In-vehicle” system – GVW was 98,700 Lbs (compared to 80,000 Lbs allowable) ... 47
Figure 5-4: Driver Vehicle Inspection Report of vehicle impounded by ISP Officer Henry Davis on June 01, 2001, caught using the "In-vehicle" system... 48
Figure 5-5: Graphical Comparison of Combined WIM to Scale Weight... 49
Figure A-1: Map of WIM sites in Indiana ... 56
Figure A-2: Schematic Key... 58
Figure A-3: Station 4110 Four Lane Divided ... 59
Figure A-4: Station 4130 Six Lane Divided... 60
Figure A-5: Station 4140 Four Lane Divided ... 61
Figure A-6: Station 4150 Four Lane Divided ... 62
Figure A-7: Station 4240 Four Lane Divided ... 63
Figure A-8: Station 4250 Four Lane Divided ... 64
Figure A-9: Station 4260 Four Lane Divided ... 65
Figure A-10: Station 4270 Four Lane Divided ... 66
Figure A-11: Station 4280 Four Lane Divided ... 67
Figure A-12: Station 4400 Six Lane Divided... 68
Figure A-13: Station 4440 Six Lane Divided... 70
Figure A-14: Station 5110 Four Lane Divided ... 71
Figure A-15: Station 5120 Four Lane Divided ... 72
Figure A-16: Station 5130 Four Lane Divided ... 73
Figure A-17: Station 5140 Four Lane Divided ... 74
Figure A-18: Station 5240 Four Lane Divided ... 75
Figure A-19: Station 5250 Four Lane Divided ... 76
Figure A-20: Station 5260 Four Lane Divided ... 77
Figure A-21: Station 5270 Four Lane Divided ... 78
Figure A-22: Station 5440 Four Lane Divided ... 79
Figure A-23: Station 5450 Four Lane Divided ... 80
Figure A-24: Station 5460 Six Lane Divided... 81
Figure A-26: Station 5480 Six Lane Divided... 83
Figure A-27: Station 5550 Four Lane Divided ... 84
Figure A-28: Station 6130 Four Lane Divided ... 85
Figure A-29: Station 6140 Four Lane Divided ... 86
Figure A-30: Station 6150 Four Lane Divided ... 87
Figure A-31: Station 6160 Four Lane Divided ... 88
Figure A-32: Station 6170 Four Lane Divided ... 89
Figure A-33: Station 6250 Four Lane Divided ... 90
Figure A-34: Station 6260 Four Lane Divided ... 91
Figure A-35: Station 6270 Four Lane Divided ... 92
Figure A-36: Station 6280 Two Lane Undivided... 93
Figure A-37: Station 6290 Two Lane Undivided... 94
Figure A-38: Station 6420 Four Lane Divided ... 95
Figure A-39: Station 7300 Four Lane Divided ... 96
Figure A-40: Station 7320 Four Lane Divided ... 97
Figure A-41: Station 7340 Four Lane Divided ... 98
Figure B-1: Comparison of Test Weights 01-04-01 at Covington WIM 5130... 101
Figure C-1: Lowell Scale Diversion Routes ... 103
Figure C-2: Covington Scale Diversion Routes ... 104
Figure D-1: Common Configurations of Kistler Sensors... 107
Figure D-2: Common Configuration of Single Load Cell Scale... 108
Figure D-3: Common Configuration of Bending Plate Scale ... 110
Figure D-4: Common Configuration of Piezoelectric Sensor ... 112
Figure E-1: Error Rate at Station 4110 ... 123
Figure E-2: Error Rate at Station 4130 ... 123
Figure E-3: Error Rate at Station 4140 ... 123
Figure E-4: Error Rate at Station 4150 ... 123
Figure E-5: Error Rate at Station 4240 ... 123
Figure E-6: Error Rate at Station 4250 ... 123
Figure E-7: Error Rate at Station 4260 ... 124
Figure E-9: Error Rate at Station 4280 ... 124
Figure E-10: Error Rate at Station 4400 ... 124
Figure E-11: Error Rate at Station 4440 ... 124
Figure E-12: Error Rate at Station 5110 ... 124
Figure E-13: Error Rate at Station 5120 ... 125
Figure E-14: Error Rate at Station 5130 ... 125
Figure E-15: Error Rate at Station 5140 ... 125
Figure E-16: Error Rate at Station 5240 ... 125
Figure E-17: Error Rate at Station 5250 ... 125
Figure E-18: Error Rate at Station 5260 ... 125
Figure E-19: Error Rate at Station 5270 ... 126
Figure E-20: Error Rate at Station 5440 ... 126
Figure E-21: Error Rate at Station 5450 ... 126
Figure E-22: Error Rate at Station 5460 ... 126
Figure E-23: Error Rate at Station 5470 ... 126
Figure E-24: Error Rate at Station 5480 ... 126
Figure E-25: Error Rate at Station 5550 ... 127
Figure E-26: Error Rate at Station 6130 ... 127
Figure E-27: Error Rate at Station 6140 ... 127
Figure E-28: Error Rate at Station 6150 ... 127
Figure E-29: Error Rate at Station 6160 ... 127
Figure E-30: Error Rate at Station 6170 ... 127
Figure E-31: Error Rate at Station 6250 ... 128
Figure E-32: Error Rate at Station 6260 ... 128
Figure E-33: Error Rate at Station 6270 ... 128
Figure E-34: Error Rate at Station 6280 ... 128
Figure E-35: Error Rate at Station 6290 ... 128
Figure E-36: Error Rate at Station 6420 ... 128
Figure E-37: Error Rate of individual lanes at station 4110 ... 129
Figure E-38: Error Rate of individual lanes at station 4130 ... 130
Figure E-40: Error Rate of individual lanes at station 4150 ... 132
Figure E-41: Error Rate of individual lanes at station 4240 ... 133
Figure E-42: Error Rate of individual lanes at station 4250 ... 134
Figure E-43: Error Rate of individual lanes at station 4260 ... 135
Figure E-44: Error Rate of individual lanes at station 4270 ... 136
Figure E-45: Error Rate of individual lanes at station 4280 ... 137
Figure E-46: Error Rate of individual lanes at station 4400 ... 138
Figure E-47: Error Rate of individual lanes at station 4440 ... 139
Figure E-48: Error Rate of individual lanes at station 5110 ... 140
Figure E-49: Error Rate of individual lanes at station 5120 ... 141
Figure E-50: Error Rate of individual lanes at station 5130 ... 142
Figure E-51: Error Rate of individual lanes at station 5140 ... 143
Figure E-52: Error Rate of individual lanes at station 5240 ... 144
Figure E-53: Error Rate of individual lanes at station 5250 ... 145
Figure E-54: Error Rate of individual lanes at station 5260 ... 146
Figure E-55: Error Rate of individual lanes at station 5270 ... 147
Figure E-56: Error Rate of individual lanes at station 5440 ... 148
Figure E-57: Error Rate of individual lanes at station 5450 ... 149
Figure E-58: Error Rate of individual lanes at station 5460 ... 150
Figure E-59: Error Rate of individual lanes at station 5470 ... 151
Figure E-60: Error Rate of individual lanes at station 5480 ... 152
Figure E-61: Error Rate of individual lanes at station 5550 ... 153
Figure E-62: Error Rate of individual lanes at station 6130 ... 154
Figure E-63: Error Rate of individual lanes at station 6140 ... 155
Figure E-64: Error Rate of individual lanes at station 6150 ... 156
Figure E-65: Error Rate of individual lanes at station 6160 ... 157
Figure E-66: Error Rate of individual lanes at station 6170 ... 158
Figure E-67: Error Rate of individual lanes at station 6250 ... 159
Figure E-68: Error Rate of individual lanes at station 6260 ... 160
Figure E-69: Error Rate of individual lanes at station 6270 ... 161
Figure E-71: Error Rate of individual lanes at station 6290 ... 163
Figure E-72: Error Rate of individual lanes at station 6420 ... 164
Figure F-1: Station 4110, Class 9 Vehicles - Front Axle Load Distribution ... 166
Figure F-2: Station 4110, Class 9 Vehicles - Gross Vehicle Weight vs. Front Axle... 166
Figure F-3: Station 4130, Class 9 Vehicles - Front Axle Load Distribution ... 167
Figure F-4: Station 4130, Class 9 Vehicles - Gross Vehicle Weight vs. Front Axle... 167
Figure F-5: Station 4140, Class 9 Vehicles - Front Axle Load Distribution ... 168
Figure F-6: Station 4140, Class 9 Vehicles - Gross Vehicle Weight vs. Front Axle... 168
Figure F-7: Station 4160, Class 9 Vehicles - Front Axle Load Distribution ... 169
Figure F-8: Station 4160, Class 9 Vehicles - Gross Vehicle Weight vs. Front Axle... 169
Figure F-9: Station 4240, Class 9 Vehicles - Front Axle Load Distribution ... 170
Figure F-10: Station 4240, Class 9 Vehicles - Gross Vehicle Weight vs. Front Axle ... 170
Figure F-11: Station 4250, Class 9 Vehicles - Front Axle Load Distribution ... 171
Figure F-12: Station 4250, Class 9 Vehicles - Gross Vehicle Weight vs. Front Axle ... 171
Figure F-13: Station 4260, Class 9 Vehicles - Front Axle Load Distribution ... 172
Figure F-14: Station 4260, Class 9 Vehicles - Gross Vehicle Weight vs. Front Axle ... 172
Figure F-15: Station 4270, Class 9 Vehicles - Front Axle Load Distribution ... 173
Figure F-16: Station 4270, Class 9 Vehicles - Gross Vehicle Weight vs. Front Axle ... 173
Figure F-17: Station 4280, Class 9 Vehicles - Front Axle Load Distribution ... 174
Figure F-18: Station 4280, Class 9 Vehicles - Gross Vehicle Weight vs. Front Axle ... 174
Figure F-19: Station 4440, Class 9 Vehicles - Front Axle Load Distribution ... 175
Figure F-20: Station 4440, Class 9 Vehicles - Gross Vehicle Weight vs. Front Axle ... 175
Figure F-21: Station 5110, Class 9 Vehicles - Front Axle Load Distribution ... 176
Figure F-22: Station 5110, Class 9 Vehicles - Gross Vehicle Weight vs. Front Axle ... 176
Figure F-23: Station 5120, Class 9 Vehicles - Front Axle Load Distribution ... 177
Figure F-24: Station 5120, Class 9 Vehicles - Gross Vehicle Weight vs. Front Axle ... 177
Figure F-25: Station 5140, Class 9 Vehicles - Front Axle Load Distribution ... 178
Figure F-26: Station 5140, Class 9 Vehicles - Gross Vehicle Weight vs. Front Axle ... 178
Figure F-27: Station 5240, Class 9 Vehicles - Front Axle Load Distribution ... 179
Figure F-28: Station 5240, Class 9 Vehicles - Gross Vehicle Weight vs. Front Axle ... 179
Figure F-30: Station 5250, Class 9 Vehicles - Gross Vehicle Weight vs. Front Axle ... 180
Figure F-31: Station 5260, Class 9 Vehicles - Front Axle Load Distribution ... 181
Figure F-32: Station 5260, Class 9 Vehicles - Gross Vehicle Weight vs. Front Axle ... 181
Figure F-33: Station 5270, Class 9 Vehicles - Front Axle Load Distribution ... 182
Figure F-34: Station 5270, Class 9 Vehicles - Gross Vehicle Weight vs. Front Axle ... 182
Figure F-35: Station 5440, Class 9 Vehicles - Front Axle Load Distribution ... 183
Figure F-36: Station 5440, Class 9 Vehicles - Gross Vehicle Weight vs. Front Axle ... 183
Figure F-37: Station 5440, Class 9 Vehicles - Front Axle Load Distribution ... 184
Figure F-38: Station 5450, Class 9 Vehicles - Gross Vehicle Weight vs. Front Axle ... 184
Figure F-39: Station 5460, Class 9 Vehicles - Front Axle Load Distribution ... 185
Figure F-40: Station 5460, Class 9 Vehicles - Gross Vehicle Weight vs. Front Axle ... 185
Figure F-41: Station 5470, Class 9 Vehicles - Front Axle Load Distribution ... 186
Figure F-42: Station 5470, Class 9 Vehicles - Gross Vehicle Weight vs. Front Axle ... 186
Figure F-43: Station 5480, Class 9 Vehicles - Front Axle Load Distribution ... 187
Figure F-44: Station 5480, Class 9 Vehicles - Gross Vehicle Weight vs. Front Axle ... 187
Figure F-45: Station 5550, Class 9 Vehicles - Front Axle Load Distribution ... 188
Figure F-46: Station 5550, Class 9 Vehicles - Gross Vehicle Weight vs. Front Axle ... 188
Figure F-47: Station 6130, Class 9 Vehicles - Front Axle Load Distribution ... 189
Figure F-48: Station 6130, Class 9 Vehicles - Gross Vehicle Weight vs. Front Axle ... 189
Figure F-49: Station 6140, Class 9 Vehicles - Front Axle Load Distribution ... 190
Figure F-50: Station 6140, Class 9 Vehicles - Gross Vehicle Weight vs. Front Axle ... 190
Figure F-51: Station 6150, Class 9 Vehicles - Front Axle Load Distribution ... 191
Figure F-52: Station 6150, Class 9 Vehicles - Gross Vehicle Weight vs. Front Axle ... 191
Figure F-53: Station 6160, Class 9 Vehicles - Front Axle Load Distribution ... 192
Figure F-54: Station 6160, Class 9 Vehicles - Gross Vehicle Weight vs. Front Axle ... 192
Figure F-55: Station 6170, Class 9 Vehicles - Front Axle Load Distribution ... 193
Figure F-56: Station 6170, Class 9 Vehicles - Gross Vehicle Weight vs. Front Axle ... 193
Figure F-57: Station 6250, Class 9 Vehicles - Front Axle Load Distribution ... 194
Figure F-58: Station 6250, Class 9 Vehicles - Gross Vehicle Weight vs. Front Axle ... 194
Figure F-59: Station 6260, Class 9 Vehicles - Front Axle Load Distribution ... 195
Figure F-61: Station 6270, Class 9 Vehicles - Front Axle Load Distribution ... 196
Figure F-62: Station 6270, Class 9 Vehicles - Gross Vehicle Weight vs. Front Axle ... 196
Figure F-63: Station 6280, Class 9 Vehicles - Front Axle Load Distribution ... 197
Figure F-64: Station 6280, Class 9 Vehicles - Gross Vehicle Weight vs. Front Axle ... 197
Figure F-65: Station 6290, Class 9 Vehicles - Front Axle Load Distribution ... 198
Figure F-66: Station 6290, Class 9 Vehicles - Gross Vehicle Weight vs. Front Axle ... 198
Figure F-67: Station 6420, Class 9 Vehicles - Front Axle Load Distribution ... 199
Figure F-68: Station 6420, Class 9 Vehicles - Gross Vehicle Weight vs. Front Axle ... 199
Figure G-1: WIM #4410 Comparison to Portable Scales Test Results, 3-23-01 ... 202
Figure H-1: Average Class 9 Front Axle Weight for All WIM Lanes ... 208
Figure H-2: Average Class 9 Front Axle Weight for WIM lanes with GVW < 32,000... 217
Figure H-3: Average Class 9 Front Axle Weight for WIM Lanes with 32,000 < GVW < 70,000... 220
Figure H-4: Average Class 9 Front Axle Weight for WIM lanes with GVW > 70,000... 223
Figure I-1: March 29, 2001 – Merrillville Scale Detail (WIM 4410) – WIM v. Static graph ... 228
Figure I-2: May 8, 2001 – Merrillville Scale Detail (WIM 4410) – WIM v. Static graph ... 229
Figure I-3: May 15, 2001 – Merrillville Scale Detail (WIM 4410) – WIM v. Static graph... 230
Figure I-4: May 18, 2001 – Merrillville Scale Detail (WIM 4410) – WIM v. Static graph... 231
Figure I-5: May 21, 2001 – Merrillville Scale Detail (WIM 4410) – WIM v. Static graph... 232
Figure I-6: May 23, 2001 - Merrillville Scale Detail (WIM 4410) - WIM v. Static graph ... 233
Figure I-7: May 31, 2001 - Merrillville Scale Detail (WIM 4410) - WIM v. Static graph ... 234
Figure J-1: Remote Radio Mounting Plate Drawing ... 236
List of Tables
Table 2-1: Load Equivalency Factors for various Single Axle and Tandem Weights ... 10
Table 2-2: Selected vehicle classes in various states of loading ... 15
Table 2-3: Expected Life of Asphalt Pavement for Various WIM Errors ... 16
Table 3-1: Summary of ASTM 1318-94 Type Code and Accuracy for Common WIM Technology ... 19
Table 5-1: Class 9 Vehicles, Feb 01 00:00:00 2001 TO Thu Mar 01 00:00:00 2001 - Station 4410, Northbound... 39
Table 5-2: Class 9 Vehicles, Feb 01 00:00:00 2001 TO Thu Mar 01 00:00:00 2001 - Station 4420, Southbound ... 39
Table 5-3: February 2001, Northbound, Lane 1, Class 9 Vehicles exceeding 90,000lbs. ... 40
Table 5-4: February 2001, Northbound, Lane 2, Class 9 Vehicles exceeding 90,000 Lbs. ... 40
Table 5-5: February 2001, Northbound, Lane 3, Class 9 Vehicles exceeding 90,000 Lbs. ... 41
Table 5-6: February 2001, Southbound, Lane 1, Class 9 Vehicles exceeding 90,000 Lbs. ... 41
Table 5-7: February 2001, Southbound, Lane 2, Class 9 Vehicles exceeding 90,000 Lbs. ... 42
Table 5-8: Combined Results of Enforcement Details... 49
Table A-1: WIM Sites of Indiana... 55
Table A-2: List of Automatic Traffic Recording Sites in Indiana... 57
Table A-3: List of Abbreviations Used ... 58
Table A-4: Klepinger Pavement Evaluation Scale, March 2001 ... 58
Table A-5: Station 4110 Inventory ... 59
Table A-6: Station 4130 Inventory ... 60
Table A-7: Station 4140 Inventory ... 61
Table A-8: Station 4150 Inventory ... 62
Table A-9: Station 4240 Inventory ... 63
Table A-10: Station 4250 Inventory ... 64
Table A-11: Station 4260 Inventory ... 65
Table A-12: Station 4270 Inventory ... 66
Table A-13: Station 4280 Inventory ... 67
Table A-14: Station 4400 Inventory ... 68
Table A-15: Station 4440 Inventory ... 70
Table A-16: Station 5110 Inventory ... 71
Table A-17: Station 5120 Inventory ... 72
Table A-19: Station 5140 Inventory ... 74
Table A-20: Station 5240 Inventory ... 75
Table A-21: Station 5250 Inventory ... 76
Table A-22: Station 5260 Inventory ... 77
Table A-23: Station 5270 Inventory ... 78
Table A-24: Station 5440 Inventory ... 79
Table A-25: Station 5450 Inventory ... 80
Table A-26: Station 5460 Inventory ... 81
Table A-27: Station 5470 Inventory ... 82
Table A-28: Station 5480 Inventory ... 83
Table A-29: Station 5550 Inventory ... 84
Table A-30: Station 6130 Inventory ... 85
Table A-31: Station 6140 Inventory ... 86
Table A-32: Station 6150 Inventory ... 87
Table A-33: Station 6160 Inventory ... 88
Table A-34: Station 6170 Inventory ... 89
Table A-35: Station 6250 Inventory ... 90
Table A-36: Station 6260 Inventory ... 91
Table A-37: Station 6270 Inventory ... 92
Table A-38: Station 6280 Inventory ... 93
Table A-39: Station 6290 Inventory ... 94
Table A-40: Station 6420 Inventory ... 95
Table A-41: Station 7300 Inventory ... 96
Table A-42: Station 7320 Inventory ... 97
Table A-43: Station 7340 Inventory ... 98
Table B-1: 01-04-01 Test of WIM System ... 100
Table D-1: WIM Technology Comparison ... 113
Table E-1: Acceptable Sites ... 118
Table E-2: Location of All WIM Stations ... 121
Table E-3: October 2000 Roadway Management Error Report... 122
Table H-1: Average Class 9 Front Axle Weight for All WIM Lanes, Sorted by Front Axle Weight (33,689-10,398)... 204 Table H-2: Average Class 9 Front Axle Weight for All WIM Lanes, Sorted by Front Axle Weight (10,285-7,200)... 205 Table H-3: Average Class 9 Axle Weight for All WIM Lanes, Sorted by Front Axle Weight (6,310-1,001) ... 206 Table H-4: Average Class 9 Axle Weight for All WIM Lanes, Sorted by Front Axle Weight (986-308)... 207 Table H-5: Average Class 9 Front Axle Weight for All WIM Lanes, Sorted by Number and Lane (4110-4280) ... 209 Table H-6: Average Class 9 Front Axle Weight for All WIM Lanes, Sorted by Number and Lane (4400-5460) ... 210 Table H-7: Average Class 9 Front Axle Weight for All WIM Lanes, Sorted by Number and Lane (5470-6250) ... 211 Table H-8: Average Class 9 Front Axle Weight for All WIM Lanes, Sorted by Number and Lane (6270-7340) ... 212 Table H-9: Average Class 9 Front Axle Weight for WIM lanes with GVW<32,000, Sorted by Site Number (4110-4400) ... 213 Table H-10: Average Class 9 Front Axle Weight for WIM lanes with GVW<32,000, Sorted by Site Number
(5110-5470)... 214 Table H-11: Average Class 9 Front Axle Weight for WIM lanes with GVW<32,000, Sorted by Site Number
(5480-6250)... 215 Table H-12: Average Class 9 Front Axle Weight for WIM lanes with GVW<32,000, Sorted by Site Number
(6270-7340)... 216 Table H-13: Average Class 9 Front Axle Weight for WIM lanes with 32,000<GVW<70,000, Sorted by Site Number
(4110-5450) ... 218 Table H-14: Average Class 9 Front Axle Weight for WIM lanes with 32,000<GVW<70,000, Sorted by Site Number
(5470-7340) ... 219 Table H-15: Average Class 9 Front Axle Weight for WIM lanes with GVW>70,000, Sorted by Site Number
(4110-5470)... 221 Table H-16: Average Class 9 Front Axle Weight for WIM lanes with GVW>70,000, Sorted by Site Number
(5480-7340)... 222 Table H-17: Acceptable Ranges for Front Axle Mean & Standard Deviation for Table H-18 and Table H-19 ... 224 Table H-18: Evaluation of WIM Performance (Stations 4110-5240)... 225 Table H-19: Evaluation of WIM Performance (Stations 5250-7340)... 226 Table I-1: March 29, 2001 – Merrillville Scale Detail (WIM 4410) – WIM v. Static... 228 Table I-2: May 8, 2001 – Merrillville Scale Detail (WIM 4410) – WIM v. Static... 229 Table I-3: May 15, 2001 – Merrillville Scale Detail (WIM 4410) – WIM v. Static... 230 Table I-4: May 18, 2001 – Merrillville Scale Detail (WIM 4410) – WIM v. Static... 231
Table I-5: May 21, 2001 – Merrillville Scale Detail (WIM 4410) – WIM v. Static... 232 Table I-6: May 23, 2001 - Merrillville Scale Detail (WIM 4410) - WIM v. Static ... 233 Table I-7: May 31, 2001 – Merrillville Scale Detail (WIM 4410) – WIM v. Static... 234
1 Introduction
Overweight trucks shorten highway life and indirectly increase the costs of maintaining roads. Additionally, a study for the Oregon Department of Transportation found that a significant relationship exists between the rate of weight violations and a commercial carrier’s accident rate [Eubanks, 1997]. Improvement in methods for enforcement of commercial vehicle weight laws may increase the number of overweight vehicles caught, thereby prolonging highway life. Improved enforcement may also reduce the number of illegally operating vehicles.
1.1 Definition of Overweight Problem
A highway is built to serve its function for a period of several years. This is called the road’s design life. While transportation officials do plan and budget funds in the reference frame of time, the roads are actually designed according to a number of Equivalent Single Axle Loads, or ESAL, that can traverse the roadway before repairs or replacement is needed.
Problems arise when truck operators overload their vehicles. The amount of pavement life, measured in ESALs, consumed by the passage of a single truck increases dramatically as Gross Vehicular Weight (GVW) rises above the legal limits [IDOT, 1998]. To prevent the shortening of the roads’ lifespans, the Indiana State Police enforces weight limits through the use of fixed-installation static scales and portable static scales.
By law, all commercial truck drivers must submit their vehicles for weighing if they traverse a section of roadway within which a static scale installation is located. Because there are a relatively small number of these expensive, permanent installations located in Indiana, Indiana State Police rely heavily upon the mobile scale units. Unfortunately, officers equipped with these portable scales currently have no tools to help them choose which trucks to weigh. While knowledge of truck driver behavior and accumulated experience help officers to choose vehicles for inspection, understandably, many of the trucks that officers select and weigh are within legal weight limits. Since the inspections take roughly 45 minutes to perform, this research is intended to increase the likelihood that a stopped vehicle is in fact overweight.
Figure 1-1: Indiana State Police Commercial Vehicle Enforcement Division Officers Ligget, Boruff, and Buffum with INDOT official Jay Wasson in front of an illegally loaded (111,350-Lb) steel hauler, caught August 10, 2000.
1.2 Laws and Statutes
While federal, state and local laws regulate commercial vehicles, the statutes pertaining to weight limits and loading configurations are primarily state laws. These weight laws are listed in Indiana Code 9-20-4. The Gross Vehicular Weight limit is described in IC 9-20-4-1.
“Sec. 1. (a) Except as provided in subsections (b) and (c), a person may not operate or cause to be
operated upon an Indiana highway a vehicle or combination of vehicles having weight in excess of one (1) or more of the following limitations:
(1) The total gross weight, with load, in pounds of any vehicle or combination of vehicles may not exceed an overall gross weight on a group of two (2) or more consecutive axles produced by application of the following formula:
( ) (
)
[
]
{
1
12
36
}
500
⋅
−
+
+
=
LN
N
N
W
where W equals the overall gross weight on any group of two (2) or more consecutive axles to the nearest five hundred (500) pounds, L equals the distance in feet between the extreme of any group of two (2) or more consecutive axles, and N equals the number of axles in the group under consideration, except that two (2)
consecutive sets of tandem axles may carry a gross load of thirty-four thousand (34,000) pounds each, providing the overall distance between the first and last axles of the consecutive sets of tandem axles is thirty-six (36) feet or more.
The overall gross weight limit, calculated under this subdivision, may not exceed eighty thousand (80,000) pounds.”
Individual axle group (tandem) limits are stated in this section as well.
“(2) The weight concentrated on the roadway surface from any tandem axle group may not exceed the following:
(A) Thirty-four thousand (34,000) pounds total weight.
(B) Twenty thousand (20,000) pounds on an individual axle in a tandem group,” [Access Indiana, 2000].
1.3 Current Enforcement Procedures
In Indiana, officers of the Commercial Vehicle Enforcement Division carry out enforcement of laws regarding trucks. More specifically, officers from this branch of the Indiana State Police regulate any commercial vehicle weighing greater than 10,000 lbs. The two primary methods used to check that vehicles are in compliance with weight limit statutes and regulations are “Port-of-Entry” static scales and portable scale units.
1.3.1 “Port-of-Entry” Static Scales
Following Federal policy suggestions, “Ports-of-Entry”, the first method that Indiana uses, is the operation of permanent, static scale installations. The Port-of-Entry concept directs that permanent scales be placed near state borders on high traffic volume routes, and only weigh trucks that have just entered the state. The idea is that if two neighboring states only operate installations weighing incoming vehicles, then redundancy will be avoided.
As a truck approaches a static scale installation from the highway, the operator is first directed whether the scale is “open” or “closed”. If the scale is “closed” (not in operation), the vehicle may proceed on the highway, uninterrupted. If the scale is “open”, then the truck enters the scale via an exit ramp.
At a modern station, such as the Lowell Scale on I-65, a Weigh-In-Motion (WIM) system along the ramp screens the trucks by weight, instructing the lighter weight vehicles to enter a scale bypass lane that sends the trucks back onto the highway. The trucks weighing close to their legally allowed limits (roughly within 10%) are directed to enter a lane that proceeds to the scales.
When a truck reaches the proper position on the scales, the Commercial Vehicle Enforcement Officer operating the installation inside the scale house flips a switch that changes the traffic signal controlling the scale lane to red (Figure 1-2). When the truck stops, if it is improperly positioned for a proper scale reading, the Commercial
Vehicle Enforcement Officer instructs the truck operator to adjust the position of his/her vehicle accordingly. When the vehicle is properly positioned, a weight reading is recorded.
If a vehicle is found to be overweight, either through exceeding the allowed gross vehicular weight or by surpassing the weight limit per axle tandem (or tridem), the truck operator is instructed to drive the truck to a detention lot. If laws were broken, citations may be issued. If the weight problem involves an overloaded axle, the driver may attempt to adjust the loading of the vehicle to become legal, and proceed back to the highway. However, if the truck exceeds GVW limits by a large enough margin (5000 Lbs for class 9 vehicles), the vehicle is impounded until part (or all) of the load is removed to make the vehicle legal.
Scale House Scale Pads
Traffic Signal
Axle 1
Axle 2
Axle 3
Figure 1-3: Truck being weighed on Lowell static scales
Figure 1-5: Lowell scale weight display panel
1.3.2 Portable Scale Units
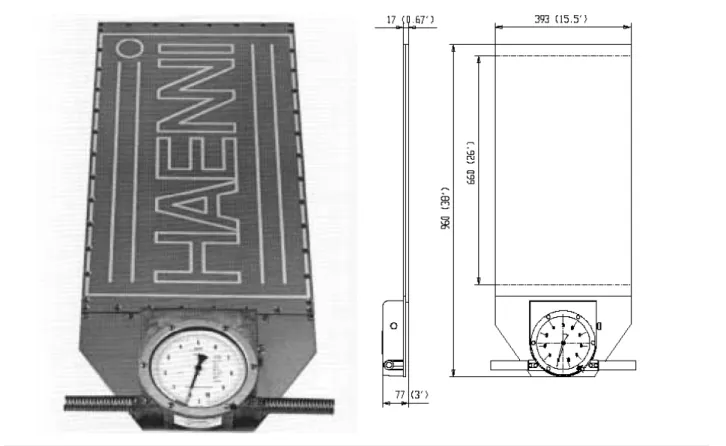
Because the Port-of-Entry permanent scales are located near Indiana’s borders with other states, Indiana State Police deploy 46 portable scale crews to check the weights of vehicles in the interior of the state [FHWA, 2000]. Portable scale units are patrol cars usually equipped with four or six Haenni WL101 Wheel Load Scales (Figure 1-6).
The procedure for weighing trucks with portable scales is as follows. Officers observe traffic, select a suspected vehicle, and then lead it to a safe area for weighing. Individual axle weights are first determined by placing scales beneath a pair of wheels on the same axle of a vehicle. The measurements are added and recorded. Sheets of plywood, the same thickness as the scales, are placed under the wheels that are not currently being weighed to maintain the same cross-level and avoid shifting of the load. The truck is moved slightly, the scales are placed under the remaining wheels, and weights are recorded. When all of the axles have been weighed, the axle weights are summed to determine Drive Tandem Weight, trailer Tandem Weight, and Gross Vehicular Weight. If the vehicle is found to be out of compliance with weight laws, the drivers are either issued warnings or citations. If the vehicle is significantly overweight, the overloaded vehicle may be impounded until the weight is made legal through load repositioning (tandem axle weight violation) or offloading (GVW violation).
Figure 1-6: Haenni WL 101 (portable) Wheel Load Scale
Haenni Scale
Haenni Scale
Plywood same thickness as Haenni scale
While the measurements obtained have been determined to be accurate enough for the issuing of citations, officers must rely upon their own intuition when choosing which vehicles to weigh. Because of the subjective nature of the current screening process, many legally loaded vehicles are weighed. More importantly, many overweight vehicles are not weighed because they do not usually exhibit characteristics that make it possible to identify them as being overweight.
1.4 Scope of Project
This project had five objectives:
1) To quantify impact of overweight vehicles. Chapter 2 discusses the spreadsheet model developed for this purpose.
2) To identify which of Indiana’s existing WIM sites are currently operating accurately enough to be used with the “in-vehicle” laptop system (and which sites need repairs) and to demonstrate the importance of WIM accuracy in determining accumulated ESALs. Chapter 3 discusses these data analysis procedures.
3) To develop prototype “in-cabinet” and “in-vehicle” WIM screening equipment to improve enforcement efficiency. Chapter 4 describes the necessary WIM cabinet components and the virtual weigh station software run in the vehicle called Road Runner.
4) To develop procedures to determine the best times for ISP to schedule enforcement details so that scarce resources are used as efficiently as possible. Chapter 5 shows some tabulations illustrating peak times for enforcement.
5) To document the impact of the virtual WIM on enforcement. Chapter 5 describes several details. Chapter 6 proposes several items that should be pursued to deploy the virtual weigh station concept in a manner that will maximize impact.
In addition, this report contains the following Appendices:
Appendix A: Tables and figures describing the location and features of existing WIMs. Because WIMs are constantly being upgraded, the reader is cautioned that this appendix is only a snapshot of the current WIM system statewide.
Appendix B: Tables and graphs from Covington WIM #5130 evaluation. Subsequent analysis by Donn Klepinger found system did not meet INDOT specifications and the vendor was contacted.
Appendix C: Diversion routes envisioned for trucks diverting around WIMs on I-65 and I-74. Locations of Scale Houses are also shown.
Appendix D: Cost summary information provided by International Road Dynamics.
Appendix E: Site evaluation memo sent to Kirk Mangold based upon classification error rates. Appendix F: Tabulation of front axle loads from July 2000 used to screen for scale accuracy. Appendix G: Summary of Merrillville WIM test.
Appendix H: Summary table and graph of front axle data from Appendix F. Appendix I: Summary sheets from Merrillville enforcement details.
Appendix J: Drawings of panels to be installed in INDOT cabinets to enable the Virtual Weigh Station Concept.
Appendix K: Memo summarizing the data obtained from the SR 1 WIM for March – May 2001. Appendix L: Memo summarizing the data obtained from the SR 1 WIM for March – July 2001. Appendix M: Memo summarizing the specifications for the video aspect of the SR 1 WIM. Appendix N: Memo summarizing the enforcement details conducted on US 24 in February 2002. Appendix O: Memo summarizing the calibration adjustment for the US 24 WIM.
Appendix P: Memo summarizing the data obtained from the US 24 WIM for March 2002.
Appendix Q: Memo summarizing the enforcement detail conducted on I-65 near Merrillville in April 2002. Appendix R: Memo summarizing the effects of the SR 1 WIM installation on truck volumes.
Appendix S: Memo summarizing the data obtained from the I-80/I-94 WIM for January - March 2002. Appendix T: List of references in this research.
2
Impact of Overweight Vehicles
Overweight vehicles have a significant effect on pavement life. Because the relationship between vehicular weight and pavement life consumption is non-linear, one significantly overweight truck can do as much damage as all of the automobiles that traverse the same section of road in a day. Improperly distributed loads can also cause more damage to a roadway than a similar vehicle with the same load properly distributed. Therefore, to more accurately describe the effects of vehicles on pavement life, consumption is described in terms of Equivalent Single Axle Loads (ESALs), rather than Gross Vehicular Weight.
2.1 ESAL Computations
Design by ESALs is a straightforward concept, but needs to be explained. While vehicles that travel over Interstate Highways vary widely in appearance and operating capabilities, at least one property remains the same across all makes and classes – they all have pairs of wheels, connected by an axle, that transfer loads to the roadway running surface.
The standard weight for a single-axle ESAL is assumed to be 18,000 Lbs., and roads are designed to accept the loading cycles of a set number of ESALs before the road fails due to fatigue. For Interstate highways like I-65 in Indiana, an average design number of ESAL is around 50,000,000. Table 2-1 shows ESALs for various axle weights. Figure 2-1 illustrates the ESALs for both single axle and tandem weights [Huang, 1997].
Figure 2-1: ESAL v. Axle Weights for Single and Tandem Axles
The formula used by many engineers for designing asphalt highway pavements was developed by the Asphalt Institute [Huang, 1997]. It is,
ESAL = fd x Gjt x AADTi x 365 x Ni x Fei
Where:
ESAL = Equivalent Single Axle Loads
fd = design lane factor
Gjt = growth factor for a given growth rate “j”, and design period “t”
AADTi = first year annual average daily traffic for axle category “i”
Ni = number of axles on each vehicle in category “i”
Fei = load equivalency factor for axle category “i”
The following sets of example calculations illustrate the procedure for applying this formula. The example assumes the following data:
Passenger Cars (1000 Lb per axle) = 50%
2-axle Single-unit Trucks (5000 Lb per axle) = 30 %
3-axle Single Unit Trucks (7500 Lb per axle) = 20%
AADT = 12,000
Design Period = 20 years
% Truck volume on design lane = 45%
Solution:
ESAL = fd x Gjt x AADT x 365 x Ni x Fei
Growth factor = 29.78 (Compound growth rate for 20 years at 4% growth) Load equivalency factors per axle:
Passenger cars = 0.00002 (Table 2-1)
2-axle Single-unit Trucks = 0.00500 (Table 2-1)
3-axle Single Unit Trucks = 0.01960 (Table 2-1)
Number of accumulated ESAL in the design lane:
Passenger cars = 0.45 x 29.78 x 12,000 x 0.50 x 365 x 2 x 0.00002 =1174
2-axle Single-unit Trucks =0.45 x 29.78 x 12,000 x 0.30 x 365 x 2 x 0.005 =176,089 3-axle Single Unit Trucks = 0.45 x 29.78 x 12,000 x 0.20 x 365 x 3 x 0.0196 =690,269 Total = 866,358 ESAL
2.2 ESAL Spreadsheet
Performing ESAL calculations can be quite cumbersome when many highway alternatives are considered. This is especially true when the complete number of vehicle classes defined by the State of Indiana is considered in the calculations. Spreadsheet computer applications, such as Microsoft’s EXCEL, can simplify the task, and reduce the amount of time necessary by considerable amounts.
Figure 2-2 is a screen-capture of an EXCEL spreadsheet configured to account for vehicle classes two through thirteen (accounting for the majority of traffic traversing I-65). Each class of vehicle is represented by several
states of loading that may be expected in a random sampling of vehicles. Indiana State Police Commercial Vehicle Enforcement Division Officers Monty Buffum and Steve Baumgart have provided data for approximate Gross Vehicular Weights (GVW) and individual axles of each class.
(1) (2) (3) (4) (5) (6) (7) (8) (9) (10) (11) (12) Tabs for Classes 9-13 not shown Figure 2-2: Screen capture of Microsoft EXCEL Spreadsheet, set up for calculation of Pavement Life
The first page (Figure 2-2, item 1), Expected Life, of the spreadsheet shows a graph comparing the pavement life versus the Weight Error Factor (Figure 2-4). The resulting curve produced by connecting the data points shows that a logarithmic relationship exists between the two. From the graph, it can be determined that, for a particular traffic scenario, a small error of 10% in calculation of accumulated ESALs may cause the pavement life estimate to be off by more than 25%.
The second page (Figure 2-2, item 2), Expected Life Data, lists in tabular form results of pavement life expectancy produced by iterations of the spreadsheet program. Examining only the range varying from 80% to 120% of actual GVW, iterations show that pavement life varies accordingly from 39 to 10 years.
The third page (Figure 2-2, item 3), Summary, summarizes the information calculated by the spreadsheet, contains areas for designers to input information regarding Design ESAL, Design Period (in years), AADT, and Growth Rate. Additionally, information in other areas, which are shown in light gray, can be altered to represent the actual mix of traffic if precise data is available. At the bottom of the Summary page results reporting the Total Base Year ESAL, Total Design Period ESAL, and Pavement Life Expectancy (in years), are shown.
The fourth page (Figure 2-2, item 4), ESAL Table, is a data table that the summary sheet calculations refer to for individual axle ESAL factors. This table was taken from Traffic and Highway Engineering by Garber & Hoel [Garber, 1988]. The remaining pages in the spreadsheet contain information unique to each individual class of vehicles (Figure 2-2, items 5-12). Once again, the summary sheet is where the calculations are performed and the unique class sheets are only used for formula reference.
Figure 2-3: Screen Capture of Class 9 Vehicle ESAL sheet
What the ESAL spreadsheet illustrates is that increasing the weights of vehicles to overweight levels, especially for classes nine and greater, significantly reduces pavement life. The relationship for increasing weights
and ESAL is not a linear function. As use of the ESAL spreadsheet shows, increasing the weights of all non-automobiles (trucks) by 25% more than doubles the ESALs consumed.
Vehicle
Class Empty Midrange Legal 1.2*Legal 1.4*Legal
Weight (lbs) 2,000 3,000 4,000 4,800 6,720 2 ESAL 0.000 0.000 0.000 0.000 0.001 Weight (lbs) 5,000 8,000 11,000 13,200 18,480 3 ESAL 0.001 0.003 0.015 0.030 0.122 Weight (lbs) 28,000 30,000 32,000 38,400 53,760 4 ESAL 1.088 1.371 1.529 3.390 11.490 Weight (lbs) 11,000 21,500 32,000 38,400 53,760 5 ESAL 0.015 0.298 1.529 3.390 11.490 Weight (lbs) 20,000 34,000 48,000 57,600 80,640 6 ESAL 0.050 0.094 2.019 4.020 15.450 Weight (lbs) 27,000 47,500 68,000 81,600 95,200 7 ESAL 0.131 1.414 5.860 11.290 20.790 Weight (lbs) 26,000 47,000 68,000 81,600 114,240 8 ESAL 0.066 0.454 3.529 7.050 25.430 Weight (lbs) 25,000 52,500 80,000 96,000 134,400 9 ESAL 0.043 0.439 3.203 6.400 23.070 Weight (lbs) 35,000 57,500 80,000 96,000 134,400 10 ESAL 0.070 0.453 1.892 4.268 15.800 Weight (lbs) 36,000 58,000 80,000 96,000 134,400 11 ESAL 0.124 0.244 3.203 6.400 23.070 Weight (lbs) 42,000 61,000 80,000 96,000 134,400 12 ESAL 0.134 0.538 1.627 3.185 12.910 Weight (lbs) 50,000 65,000 80,000 96,000 134,400 13 ESAL 0.168 0.393 0.581 2.136 8.530
2.3 Analysis of Sensitivity to Vehicle Weights
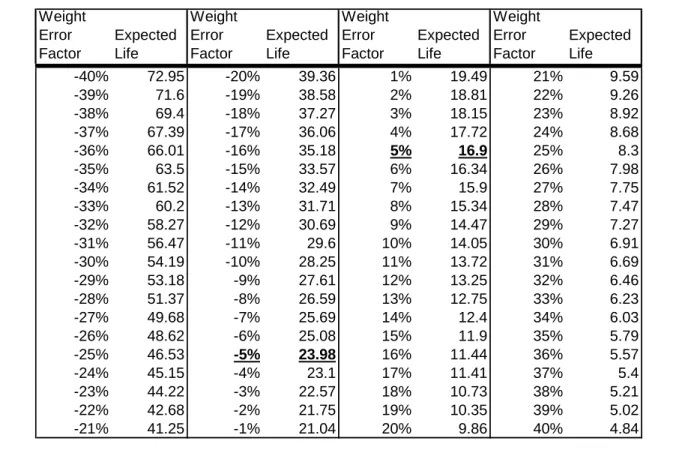
One of the most powerful uses of this spreadsheet is to evaluate the impact variations in WIM accuracy or vehicle mix have on estimated pavement life. For the example in Table 2-3, when the expected life is 20 years, we see that a WIM that overestimates the axle weight by 5% overestimates the life expectancy of the pavement by 3.1 years. Similarly, a WIM that underestimates the axle weight by 5% underestimates the life expectancy of the pavement by almost 4 years.
Weight Error Factor Expected Life Weight Error Factor Expected Life Weight Error Factor Expected Life Weight Error Factor Expected Life -40% 72.95 -20% 39.36 1% 19.49 21% 9.59 -39% 71.6 -19% 38.58 2% 18.81 22% 9.26 -38% 69.4 -18% 37.27 3% 18.15 23% 8.92 -37% 67.39 -17% 36.06 4% 17.72 24% 8.68 -36% 66.01 -16% 35.18 5% 16.9 25% 8.3 -35% 63.5 -15% 33.57 6% 16.34 26% 7.98 -34% 61.52 -14% 32.49 7% 15.9 27% 7.75 -33% 60.2 -13% 31.71 8% 15.34 28% 7.47 -32% 58.27 -12% 30.69 9% 14.47 29% 7.27 -31% 56.47 -11% 29.6 10% 14.05 30% 6.91 -30% 54.19 -10% 28.25 11% 13.72 31% 6.69 -29% 53.18 -9% 27.61 12% 13.25 32% 6.46 -28% 51.37 -8% 26.59 13% 12.75 33% 6.23 -27% 49.68 -7% 25.69 14% 12.4 34% 6.03 -26% 48.62 -6% 25.08 15% 11.9 35% 5.79 -25% 46.53 -5% 23.98 16% 11.44 36% 5.57 -24% 45.15 -4% 23.1 17% 11.41 37% 5.4 -23% 44.22 -3% 22.57 18% 10.73 38% 5.21 -22% 42.68 -2% 21.75 19% 10.35 39% 5.02 -21% 41.25 -1% 21.04 20% 9.86 40% 4.84
Expected Life v. Weight Error Factor y = 20.104e-3.4672x
R2 = 0.9995 0 5 10 15 20 25 30 35 40 45 -20% -15% -10% -5% 0% 5% 10% 15% 20%
Weight Estimation Error Factor
Expect ed Pavem ent Li fe ( years)
Figure 2-4: Expected Life of Pavement for Various WIM Errors
Since a typical section of interstate rehabilitation can cost roughly $ 1,000,000 to $4,000,000/ lane / mile, it is very important to obtain as accurate axle weight estimates as possible so that maintenance activities can be efficiently programmed.
Also, to estimate the impact overweight vehicles have on the life expectancy of pavement, consider the example from Figure 2-5. If the percentage of overweight vehicles is increased to 14%, the pavement life expectancy decreases from 20 years to 16.6 years.
3
Existing WIM Resources
Indiana has employed WIM scales for data collection purposes for over 10 years. The goal of this project is to determine if these existing devices could be used to screen overweight trucks. This chapter reviews the
technology used by WIMs and their relative accuracy levels.
3.1 Existing Technologies
There are currently 3 different Weigh-In-Motion technologies commonly employed in the pavements of Indiana’s highways. They are Piezo-electric sensors, Single Load Cells, and Bending Plate scales. The Kistler technology is not currently used in Indiana, but is used in Illinois. Of these three WIM scale types, Piezo-electric sensors cost the least, but unfortunately, also produce the least accurate results. The error rates that can be expected for each of the technologies are shown in Table 3-1. [Bushman, 1998]. Appendix D was provided by Rod Klashinsky of IRD and summarizes the estimated costs and perceived accuracies of the available technologies.
Technology ASTM Type GVW Accuracy
Piezo 2 15%
Bending Plate, Kistler 1 10%
Load Cell 3 6%
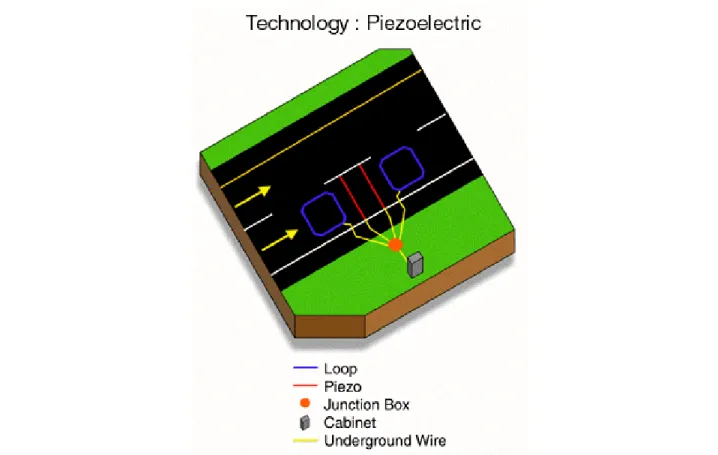
Figure 3-1: Piezoelectric WIM site configuration
3.1.1 Piezoelectric Technologies
At the heart of a piezoelectric sensor is a copper wire, surrounded by a piezoelectric material. When a vehicle passes over the sensor, the wire deforms slightly, and an electric charge is produced. The degree and characteristics of the electric charge are then analyzed to determine the weight of the vehicle.
Figure 3-1 shows the typical sensor configuration for a Piezo installation. Figure 3-2 shows a photograph of a failed Piezo installation in the northbound lane of I-65 at WIM site 5450. Figure 3-3 shows a photograph of a technician installing a Piezo sensor.
Figure 3-2: Piezo-electric WIM in pavement on I-65 NB, near Lafayette, IN
Figure 3-4: Single Load Cell site configuration
3.1.2 Single Load Cell
The Single Load Cell technology is believed to be the most accurate WIM weighing technology currently used in Indiana. It is also perhaps the most expensive of the technologies on a per site basis. Figure 3-4 shows the sensor configuration of a single load cell installation. Figure 3-5 shows a photograph of an installation on I-74 in the eastbound direction at station 5130.
The Single Load Cell (WIM) Scale consists of two interconnected weighing platforms, situated side-by-side, covering one lane of traffic. Each platform has one hydraulic load cell inside it that measures half the weight of a vehicle passing over it. Weights recorded by each weighing platform are then combined to produce axle weights and ultimately GVW.

![Figure 2-1 illustrates the ESALs for both single axle and tandem weights [Huang, 1997]](https://thumb-us.123doks.com/thumbv2/123dok_us/8989132.2796800/33.918.116.814.723.1036/figure-illustrates-esals-single-axle-tandem-weights-huang.webp)