INTRODUCTION
From a business point of view the packaging system is becoming an increasingly more vital and integrated factor for success in the marketplace. The influence of the packaging system is canalized through an efficient supply chain to add value and satisfy steadily increasing customer demands, described in futures research, e.g. by Olsmats1 and Pira.2The logistics and marketing functions of packaging, as well as the fact that the package can contribute to saving resources and reducing the environmental load, are of importance in the supply chain.
Many authors emphasize the need for a holistic view on packaging, e.g. Johnsson3 and Dominic et al.4in a logistics perspective, Sörås et al.5 in an environmental perspective, and Harckham6 in an overall business perspective. The complexity and length of the supply chains are increasing with globalization and increased competition. Compa-nies typically specialize and concentrate on core
business, a process described by Chatham House Forum.7 Case studies by Johansson et al.8 look-ing into the strategic role of packaglook-ing seem to indicate that a more holistic view is implemented in organizations with strong vertical integration. With a need for a holistic approach and a trend towards longer and more complex supply chains, the need for a method/tool to support an overall evaluation of packaging contribution to efficiency and value creation in the supply chain is indicated. A new approach to general company stategic management was developed in the early 1990s by Kaplan and Norton.9Recognizing the need for a broader view on business performance than the traditional financial perspective, they developed a system and named it the ‘balanced scorecard’. They described the innovation of the balanced scorecard as follows:
The balanced scorecard retains traditional financial measures. But financial measures tell the story of past events, an adequate story for industrial age companies for which investments in long-term
Packaging Scorecard – a Packaging
Performance Evaluation Method
By Carl Olsmats
*
†and Chris Dominic
Packforsk – The Institute for Packaging and Logistics AB, Kista, Sweden
To support a more holistic approach to the contribution of packaging to efficiency and value creation in the product supply chain, a systematic evaluation method – packaging scorecard – has been developed and tested in two case studies. The packaging scorecard is based on research of functional criteria of packaging and the theories of ‘balanced scorecard’, a general management approach to evaluating organizational performance using different perspectives. The results of the case studies indicate that the method can be very useful to get a systematic overview of packaging performance throughout the product supply chain. Copyright © 2003 John Wiley & Sons, Ltd.
Received 17 January 2003; Revised 4 February 2003; Accepted 5 March 2003
KEY WORDS: strategy; management; logistics; balanced scorecard; supply chain; demand chain
* Correspondence to: C. Olsmats, Packforsk — The Institute for Packaging and Logistics AB, Kista, Sweden.
capabilities and customer relationships were not critical for success. These financial measures are inadequate, however, for guiding and evaluating the journey that information age companies must make to create future value through investment in customers, suppliers, employees, processes, tech-nology, and innovation.
The balanced scorecard approach avoids some of the weaknesses and vagueness of previous management approaches, with too much focus on (short-term) financial performance. It suggests a framework where the organization is measured and followed-up from four perspectives:
•
The learning and growth perspective.•
The business process perspective.•
The customer perspective.•
The financial perspective.Several customized applications of balanced score-card in other areas, such as procurement (Pratsch and Ustad10) and packaging logistics (Johnsson3), have been proposed.
Based on the need for a holistic approach to packaging, together with the increased difficulties in obtaining this view with growing length and complexity of supply chains and the concept of balanced scorecard principle of different perspec-tives, a ‘packaging scorecard’ has been developed by Dominic and Olsmats.11 The perspectives
chosen are the different actors in the supply and demand chain. For each actor, a subjective, but systematic, evaluation of the role and functions of packaging towards higher business performance is performed. The packaging scorecard is intended to support one common goal for all actors in the supply chain. This goal is to satisfy the final cus-tomer needs.
METHODOLOGY
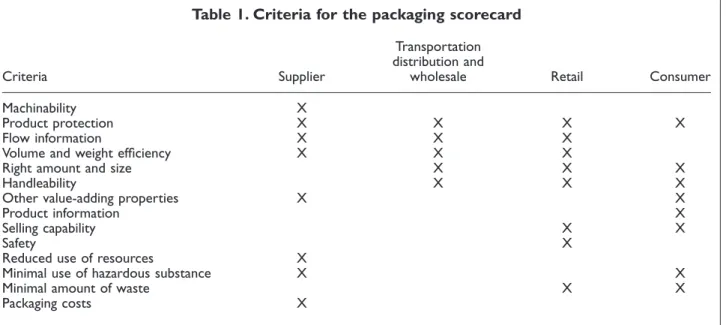
Based on research regarding packaging function-ality by Lorentzon and Olsmats,12 Dominic et al.4 and Henriksson13 a theoretical framework for a packaging scorecard was developed. This is pre-sented in Table 1 and summarizes functional criteria (marked X) that are typically the most significant ones for different actors along the supply chain and can serve as a base for the creation of the applied packaging scorecard.
This framework was then tested and refined in an integrated process using two case studies. Two different types of products and packaging systems were selected in the fast-moving consumer goods (FMCG) sector. The selected packages were card-board containers for breakfast cereals and a plastic refill package for jam.
Table 1. Criteria for the packaging scorecard
Transportation distribution and
Criteria Supplier wholesale Retail Consumer
Machinability X
Product protection X X X X
Flow information X X X
Volume and weight efficiency X X X
Right amount and size X X X
Handleability X X X
Other value-adding properties X X
Product information X
Selling capability X X
Safety X
Reduced use of resources X
Minimal use of hazardous substance X X
Minimal amount of waste X X
The respective scorecard forms were distributed to the various contact persons in the supply chain for the chosen packaging systems. These persons had considerable knowledge of the packaging system at an operative level. The contact persons were then asked to weight the criteria on a scale of 0–100%. The criteria were pre-selected, but the respondents had the right to add any new criteria they felt were missing.
Thereafter, the weighted criteria were normal-ized as follows: the weighted criteria are summed to a total; each weighted criterion is then divided by the total; the normalized weight is presented as a percentage and it indicates the relative signifi-cance of each criterion.
After the weighting, the respondents were asked to evaluate packaging performance for each crite-rion on a scale of 0–4, where the criteria are:
•
0, not applicable for the package.•
1, not approved.•
2, approved.•
3, well approved.•
4, met excellently.The normalized criteria were then multiplied by the scores gained and thereafter summed to a weighted average packaging score. This score gives an indication of how well the package is per-forming in the respective links of the supply chain.
RESULTS AND DISCUSSION
In the following, results from one of the case studies will be presented, to illustrate how the packaging scorecard can be applied. Procordia isone of Sweden’s leading grocery suppliers, with a number of market leading brands in its portfolio. The product studied was jam or marmalade filled in a refill package. The hot product is filled into a plastic tube and the finished product resembles a sausage. In order to maintain the high quality of the product, quick and effective cooling is essen-tial. The packaging scorecard in the supply chain for the jam refill package can be summarized as in Figure 1. Indicated by the score levels is, in general, a well-performing package.
For interpretation and evaluation of the perfor-mance, the scores must be analysed at a lower criteria level for each actor. The evaluation of pack-aging performance using the scorecards at sup-plier, wholesaler and retailers is presented in Tables 2, 3, 4 and 5.
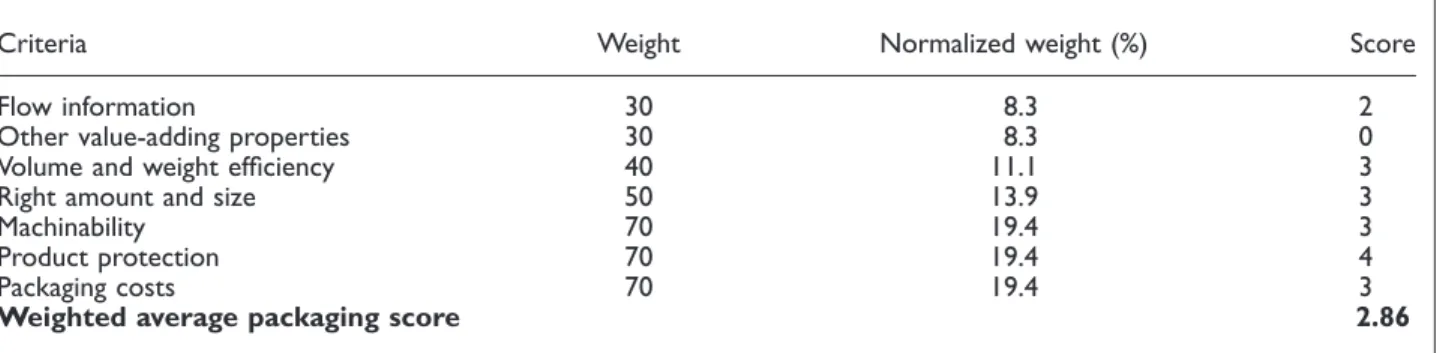
At supplier level in Table 2, the criteria Packag-ing cost, Product protection and Machinabilityare considered the most significant ones for this appli-cation at Procordia. The score indicates that some effort could be put into reducing Packaging cost and improving Machinability. Further room for improvement relates to Flow information, ranked to have a somewhat lower weight but also a low
Figure 1.The packaging scorecard for Procordia refill.
Table 2.The supplier packaging scorecard for the plastic refill package for jam
Criteria Weight Normalized weight (%) Score
Flow information 30 8.3 2
Other value-adding properties 30 8.3 0
Volume and weight efficiency 40 11.1 3
Right amount and size 50 13.9 3
Machinability 70 19.4 3
Product protection 70 19.4 4
Packaging costs 70 19.4 3
performance score. The weighted total score for the refill package at the supplier level is 2.86.
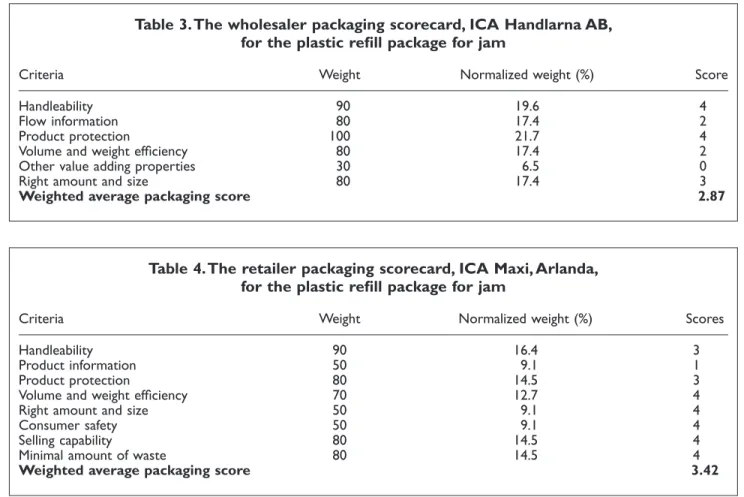
At wholesaler level illustrated in Table 3 and represented by ICA Handlarna AB, the criterion Product protection has been given the highest weight, followed by Handleability. Other highly significant criteria are Right amount and size, Flow information and Volume and weight efficiency. As indicated by the result, the performance score is low for Flow information and Volume and weight efficiency. Being highly significant, these need to be improved. The weighted total score for the refill package at the wholesaler level is 2.87.
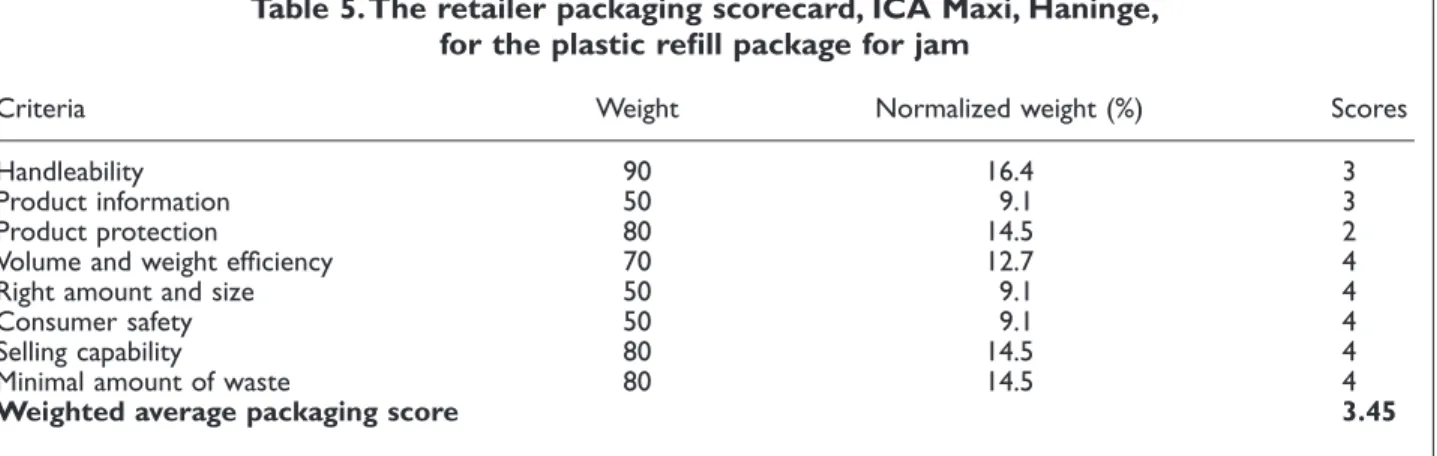
At retailer level, illustrated in Tables 4 and 5 and represented by retail stores ICA Maxi, Arlanda, and ICA Maxi, Haninge, the results show that the criterion Handleability is very important for both retailers. The total average score for the refill packaging is 3.44, which generally indicates a well-performing package. The Selling capability was rated excellent at both retailers. Despite this there
is room for improvement. At ICA Maxi, Arlanda, the criterion Product information has been given the lowest score, since customers have complained about difficulties to select the right kind of jam. Leaking consumer packages had been encountered at both retailers indicating inadequate Product protection. Handleability may also be an area for further improvement. Due to financial constraints, the consumer perspective was not evaluated in the case studies.
The scorecard is based on subjective ratings of packaging performance, hence the outcome may be sensitive to which respondent is selected. To reduce this problem, several people could be asked to do the rating and an average value could be used. The subjective nature of the rating makes it difficult to compare packaging performance for different applications, but comparisons are supported for different packaging applications with similar product, supply chain and market. The subjective rating can be advantageous, as it also reflects Table 3.The wholesaler packaging scorecard, ICA Handlarna AB,
for the plastic refill package for jam
Criteria Weight Normalized weight (%) Score
Handleability 90 19.6 4
Flow information 80 17.4 2
Product protection 100 21.7 4
Volume and weight efficiency 80 17.4 2
Other value adding properties 30 6.5 0
Right amount and size 80 17.4 3
Weighted average packaging score 2.87
Table 4.The retailer packaging scorecard, ICA Maxi, Arlanda, for the plastic refill package for jam
Criteria Weight Normalized weight (%) Scores
Handleability 90 16.4 3
Product information 50 9.1 1
Product protection 80 14.5 3
Volume and weight efficiency 70 12.7 4
Right amount and size 50 9.1 4
Consumer safety 50 9.1 4
Selling capability 80 14.5 4
Minimal amount of waste 80 14.5 4
feelings about a package, which may well be as important as any objective performance criteria.
The results can be very useful for the supply and demand chain, and especially for the product and packaging suppliers, in their efforts to de-velop and produce better packaging systems. The method consolidates the requirements of the supply chain and presents them in an interpretable form. The potential benefits were confirmed by interviews with respondents in connection to pre-sentation of results.
The risk of incorrect conclusions makes the pre-sentation and evaluation of the information obtained in the studies very important. The overall wholesaler, distributor and transport score was practically the same for both case studies. One explanation for this may be that both units are handled in corrugated boxes. It is also worth noting that the respondent was the same person in both cases. However, going through the criteria one by one and then comparing them showed that the underlying weighting and scores were signifi-cantly different in the two cases.
CONCLUSIONS
The results from the case studies indicate that the packaging scorecard method is useful as a mapping tool for the participants in the supply chain. Strengths and weaknesses of the packaging system are identified in a systematic way with a holistic approach. A weakness of the approach is that it only identifies improvements but does not
suggest any solutions. Product suppliers in the case studies clearly indicated that they got a better overview and understanding of the packaging system performance throughout the supply chain. Further research is proposed, focusing on:
•
The cost implications of different score levels for various criteria.•
Definitions of what functional performance is implied for different scores and criteria.•
Verification of the usefulness of the method for other sectors than FMCG.•
Testing the method at consumer level.ACKNOWLEDGEMENTS
The authors want to thank The Private Owners Associ-ation Packforsk for financing this project. We would also like to thank the case study respondents, Mr Yngve Nordvall, packaging researcher at Procordia in Örebro, Mr Tommy Brunsärn at Cerealia in Järna, and Mr Lars Bernhardsson, Packaging Logistics Manager at ICA Handlarnas AB in Växjö.
REFERENCES
1. Olsmats C. Drivkrafter i omvärlden och deras konsekvenser för framtida logistik-, marknads- och miljökrav på förpackningssystemet. Thesis for the degree of Licentiate in Engineering, Industrial Economics and Management, Faculty of Chemical Engineering, Åbo Akademi University, Finland, 2001.
Table 5.The retailer packaging scorecard, ICA Maxi, Haninge, for the plastic refill package for jam
Criteria Weight Normalized weight (%) Scores
Handleability 90 16.4 3
Product information 50 9.1 3
Product protection 80 14.5 2
Volume and weight efficiency 70 12.7 4
Right amount and size 50 9.1 4
Consumer safety 50 9.1 4
Selling capability 80 14.5 4
Minimal amount of waste 80 14.5 4
2. Pira International. Into the Millenium–Packaging. Pira International: Leatherhead, 1997.
3. Johnsson M. Packaging Logistics – a Value-added Approach. Doctoral thesis, Department of Engi-neering Logistics, Lund University, 1998.
4. Dominic C, Johansson K, Lorentzon A. et al. Förpackningslogistik–2 : a utgåvan. Packforsk: Kista, 2000.
5. Sörås A, Erlöv L, Löfgren C. Packaging and the Prevention of Environmental Impact Report No. 194. Packforsk: Kista, 2000.
6. Harckham A. (ed), Packaging Strategy: Meeting the Challenge of Changing Times. Technomic: Lancaster, PA, 1989.
7. Chatham House Forum. Navigating Uncharted Waters. Royal Institute of International Affairs: London, 1997.
8. Johansson A, Nordin J, Ählman J. Förpackningens affärsstrategiska betydelse–Förpackningsstrategier och
förpackningen som konkurrensmedel. Packforsk report No. 188. Packforsk: Kista, 1999.
9. Kaplan R, Norton D. The Balanced Scorecard– Translating Strategy into Action. Harvard Business School Press: Boston, MA, 1996.
10. Pratsch L, Ustad I. Guide to Balanced Scorecard Per-formance Management Methodology. Procurement Executives’ Association: Washington, DC, 1996. 11. Dominic C, Olsmats C. Packaging Scorecard–A
Method to Evaluate Packaging Contribution in the Supply Chain. Packforsk Research Report No. 200. Packforsk: Kista, 2001.
12. Lorentzon A, Olsmats C. Integration of the Package with the Distribution – A case study. Packforsk Research Report No. 155. Packforsk: Kista, 1992. 13. Henriksson L. Packaging Requirements in the
Swedish Retail Trade. Thesis for the degree of Licentiate in Engineering, Department of Engineer-ing Logistics, Lund University, 1998.