Coverage and Rate Analysis for Massive
MIMO-enabled Heterogeneous Networks with
Millimeter wave Small Cells
Anum Umer
∗, Syed Ali Hassan
∗, Haris Pervaiz
†, Qiang Ni
†and Leila Musavian
‡∗
School of Electrical Engineering & Computer Science (SEECS), National University of Sciences & Technology
(NUST), Islamabad, Pakistan 44000, {aumer.msee15seecs, ali.hassan}@seecs.edu.pk
†
School of Computing & Communications, Lancaster University, UK {h.pervaiz, q.ni}@lancaster.ac.uk
‡School of Computer Science and Electronics Engineering, University of Essex, UK [email protected]
Abstract—The existing cellular networks are being modified under the umbrella of fifth generation (5G) networks to provide high data rates with optimum coverage. Current cellular systems operating in ultra high frequency (UHF) bands suffer from severe bandwidth congestion hence 5G enabling technologies such as millimeter wave (mmWave) networks focus on significantly higher data rates. In this paper, we explore the impact of co-existance of massive Multiple-Input Multiple-Output (MIMO) that provides large array gains and mmWave small cells on coverage. We investigate the downlink performance in terms of coverage and rate of a three tier network where a massive MIMO macro base stations (MBSs) are overlaid with small cells operating at sub-6GHz and mmWave frequency bands. Based on the existing stochastic models, we investigate user association, coverage probability and data rate of the network. Numerical results clearly show that massive MIMO enabled MBSs alongside mmWave small cells enhance the performance of heterogeneous networks (HetNets) significantly.
Index Terms—Heterogeneous networks, 5G cellular networks, Millimeter wave, sub-6GHz bands, massive MIMO, stochastic geometry.
I. INTRODUCTION
Over the years, the data rate demands have increased im-mensely and the exponential growth in traffic calls for making use of higher frequency bands in addition to conventional sub-6GHz bands. The upcoming 5G technology is thought of, by researchers, as a mixture of multiple network tiers of variable sizes, transmit powers, range, operating frequencies, making a heterogeneous network (HetNet). 5G promises wide range of applications alongside high data rates but existing cellular infrastructure works on sub-6GHz bands, which is unable to meet the 5G data demands. However, millimeter wave (mmWave) communication base stations (BSs) operating at 10 to 300 GHz frequency bands with bandwidths up to 2 GHz and multiple antenna arrays at sub-6GHz BSs providing high array gains are seen as key enablers of 5G communication providing high coverage and data rates.
The HetNets, massive Multiple-Input Multiple-Output (MIMO) and mmWave cells have gathered researchers atten-tion and a lot of work is being done on their performance. For instance, [1] proposed stochastic geometry-based model for mmWave network to analyse coverage and rate trends, effects
of antenna pattern and blockages by deploying BSs using a Poisson point process (PPP) model. Authors in [2] analysed performance of mmWave hybrid networks based on simulation models. The massive MIMO has been investigated in [3], it presents results for achievable rate in uplink network scenario for MIMO at BSs, the authors investigated user association for massive MIMO HetNets in [4] and [5] stochastically modelled user association and coverage for K-tier HetNet with massive MIMO in macro tier.
Though the aforementioned literature clearly explains the efficiency of mmWave networks in providing better coverage than UHF networks and that of massive MIMO in providing large array gains, an analytical approach to investigating the impact of co-existence of massive MIMO and mmWave cells on user association, coverage and rate in a HetNet has not been explored yet. This paper deals with extending existing stochas-tic geometry models for analysis of 3-tier network composed of massive MIMO enabled sub 6-GHz macro cells overlaid with mmWave and sub 6-GHz small cells. We analyse network performance in terms of user association, network coverage and data rate. To the best of our knowledge, no prior work has investigated network performance of mmWave small cells coexisting with traditional heterogeneous networks while as-suming Nakagami fading model for mmWave communication and massive MIMO enabled macro BSs (MBSs). We deploy N antennas at each macro cell BS which simultaneously transmit data streams to S users using linear zero-forcing beamforming. The mmWave and sub-6GHz small cells BS are deployed at higher density than MBSs and user association, coverage and rate trends are discussed.
II. SYSTEMMODEL
We consider the downlink transmission scenario of a three-tier HetNet comprising of sub-6GHz macro cells overlaid with small cells operating at sub-6GHz and mmWave frequency band. The BSs of kth tier are uniformly distributed as Ho-mogeneous Poisson Point Process (HPPP) Φk with density
λk where k = {1,2,3}. The users are also assumed to be uniformly distributed as HPPP Φu with density λu. The sub-6GHz small cells constitute tier 2 while tier 3 constitutes
small cells operating at mmWave frequency band. Massive MIMO is implemented at the macro cells where N antennas are installed at each MBS which simultaneously transmit to
S users such thatN S ≥1 [6]. The sub-6GHz small cell BSs, mmWave BSs and users are single antenna nodes. Zero forcing beamforming is used by each MBS for transmitting
S data streams with equal power assignment. Transmission is taken to be time-division duplex (TDD) and it is assumed that downlink channel state information is known at the MBS [5]. Analysis is performed for a typical user located at the origin, in accordance with Slivnyak’s Theorem. The mmWave small cells can have either line of sight (LoS) or Non-line of sight (NLoS) link to the typical user. Hence we split Φ3,
by applying independent thinning theorem, to ΦL
3 and ΦN3
as point processes of LoS and NLoS mmWave small cells, using LoS probability function p(R), to evaluate that a link of length Ris LoS or NLoS [1]. Thus, ΦL
3 andΦN3 have the
densities p(R)λ3 and(1−p(R))λ3, respectively, whilep(R)
is discussed in Section II-C. A. Downlink User Association
An open access scheme has been assumed such that user is allowed to connect to any tier BS. We assume user association is based on maximum average received power.
The average received power at a user associated with MBS
j(j∈φ1)is given as, Pr,1=GM
P1
S Lj,M(x), (1)
whereP1 is MBS’s transmit power,Lj,M(x) =x−α1 is path loss function where α1 is path loss exponent and GM =
N −S + 1 is the array gain for zero forcing beamforming transmission [6]. It is evident from (2) that the array gain of massive MIMO macro cell tier has a prominent impact on user cell association. The average received power in case the user is associated with small cell tier iBS is,
Pr,i=PiLi(x), where i={2,3}, (2) where Pi is small cell BS transmit power in the ith tier and
Li(x) =x−iαi is small cell path loss function with path loss exponentαi.
B. Channel Model
We assume independent and identically distributed (i.i.d) Rayleigh fading channel for sub-6GHz links and independent Nakagami fading for mmWave links. The SINR of a typical user located at a distance x associated with the MBS is represented as SINRuM = P1 S ho,MLo,M(x) σ2+P j∈Φ1\bo,M P1 S hj,MLj,M(xj) +IS , (3) such that IS =Pq∈Φ2PqhqLq(xq) is inter cell interference
from the small cell operating in sub-6GHz band except the serving BS bo,M, whilehq ∼exp(1)is the small scale fading gain from the interfering channel. Similarly, xq is distance between the typical user and small cell BSq,ho,M ∼Γ(N−
S+ 1,1) is the small scale fading gain of the typical user at
the distancexfrom the serving BS andhj,M ∼Γ(S,1)[6],xj is distance between typical user and MBS j,Lq(xq) =x−qα2 andσ2 is the noise power.
Similarly, the SINR of a typical user located at the distance
xassociated with the sub-6GHz small cell is represented as
SINRuS = P2ho,SLo,S(x) σ2+I M+ P q∈Φ2\bo,SP2hq,SLq,S(xq) , (4) whereIM=P j∈Φ1 Pj
ShjLj(xj)is intercell interference from macro cells , Lq,S(xq) = xq−α2 andLo,S(x) = x−α2. Here,
hq∼exp(1)is the small scale fading gain from the interfering channel and xq is the distance of the typical user from small cell BS q. Similarly, ho,S ∼exp(1) is the small scale fading gain of the typical user at the distance x from the serving BS whilehj is small scale fading power gain such thathj ∼
Γ(S,1). Here,xj is distance of the user from MBSj. The SINR for the typical user associated with mmWave small cell is represented as
SINRm=
P3MrMtho,mLo,m(x)
σ2+P
3Pj∈L,NPi∈Φ3\bo,mGlhi,mLi,m(xi)
,
(5) whereLo,S(x) =x−α3,ho,mis small scale fading gain where different Nakagami fading parameters are taken for LoS and NLoS links,MrandMtare the main lobe gains of the transmit and receive antennas, j ∈ {L, N} identifies the interfering link as either LoS (L) or NLoS (N) andGl is the directivity gain of interfering BSs. It is assumed that both the BSs and the users are in perfect alignment with each other so the directivity gain of the desired link signal is given by MrMt. Beam direction is assumed to be independently and uniformly distributed between (0,2π]. Hence Gl for l = {1,2,3,4} is given as, Gl= ai=MrMt with prob. pi= (θ2rπ2θπt) ai=Mrmt with prob. pi= (2θπr(1− θt 2π)) ai=mrMt with prob. pi= ((1−2θrπ)2θπt) ai=mrmt with prob. pi= ((1−2θπr)(1−2θπt)). C. Blockage Model
A stochastic blockage model is assumed for mmWave small cells, where blockages are modeled as a rectangle Boolean scheme, based on random shape theory. On the basis of this scheme, LoS probability function p(R) is given by, p(R) = e−βR where R is the link distance and β is dependent on statistics of blockages. The LoS probabilities for various links are assumed to be independent.
III. PERFORMANCEANALYSIS
In this section, we perform stochastic modeling of typical user association probability for each tier followed by coverage and rate analysis of proposed network scenario.
A. Association Probability per Tier
1) Sub-6GHz Macro Cell tier: The association probability that a user is connected to MBS is given by,
A1= 2πλ1 Z ∞ 0 xexp −πλ2 P2Sxα1 P1(N−S+ 1) 2/α2 −πλ1x2−2πλ3 P 3S P1(N−S+ 1) 2/α3 L(x) dx, (6)
whereL(x)is given by,
L(x) = Z 4N(x) 0 tp(t)dt+ Z 4L(x) 0 t(1−p(t))dt, (7) where 4N(x) = xαN/αL and 4L(x) = xαL/αN. L(x) is based on the independent thinning ofφ3 with LoS probability
function p(R), as described in section II. The probability density function of users distance to serving MBS,fX1(x),is
given as, fX1(x) = 2πλ1 A1 xexp −πλ2 P2Sxα1 P1(N−S+ 1) 2/α2 −πλ1x2−2πλ3 P 3S P1(N−S+ 1) 2/α3 L(x) . (8)
2) Sub-6 GHz Small Cell tier: The association probability that a user is connected to sub-6GHz small cell BS is given by, A2= 2πλ2 Z ∞ 0 xexp −πλ2x2−2πλ3L(x)− πλ1 P 1(N−S+ 1)xα2 P2S 2/α1 dx, (9)
whereL(x)is given by (8). The probability density function of users distance to serving sub-6GHz small cell BS,fX2(x),is
given as, fX2(x) = 2πλ2 A2 xexp −πλ2x2−2πλ3L(x)− πλ1 P1(N−S+ 1)xα2 P2S 2/α1 . (10)
3) mmWave Small Cell tier: The association probability that a user is connected to mmWave small cell BS is given as
A3= 1−
X
k∈1,2
Ak. (11)
The probability of associating with NLoS link is given by,
AN = ΛN R∞ 0 exp n −2πλ3 R4N(x) 0 tp(t)dt o fN(x)dx [1]. Thus, the probability of associating with LoS link is AL =
1−AN. Here, fN(x) is probability density function of the distance of the typical user to the NLoS BS given by,fN(x) =
2πλ3x(1−p(x))exp(−2πλ3
Rx
0 t(1−p(t))dt)/ΛN and for LoS
link, fL(x) = 2πλ3xp(x)exp(−2πλ3 Rx 0 tp(t)dt)/ΛL [Eq. 4 of [1]], where ΛN = 1 −exp −2πλ3 R∞ 0 t(1−p(t))dt
is probability of user having at least one NLoS link, likewise, ΛL = 1 − exp
−2πλ3
R∞
0 tp(t)dt for LoS
link. PDF of the distance of user to serving BS given it is associated with LoS BS is fˆL(x) =
ΛLfL(x) AL exp n −2πλ3 R4L(x) 0 t(1−p(t))dt o
and for NLoS linkfˆN(x) = ΛNfN(x) AN exp n −2πλ3 R4N(x) 0 tp(t)dt o . B. Coverage Probability
Coverage probability is the measure that the received SINR at a typical user is higher than a certain threshold, Mathemat-ically PCk(Γ) =Pr(SINRk >Γ) = Z ∞ 0 Pr(SINRk >Γ|Xk =x)fXk(x)dx = Z ∞ 0 Pk(Γ, x)fXk(x)dx where k={1,2}. (12) The total SINR coverage probability,PC, is calculated using law of total probability as
PC=
3
X
r=1
PCrAr. (13)
The coverage probability for a user associated with MBS is given by, P1(Γ, x) = N−S X l=0 (xα1)l (l!)(−1)l X l! l Y j=1 nj!(j!)nj ×exp −Γσ 2Sxα1 P1 −Ξ ΓSxα1 P1 l Y j=1 (Ψ(j)(xα1))nj, (14) whereΞ(.)andΨ(j)(.)is given as,
Ξ(q) = 2πλ1 S X z=1 S z P 1 S z qz (−q P1 S ) −z+ 2 α1 α1 ! B(−qP1 Sx−α1) z− 2 α1 ,1−S + 2πλ2qP2 (J(x)) 2−α2 α2 α2−2 2F1 α 2−2 α2 ,1; 2− 2 α2 ;−qP2(J(x))−1 , (15) Ψ(1)(i) =−Γσ 2Sxα1 P1 −2πλ1SΓ x2−α1 α1−2 2F1 α 1−2 α1 , S+ 1; 2− 2 α1 ;−iΓx−α1 −2πλ2 ΓS P1 (J(x)) 2−α2 α2 α2−2 2 F1 α 2−2 α2 ,2; 2− 2 α2 ;−iΓS P1 P2(J(x))−1 , (16) Ψ(j)(i) = 2πλ1(−Γ) 2 α1 (S+j−1)! (S−1)! (i)−j+α21 α1 B(−Γix−α1) j− 2 α1 ,1−S−j + 2πλ2(j!) (i)−j+α21 α1 −ΓSP2 P1 α21 B (−P2ΓPSi1(J(x)) −α1 α2 ) j− 2 α1 ,−j , (17) whereJ(x) = P2Sxα1 (N−S+1)P1 .
The coverage probability for a user associated with sub-6GHz small cell tier is given as,
P2(Γ, x) =exp −Γσ 2xα2 P2 −2πλ1 S X z=1 S z P1Γxα2 SP2 z ×(− Γxα2P1 SP2 ) −z+ 2 α1 α1 BP 1 Γxα2 SP2 (H(x)) −1 z− 2 α1 ,1−S − 2πλ2Γxα2 x2−α2 α2−2 ×2F1 α 2−2 α2 ,1; 2− 2 α2 ;−Γ , (18) whereH(x) =N−SPS+1 2 P1x α2
. The proof can be found on similar lines as mentioned in [5] and is omitted here due to the space limitation.
The coverage probability for a user associated with mmWave small cell is given by,
PC3(Γ) =ALP3,L(Γ) +ANP3,N(Γ), (19)
whereP3,LandP3,N are given as,
P3,L≈ NL X j=1 (−1)j+1 N L j × Z ∞ 0 exp −jη LxαLΓσ2 MrMt −Cj(Γ, x)−Dj(Γ, x) ˆ fL(x)dx, and P3,N ≈ NN X j=1 (−1)j+1 N N j × Z ∞ 0 exp −jη NxαNΓσ2 MrMt −Ej(Γ, x)−Vj(Γ, x) ˆ fN(x)dx. where Cj(Γ, x) = 2πλ3 4 X i=1 pi Z ∞ x F NL, jηLaˆiΓxαL NLtαL p(t)tdt, Dj(Γ, x) = 2πλ3 4 X i=1 pi Z ∞ 4L(x) F NN, jηLˆaiΓxαL NNtαN (1−p(t))tdt, Ej(Γ, x) = 2πλ3 4 X i=1 pi Z ∞ 4N(x) F NL, jηNaˆiΓxαN NLtαL p(t)tdt, Vj(Γ, x) = 2πλ3 4 X i=1 pi Z ∞ x F NN, jηNˆaiΓxαN NNtαN (1−p(t))tdt, and F(N, x) = 1−1/(1 +x)N. Here η L = NL(NL!) − 1 NL andηN =NN(NN!) − 1 NN. Parameteraˆi=ai/MrMt,ai and
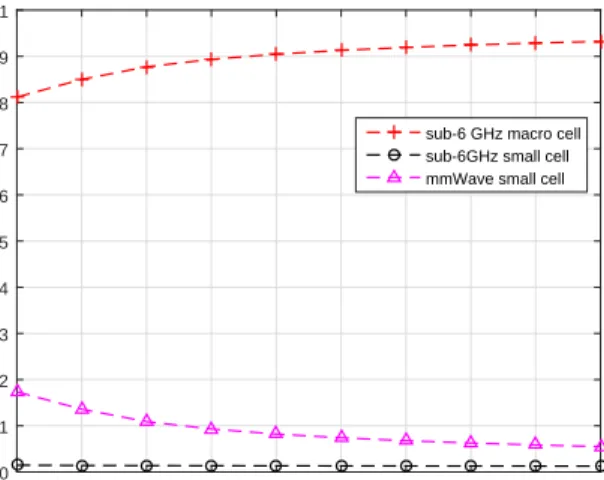
piare defined in Section II. The proof can be found on similar lines as mentioned in [1] and is omitted here due to the space limitation. N 100 200 300 400 500 600 700 800 900 1000 Association Probability 0 0.1 0.2 0.3 0.4 0.5 0.6 0.7 0.8 0.9 1
sub-6 GHz macro cell sub-6GHz small cell mmWave small cell
Fig. 1. Association probability versesN withλ2=λ3= 30λ1 andS= 5
C. Rate Coverage Probability
We define the instantaneous downlink coverage rate for typical user such that the rate is higher than a certain threshold for an associated tierkdefined as
RkC =Pr(Ratek> ρ) =Pr(W log(1 +SINRk)> ρ)
=Pr(SINRk >2 ρ W −1) =Pk C(2 ρ W −1), (20) whereW is the total available bandwidth at the BS.
IV. SIMULATION ANDNUMERICALRESULTS
A 3-tier HetNet is taken with MBS densityλ1= (250000× π)−1, λ2 and λ3 are taken multiples of MBS density. The
sub-6GHz tiers are assumed to be operating at 1GHz carrier frequency, W = 10MHz, path loss exponents α1 = 3.5, α2= 4 and transmit power P1 = 46dBm and P2 = 30dBm,
respectively. Likewise for mmWave tier, the operating fre-quency is 28GHz, W = 100MHz, path loss exponent for LoS αL = 2 and for NLoS αN = 4 and transmit power
P3= 30dBm. Nakagami fading parameters for mmWave tier, NN and NL, are assumed to be positive integers, 2 and 3, respectively. Array gains for all angles in main lobe are taken
Mr= 10dB,Mt= 10dB and for the side lobesmr=−10dB,
mt= 0dB. Main lobe beamwidth is taken to beθr= 90◦and
θt= 30◦. Noiseσ2 =−90dBm is taken with noise figure of 10dB. For the LoS probability functionp(R) =e(−βR),β is takes as1/β= 141.4 meters.
In Fig. 1 we observe the effect of increasing the number of antennasN on association probability of each tier and see that association with macro BSs is directly proportional to the number of antennas on each BS and it prominently effects the user association with other tiers. This can be attributed to the higher array gains because of higher antenna density at macro BSs. Other reason is that macro BSs have greater transmit power than small cell BSs. After macro BSs most of the load is managed by mmWave BSs due to their favourable SINR distribution and larger available bandwidth compared to the sub-6GHz small cell BSs.
SINR Threshold
-20 -15 -10 -5 0 5 10 15 20
SINR Coverage Probability
0.4 0.5 0.6 0.7 0.8 0.9 1 Simulation λ 2=λ3=30λ1 Analytical λ 2=λ3=30λ1 Simulation λ 2=λ3=5λ1 Analytical λ 2=λ3=5λ1
Fig. 2. SINR coverage probabilityPC(Γ)verses SINR thresholdΓforN= 4 andS= 2
SINR Threshold
-20 -15 -10 -5 0 5 10 15 20 25 30
SINR Coverage Probability
0 0.1 0.2 0.3 0.4 0.5 0.6 0.7 0.8 0.9 1 Simulation λ 2=30λ1 Analytical λ 2=30λ1 Simulation λ 2=λ3=30λ1 Analytical λ 2=λ3=30λ1
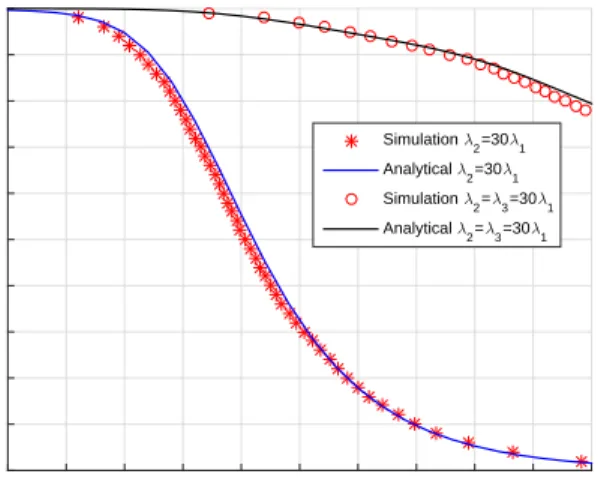
Fig. 3. SINR coverage probabilityPC(Γ)verses SINR thresholdΓforN= 4 andS= 2
Fig. 2 shows the network coverage probability PC for different small cell BS densities and we observe that as small cell BS density increases, more users are offloaded to small cells and it significantly improves the SINR coverage of the network. Since small cells operate at lower power this may lead to power efficient network where high power macro BS have lower traffic but it comes at the cost of high small cell BS deployment. The macro cells may serve to provide better coverage at cell edges but within them small cells provide better coverage. Moreover, it can be observed that simulation results and analytical results are tightly bound to each other that validates the model.
Fig. 3 compares network coverage probability of 2-tier net-work with sub-6GHz macro and small cells and 3-tier netnet-work. We see that the mmWave tier has significant contribution to SINR coverage probability. This can be attributed to the favourable SINR distribution, larger available bandwidth and higher density of mmWave cells. Macro cells may serve to provide better coverage at cell edges but within them small
Acheivable rate in Mbps
0 50 100 150 200 250 300
Rate coverage probability
0.4 0.5 0.6 0.7 0.8 0.9 1 λ 2=λ3=30λ1 λ 2=λ3=5λ1
Fig. 4. Rate coverage probabilityRCverses rate thresholdρforN= 4and
S= 2
cells provide better coverage. Moreover, it can be observed that simulation results and analytical results are tightly bound to each other that validates the model.
In Fig. 4 we observe that as the small cell BS density increases, rate increases drastically. This is due to the fact that small cell BSs form better links to the users when their deployment density is high and users associated with mmWave small cells have greater allocated bandwidth.
V. CONCLUSION
In this paper, 3-tier HetNet coverage and rate is anal-ysed with massive MIMO at macro tier. User association is performed based on maximum received power and effect of massive MIMO and mmWave BS density on the user cell association is investigated. It has been observed that the implementation of massive MIMO on macro tier and deployment of high density of mmWave small cells leads to significant enhancement of rate and coverage. Moreover, numerical results showed that on increasing number of anten-nas at macro BS, user association is biased towards macro tier, leading to low demand of small cells that simplifies the network.
REFERENCES
[1] R. W. Heath and T. Bai, “Coverage and rate analysis for millimeter-wave cellular networks, ”IEEE Trans. Wireless Commun., vol. 14, no. 2, pp. 1100-1114, 2015.
[2] M. S. Omar, M. A. Anjum, S. A. Hassan, H. Pervaiz and Q. Ni, “Per-formance analysis of hybrid 5G cellular networks exploiting mmWave capabilities in suburban areas,”IEEE Int. Conf. Commun. (ICC), pp. 1-6, 2016.
[3] E. G. Larsson, H. Q. Ngo and T. L. Marzetta, “The multicell multiuser mimo uplink with very large antenna arrays and a finite-dimensional channel,”IEEE Trans. Commun., vol. 61, no. 6, pp. 2350-2361, 2013. [4] H. C. Papadopoulos, D. Bethanabhotla, O. Y. Bursalioglu and G. Caire,
“Optimal user-cell association for massive mimo wireless networks,” IEEE Trans. Wireless Commun., Vol.15, pp. 1835 - 1850, 2016. [5] Y. Chen, M. Elkashlan, A.He, L.Wang and K-K.Wong, “Massive mimo
in k-tier heterogeneous cellular networks: Coverage and rate,” Proc. IEEE Global Telecommun. Conf. (GLOBECOM), pp. 1-6, 2015. [6] W. Yu, K. Hosseini and R. S. Adve, “Large-scale mimo versus
net-work mimo for multicell interference mitigation,” IEEE J. Sel. Areas Commun, vol. 8, no. 5, pp. 930-941, Oct. 2014.