New Jersey Institute of Technology
Digital Commons @ NJIT
Theses Theses and Dissertations
Spring 2016
Gene network understanding and analysis
Maria E. Somoza
New Jersey Institute of Technology
Follow this and additional works at:https://digitalcommons.njit.edu/theses
Part of theBioinformatics Commons, and theComputer Sciences Commons
This Thesis is brought to you for free and open access by the Theses and Dissertations at Digital Commons @ NJIT. It has been accepted for inclusion in Theses by an authorized administrator of Digital Commons @ NJIT. For more information, please [email protected].
Recommended Citation
Somoza, Maria E., "Gene network understanding and analysis" (2016).Theses. 279.
Copyright Warning & Restrictions
The copyright law of the United States (Title 17, United
States Code) governs the making of photocopies or other
reproductions of copyrighted material.
Under certain conditions specified in the law, libraries and
archives are authorized to furnish a photocopy or other
reproduction. One of these specified conditions is that the
photocopy or reproduction is not to be “used for any
purpose other than private study, scholarship, or research.”
If a, user makes a request for, or later uses, a photocopy or
reproduction for purposes in excess of “fair use” that user
may be liable for copyright infringement,
This institution reserves the right to refuse to accept a
copying order if, in its judgment, fulfillment of the order
would involve violation of copyright law.
Please Note: The author retains the copyright while the
New Jersey Institute of Technology reserves the right to
distribute this thesis or dissertation
Printing note: If you do not wish to print this page, then select
“Pages from: first page # to: last page #” on the print dialog screen
The Van Houten library has removed some of the
personal information and all signatures from the
approval page and biographical sketches of theses
and dissertations in order to protect the identity of
NJIT graduates and faculty.
ABSTRACT
GENE NETWORK UNDERSTANDING AND ANALYSIS by
Maria E. Somoza
Gene regulatory network (GRN) is a collection of regulators that interact with each other in the cell to govern the gene expression levels of mRNA and proteins. These regulators can either be DNA, RNA, protein and their complex. Transcriptional gene regulation is an important mechanisms in which an in-depth study can lead to various practical applications, and a greater understanding of how organisms control their cellular behavior. One of the most widely studied organisms in gene regulatory networks are the
Mycobacterium tuberculosis and Corynebacterium glutamicum ATCC 13032.
Gene co-expression networks are of biological interests due to co-expressed genes which are controlled by the same transcriptional regulatory programs, as well as, studying the functionality of genes in a system-level. Correlation networks are increasingly being used in research applications, especially in the field of bioinformatics. It facilitates networks based on gene screening methods which can be used to identify biomarkers or therapeutic targets. Computational methods use for the development of network models, as well as, the analysis of their functionality proved to be of valuable resources.
GENE NETWORK UNDERSTANDING AND ANALYSIS
by Maria E Somoza
A Thesis
Submitted to the Faculty of New Jersey Institute of Technology
In Partial Fulfillment of the Requirements for the Degree of Master of Science in Bioinformatics
Department of Computer Science May 2016
APPROVAL PAGE
GENE NETWORK UNDERSTANDING AND ANALYSIS
Maria E. Somoza
−−−−−−−−−−−−−−−−−−−−−−−−−−−−−−−−−−−−−−−−−−−−−−−−−−−−−−−−−−−−−−
Dr. Jason T. L. Wang, Master Thesis Advisor Date
Professor of Bioinformatics and Computer Science
−−−−−−−−−−−−−−−−−−−−−−−−−−−−−−−−−−−−−−−−−−−−−−−−−−−−−−−−−−−−−−−
Dr. Usman W. Roshan, Committee Member Date Associate Professor of Computer Science
−−−−−−−−−−−−−−−−−−−−−−−−−−−−−−−−−−−−−−−−−−−−−−−−−−−−−−−−−−−−−−−−−−−−−−−−−−−−−−−−−−−−−−−−−−−−−
Dr. Zhi Wei, Committee Member Date
BIOGRAPHICAL SKETCH
Author: Maria E. Somoza
Degree: Master of Science
Date: May 2016
Undergraduate Education:
• Master of Science in Bioinformatics
New Jersey Institute of Technology, Newark, NJ 2016
• Bachelor of Arts in Biology
New Jersey City University, Jersey City, NJ, 2008
Major: Bioinformatics
v
I dedicate this thesis to my family, my husband and
vi
ACKNOWLEDGEMENT
With deepest gratitude to my advisor Dr. Jason T. L.Wang for his valuable advice and help throughout my research. I would like to thank my Committee Members, Dr. Usman W. Roshan and Dr. Zhi Wei, for their participations. Also like to thanks those students, such as Nihir Patel, who have given me advice while doing this research.
vii
TABLE OF CONTENTS
Chapters Page
1 INTRODUCTION……….. 1
1.1 Objective……….. 1
1.2 Information about the CMNR Species………. 2
1.3 Understanding Transcriptional Regulatory Networks……….. 2
2 DATABASE AND SOFTWARES USED……… 6
2.1 Datasets and Normalization for M. Tuberculosis and C. Glutamicum ATCC 13032……… 6
2.2 Software for Visualization……… 6
2.3 Programming Tool……… 6
3 IMPLEMENTATION……… 12
3.1 Methods for Gene Co-expression Networks……… 12
3.2 Measurements……….. 14
3.3 Results……….. 15
4 CONCLUSIONS……… 19
viii
LIST OF TABLES
Table Page
1.1 Mycobacterium tuberculosis Transcription Regulatory Network……….. 4 2.1 Participating Datasets………. 7 3.1 Q-value Scores for Each Organisms………. 15
1.2 Supplementary Table………. 20
ix
LIST OF FIGURES
Figures Page
1.1 Regulatory Networks Image of Corynebacterium glutamicum ATCC
13032……… 5
2.1 Images of Yeast Sporulation (Aracne)……….. 8
2.2 Images of Yeast Cell Cycle (Context Likelihood of Relatednesss)…….. 8
2.3 Images of Yeast KY (Biweight Midcorrelation (Bicor))………. 9
2.4 Images of GDS825 (Human)
(
MINE)……….. 92.5 Images of GDS958 (Mouse) (MRNET)……….. 10
2.6 Images of GDS3702 (Rat) (Cor- Pearson Correlation)……… 10
2.7 Images of Thaliana (WGCNA)………. 11
3.1 Bar graphs………. 16
3.2 Heatmap/clustering images………... 17
A.1 Images of Yeast Sporulation (Biweight Midcorrelation (Bicor))……… 21
A.2 Images of Yeast Sporulation (Context Likelihood of Relatedness)……. 21
A.3 Images of Yeast Sporulation (Cor- Pearson Correlation Coefficient)….. 22
A.4 Images of Yeast Sporulation (MINE)………... 22
A.5 Images of Yeast Sporulation (MRNET)………... 23
A.6 Images of Yeast Sporulation (WGCNA)……….. 23
B.1 Images of Yeast Cell LCycle (ARACNe)………. 24
B.2 Images of Yeast Cell Cycle (Biweight Midcorrelation (Bicor))………... 24
B.3 Images of Yeast Cell Cycle (Cor- Pearson Correlation)………... 25
x
LIST OF FIGURES (Continued)
Figures Page
B.5 Images of Yeast Cell Cycle (MRNET)………. 26
B.6 Images of Yeast Cell Cycle(WGCNA)……… 26
C.1 Images of YeastKY (ARACNe)………... 27
C.2 Images of Yeast KY
(
Context Likelihood of Relatedness)……….. 27C.3 Images of Yeast KY
(
Cor- Pearson Correlation)………. 28C.4 Images of Yeast KY
(
MINE)………... 28C.5 Images of Yeast KY
(
MRNET)………... 29C.6 Images of YeastKY (WGCNA)……… 29
D.1 Images of GDS825 (Human) (ARACNe)………. 30
D.2 Images of GDS825 (Human) (Biweight Midcorrelation)………. 30
D.3 Images of GDS825 (Human) (Context Likelihood of Relatedness)……. 31
D.4 Images of GDS825 (Human) (Cor-Pearson Correlation)………. 31
D.5 Images of GDS825 (Human) (MRNET)……….. 32
D.6 Images of GDS825 (Human)(WGCNA)………. 32
E.1 Images of GDS958 (Mouse)
(
ARACNe)………. 33E.2 Images of GDS958 (Mouse)
(
Biweight Midcorrelation)………. 33E.3 Images of GDS958 (Mouse)
(
Context Likelihood of Relatedness)……. 34E.4 Images of GDS958 (Mouse)
(
Cor- Pearson Correlation)………. 34xi
LIST OF FIGURES (Continued)
Figures Page
E.6 Images of GDS958 (Mouse) (WGCNA)……….. 35
F.1 Images of GDS3702 (Rat) (ARACNe)………. 36
F.2 Images of GDS3702 (Rat) (Biweight Midcorrelation)………. 36
F.3 Images of GDS3702 (Rat) (Context Likelihood of Relatedness)………. 37
F.4 Images of GDS3702 (Rat) (MINE)………. 37
F.5 Images of GDS3702 (Rat) (MRNET)……….. 38
F.6 Images of GDS3702 (Rat) (WGCNA)……….. 38
G.1 Images of Thaliana
(
ARACNe)……… 39G.2 Images of Thaliana
(
Biweight Midcorrelation)……… 39G.3 Images of Thaliana(Context Likelihood of Relatedness)……… 40
G.4 Images of Thaliana (Cor- Pearson Correlation)……… 40
G.5 Images of Thaliana (MINE)……….. 41
1
CHAPTER 1 INTRODUCTION
1.1 Objective
The objective of this thesis is to present an analysis in gene regulatory networks and gene co-expression networks. Gene regulatory networks is represented as a directed graph connecting two genes. These connections represent a biochemical process such as: reaction, transformation, interaction, inhibition, or activation.
As for gene co-expression networks, the graph is represented as undirected, and the edges represent a correlation or dependency relationship among genes. The datasets used for gene co-expression networks are generated by high-throughput gene expression database such as microarray and RNA-Seq. Gene co-expression measures are often used to describe the network results among genes. The most widely used is Mutual
information (MI) for generalized correlation measure. Comparison of other co-
expression measures were used to find the biologically meaningful modules (clusters of genes) [12]. The following network measures were used: CLR, MRNET, ARACNE, BICOR, COR, MINE and WGCNA .
2
1.2 Information about the CMNR Species
Mycobacterium tuberculosis are intracellular pathogens that have evolved strategies for coping with the pressures encountered inside host cells. Mycobacterium tuberculosis is a devastating virulence that affects roughly 9 million new cases and 2 million deaths yearly[1]. Unfortunately, there’s not a lot is known about the dormant state of tuberculi bacilli in human infection. From published microarray data, researchers have assembled the largest M. tuberculosis transcriptional-regulatory network to date, and characterized the temporal response of this network during adaptation to stationary phase and
hypoxia[2].
C. glutamicum ATCC 13032 belongs to the CMNR group of family which
includes Mycobacterium, Nocardia, and Rhodococcus[9]. The members of this group are
Gram-positive bacteria that exhibit many unusual features such as : high G + C content, and a specific organization of the cell wall composed of mycolic acid, peptidoglycan and arabinolactano [9]. Some species of the CMNR group are important for industrial and biotechnological applications, such as Corynebacterium glutamicum and
Corynebacterium efficiens [9].These group of organisms consists of several bacterial species that are of medical, veterinary, and biotechnological interest.
1.3 Understanding Transcriptional Regulatory Networks To further understand the complex structure of transcriptional regulatory networks, well known model organisms such as E. coli, have been studied extensively to analyse the conservation patterns of this network across 175 prokaryotic genomes, and predict components of the regulatory networks for these organisms[6]. The first step toward understanding the regulatory network of this pathogen is the prediction of operons in Mycobacterium tuberculosis (MTB)[7].
3
According to Roback et al, a gene regulatory network consisting of 222 links among 216 genes based on MtbRegList (http://mtbreglist.genap.ca/MtbRegList/www/index.php) was developed , a database that lists the binding sites of 21 TFs and sigma factors. Next, a network of 159 links among 164 genes was included, based on recent studies on the transcriptional regulatory activity of mprA, dosR, Rv1395, Rv2358, furB, Rv0967, kstR,
pknH, embR, trcR, and crp. an M. tuberculosis TR network (223 links among 201 genes) inferred from gene orthology with 29 E. coli TFs and their targets were downloaded and included. Finally, the researchers completed the network based on the list of
Mycobacterium tuberculosis operons [7], assuming that if a TF regulates a gene within an operon, it also regulates all other gene members of the operon. Following a similar
procedure, a separate assembled network was created, purely literature derived network, with 581 links among 518 genes that should have higher confidence than those in the full network [2].
4
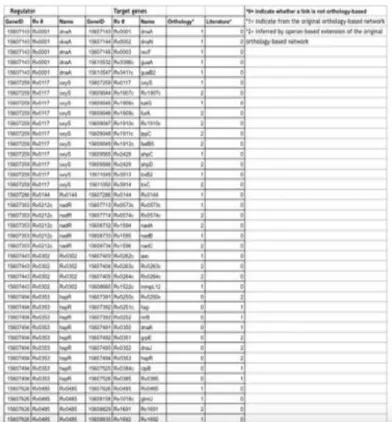
Table 1.1 Mycobacterium TuberculosisTranscription Regulatory Network
Source:Voskuil MI, Visconti KC, Schoolnik GK (2004) Mycobacterium tuberculosis gene expression during adaptation to stationary phase and low-oxygen dormancy. Tuberculosis (Edinb) 84: 218–227.
Table 1.1 shows the transcription regulatory network of M. tuberculosis where the numbers arerepresented as follows: 0 indicates whether a link is not orthology-based, but no gene to gene interaction, 1 indicate from the orthology-based network and gene to gene interaction, and 2 inferred by operon-based extension of the original orthology- based network.
Corynebacterium glutamicum ATCC 13032 is very well known in the industry in its production of the amino acids[8]. This is also use as a reference network to all other corynebacterium species, due to the fact that all experimental evidence was done on this particular species.
5
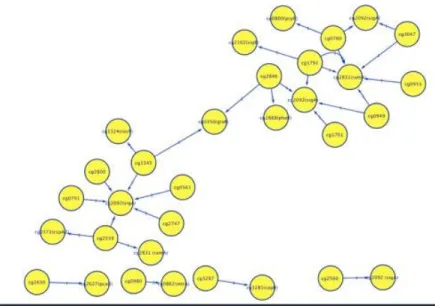
1.1 Regulatory Networks Image of Corynebacterium Glutamicum ATCC 13032
Figure 1.1 Is an image of a regulatory network of Corynebacterium glutamicum ATCC 13032 using Cytoscape. Genes with regulations and experimental evidence were
specifically chosen for the network.
Source: Abreu VA, Almeida S, Tiwari S, Hassan SS, Mariano D, Silva A, Baumbach J, Azevedo V, Rottger R (2015) CMRegNet-An interspecies reference database for corynebacterial and mycobacterial
regulatory networks. BMC Genomics 16:452. doi:10. 1186/ s12864-015-1631-0. http://www.lgcm.icb.ufmg.br/cmregnet/
The network shows gene to gene interactions as indicated by the arrow. In the experimental version, all transcriptional regulations are stored with experimental evidence[11].The interaction is represented by 1 means that genes are expressed when a gene is an activator , while a 0 (not shown on the image) means that genes are not expressed when a gene is a repressor.
6
CHAPTER 2
DATABASE AND SOFTWARES USED
2.1 Datasets and Normalization for M. Tuberculosis and C. Glutamicum ATCC 13032 The time course microarray data for Mycobacterium tuberculosis is the following GSE35362. This can be obtained from the database Gene Expression Omnibus
(http://www.ncbi.nlm.nih.gov)[6]. The transcriptional regulations in C. glutamicum ATCC 13032 which includes TFBS and regulation can be found in the following
reference databases CMRegNet (http://lgcm.icb.ufmg.br/cmregnet) and CoryneRegNet (http://coryneregnet.compbio.sdu.dk/v6/index.html) [9,11]. After processing the raw data of microarray datasets, the normalization procedure was executed in order to avoid
systematic biases due to the variation between different trials and samples. Robust multi- array average (RMA) was done using the justRMA function in the iffy package that is part of the BioConductor project in R [4].
2.2 Software for Visualization
Cytoscape is an open source software used for integrating biomolecular interaction networks using high-throughput data into a conceptual framework which can be downloaded in the following http://www.cytoscape.org[10].
2.3 Programming Tool
The R, or for an updated version, R Studio statistical programming language is an integrated suite of software facilities used for data manipulation, calculation, and graphical display. The software is freely available to download, www.r-project.org, it compile and runs on a wide variety of platforms such as UNIX, Windows, and MacOS.
7
The R language is similar to the S language which its environment was developed at the Bell Laboratories by John Chambers and colleagues.
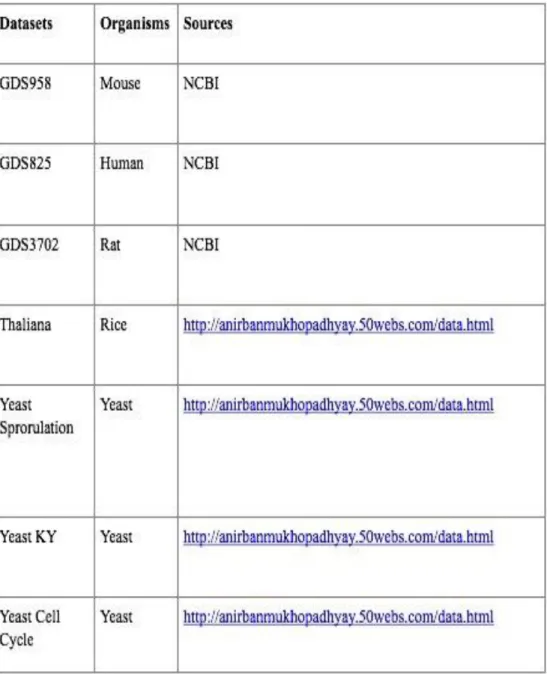
Table 2.1 Participating Datasets
Table 2.1shows the seven gene expression datasets that were included to compare the co-expression measures in order to define the networks among genes.
8
Figure 2.1 Images of Yeast Sporulation. (ARACNe) Source: Cytoscape 3.2.1
http://www.cytoscape.org
Figure 2.2 Images of Yeast Cell Cycle
. (
Context Likelihood of Relatedness)Source: Cytoscape 3.2.1 http://www.cytoscape.org
9
Figure 2.3 Images of Yeast KY. (Biweight Midcorrelation (Bicor))
Source: Cytoscape 3.2.1 http://www.cytoscape.org
Figure 2.4 Images of GDS825 (Human).
(
MINE- Maximal Information Coefficient)Source: Cytoscape 3.2.1 http://www.cytoscape.org
10
Figure 2.5 Images of GDS958 (Mouse).
(
MRNET)Source: Cytoscape 3.2.1 http://www.cytoscape.org
Figure 2.6 Images of GDS3702 (Rat). (Cor- Pearson Correlation)
Source: Cytoscape 3.2.1 http://www.cytoscape.org
11
Figure 2.7 Images of Thaliana. (WGCNA)
Source: Cytoscape 3.2.1 http://www.cytoscape.org
The network images of the seven gene expression datasets were done using the visual software Cytoscape. The images shows the comparison of the seven co-expression measures.
12
CHAPTER 3 IMPLEMENTATION
3.1 Methods for Gene Co-expression Networks
Context Likelihood of Relatedness (CLR) is an algorithm that uses mutual information in order to infer networks from steady-state. It forms a matrix of mutual information scores by calculating between each pair of genes in the network. This algorithm output only undirected edges because of their bidirectional nature of mutual information [15].
ARACNe (Algorithm for the Reconstruction of Accurate Cellular Networks) is a novel algorithm (information-theoretic) which is used for the reverse engineering of transcriptional networks from microarray data. In a biological context, the algorithm infers bona-fide transcriptional targets[3]. ARACNe begins by assigning to each pair of nodes a weight equal to the mutual information [14].
MRNET is an inference method using the maximum relevance/minimum redundancy (MRMR), which performs a series of supervised MRMR gene selection procedures where each gene in turn plays the role of the target output [15].
13
WGCNA (weighted gene correlation network analysis) is a method that can be used for finding clusters of highly correlated genes. By using the module eigengene or an intramodular hub gene in which clusters are summarized [13].
Bicor (biweight midcorrelation) is an alternative to Pearson correlation. Bicor measures the ‘similarity’ between gene expression profiles which provides approach for gene differential coexpression analysis [16].
MINE(maximal information-based nonparametric exploration) is a novel method which computes the MINE family measures between two variables. MIC
(maximal information coefficient) is one of five statistics that is part of MINE, which identify important relationships in data sets and characterize them as well. The method can be downloaded, http://www.exploredata.net/, and is also
available in R package ‘minerva’.
Cor (Pearson Correlation Coefficient) functions implements a faster calculation of Pearson correlation. A measure of the linear correlation between two variables, giving a value between +1 and -1 inclusive, where +1 is total positive correlation, 0 is no correlation, and -1 is total negative correlation
14
3.2 Measurements
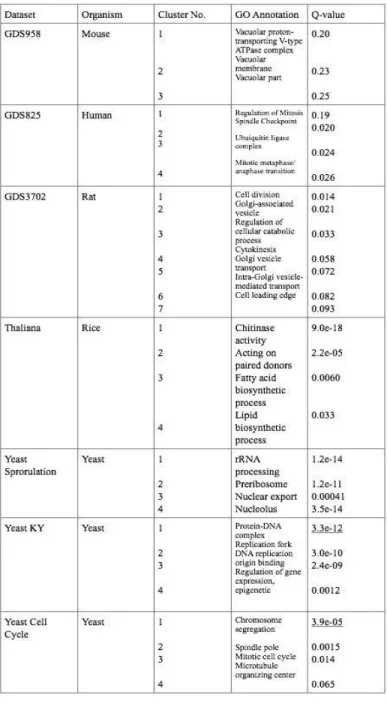
In orderto determine the biological significance of the clusters which comprises of all the genes participating in the co-expression network, Q-values was used against statistically significant GO terms validated by using the GO annotation database [17].
Q-value is the minimum False Discovery Rate (FDR) in which genes appears significant. Q values from an FDR corrected hypergeometric test for enrichment can be obtained using GeneMania, a plugin, from Cytoscape. P-value is the probability of obtaining a result equal to or more in an observed sample results.
15
3.3 Results
As an example shown in Table 3.1, cluster 1 shown from the Yeast KY network is responsible for Protein-DNA complex with a Q value of 3.3e-12. While on cluster 1 shown from the Yeast Cell Cycle is responsible for chromosome segregation with a Q value of 3.9e-0 being the highly enriched one.
Table 3.1 Q-value Scores for Each Organisms
16
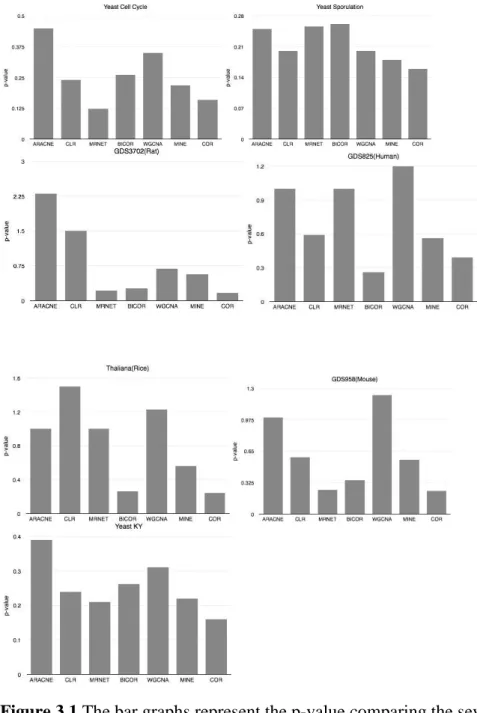
Figure 3.1 The bar graphs represent the p-value comparing the seven methods used on each seven datasets using the Pearson Correlation Coefficient measures in the minet Bioconductor package and WGCNA package. Aracne shows a better performance in most of the datasets.
Source: Meyer PE, Lafitte F, Bontempi G: minet: A R/Bioconductor Package for Inferring Large Transcriptional Networks Using Mutual Information, BMC Bioinformatics 2008, 9:461.
Figure 3.1 shows the Pearson Correlation Coefficient measures of the methods used. If the correlation coefficient is close to 1, it would indicates that the variables are positively linearly related. If the score is -1, it indicates that the variables are negatively linearly
17
related .A value of zero would indicate a weak linear relationship between the variables. This calculation was done using minet part of a bioconductor package in R[15] and WGCNA [13].
Figure 3.2 The images shows a heatmap/clustering of the gene expression of Mycobacterium tuberculosis using TM4:MeV.
Source: Rohde KH, Veiga DFT, Caldwell S., Balazsi G., Russell DG (2012) Linking the Transcriptional Profiles and the Physiological States of Mycobacterium tuberculosis during an Extended Intracellular Infection. PLoS Pathog 8(6): e1002769. doi:10.1371/journal.ppat.1002769.
18
Figure 3.2 is a heatmap/clustering image of the Mycobacterium tuberculosis of the log scaled time series set in {2 hours, 2 days, 4 days, 6 days, 8 days, 10 days, 12 days, 14 days}[1].
19 CHAPTER 4
4. CONCLUSIONS
In summary, genetic network analysis are used and compared to better understand the important of assessing each co-expression measures in terms of how the genes are connected and its correlation. And in terms of gene regulatory network, to better
understand the interaction of regulators among each other and other substances in the cell that governs the gene expression levels.
20
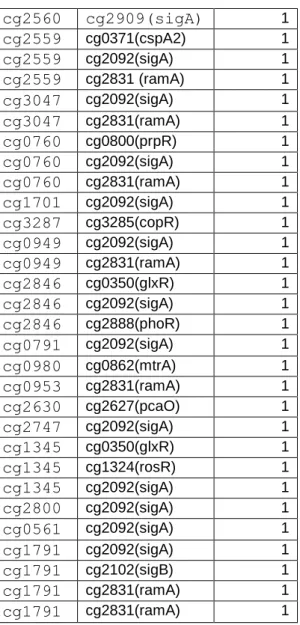
Table 1.2 is a supplementary table excel file of the transcriptional regulatory network of C. glutamicum ATCC 13032
Source: Abreu VA, Almeida S, Tiwari S, Hassan SS, Mariano D, Silva A, Baumbach J, Azevedo V, Rottger R (2015) CMRegNet-An interspecies reference database for corynebacterial and mycobacterial
regulatory networks. BMC Genomics 16:452. doi:10. 1186/ s12864-015-1631-0. http://www.lgcm.icb.ufmg.br/cmregnet/ cg2560 cg2909(sigA) 1 cg2559 cg0371(cspA2) 1 cg2559 cg2092(sigA) 1 cg2559 cg2831 (ramA) 1 cg3047 cg2092(sigA) 1 cg3047 cg2831(ramA) 1 cg0760 cg0800(prpR) 1 cg0760 cg2092(sigA) 1 cg0760 cg2831(ramA) 1 cg1701 cg2092(sigA) 1 cg3287 cg3285(copR) 1 cg0949 cg2092(sigA) 1 cg0949 cg2831(ramA) 1 cg2846 cg0350(glxR) 1 cg2846 cg2092(sigA) 1 cg2846 cg2888(phoR) 1 cg0791 cg2092(sigA) 1 cg0980 cg0862(mtrA) 1 cg0953 cg2831(ramA) 1 cg2630 cg2627(pcaO) 1 cg2747 cg2092(sigA) 1 cg1345 cg0350(glxR) 1 cg1345 cg1324(rosR) 1 cg1345 cg2092(sigA) 1 cg2800 cg2092(sigA) 1 cg0561 cg2092(sigA) 1 cg1791 cg2092(sigA) 1 cg1791 cg2102(sigB) 1 cg1791 cg2831(ramA) 1 cg1791 cg2831(ramA) 1 cg2560 cg0350 (glxR) 0 cg2560 cg0444(ramB) 0 cg2560 cg2831(ramA) 0 cg2559 cg0350(glxR) 0 cg2559 cg0444 (ramB) 0 cg3047 cg0350(glxR) 0 cg3047 cg0444(ramB) 0 cg3047 cg1120(ripA) 0 cg0760 cg0350(glxR) 0 cg1701 cg3253(mcbR) 0 cg0978 cg0979(-) 0 cg0949 cg0350(glxR) 0 cg0949 cg0444(ramB) 0 cg0791 cg0350(glxR) 0 cg0791 cg0444(ramB) 0 cg0953 cg0444(ramB) 0 cg2630 cg0350(glxR) 0 cg2630 cg2624(pcaR) 0 cg2747 cg0862(mtrA) 0 cg1345 cg1120(ripA) 0 cg1345 cg1340(arnR) 0 cg1746 cg2109(oxyR) 0 cg0469 cg2103(dtxR) 0 cg1791 cg0350(glxR) 0 cg1791 cg2115(sugR) 0
21
APPENDIX A
CO-EXPRESSION NETWORK IMAGES Figure A.1 to A.6 are network images of the Yeast Sporulation data.
Figure A.1 Images of Yeast Sporulation. (Biweight Midcorrelation (Bicor))
Source: Cytoscape 3.2.1 http://www.cytoscape.org
Figure A.2 Images of Yeast Sporulation. (Context Likelihood of Relatedness)
Source: Cytoscape 3.2.1 http://www.cytoscape.org
22
Figure A.3 Images of Yeast Sporulation. (Cor- Pearson Correlation Coefficient)
Source: Cytoscape 3.2.1 http://www.cytoscape.org
Figure A.4 Images of Yeast Sporulation. (MINE- Maximal Information Coefficient)
Source: Cytoscape 3.2.1 http://www.cytoscape.org
23
Figure A.5 Images of Yeast Sporulation. (MRNET)
Source: Cytoscape 3.2.1 http://www.cytoscape.org
Figure A.6 Images of Yeast Sporulation. (WGCNA)
Source: Cytoscape 3.2.1 http://www.cytoscape.org
24
APPENDIX B
Figure B.1 to B.6 are network images of Yeast Cell Cycle.
Figure B.1 Images of Yeast Cell LCycle. (ARACNe)
Source: Cytoscape 3.2.1 http://www.cytoscape.org
Figure B.2 Images of Yeast Cell Cycle. (Biweight Midcorrelation (Bicor))
Source: Cytoscape 3.2.1 http://www.cytoscape.org
25
Figure B.3 Images of Yeast Cell Cycle. (Cor- Pearson Correlation)
Source: Cytoscape 3.2.1 http://www.cytoscape.org
Figure B.4 Images of Yeast Cell Cycle. (MINE- Maximal Information Coefficient)
Source: Cytoscape 3.2.1 http://www.cytoscape.org
26
Figure B.5 Images of Yeast Cell Cycle. (MRNET)
Source: Cytoscape 3.2.1 http://www.cytoscape.org
Figure B.6 Images of Yeast Cell Cycle. (WGCNA)
Source: Cytoscape 3.2.1 http://www.cytoscape.org
27
APPENDIX C Figure C.1 to C.6 are network images of Yeast KY.
Figure C.1 Images of YeastKY. (ARACNe) Source: Cytoscape 3.2.1
http://www.cytoscape.org
Figure C.2 Images of Yeast KY.
(
Context Likelihood of Relatedness)Source: Cytoscape 3.2.1 http://www.cytoscape.org
28
Figure C.3 Images of Yeast KY
.
(
Cor- Pearson Correlation)Source: Cytoscape 3.2.1 http://www.cytoscape.org
Figure C.4 Images of Yeast KY.
(
MINE- Maximal Information Coefficient)Source: Cytoscape 3.2.1 http://www.cytoscape.org
29
Figure C.5 Images of Yeast KY
.
(
MRNET)Source: Cytoscape 3.2.1 http://www.cytoscape.org
Figure C.6 Images of Yeast KY. (WGCNA)
Source: Cytoscape 3.2.1 http://www.cytoscape.org
30
APPENDIX D
Figure D.1 to D.6 are network images of GDS825 (Human).
Figure D.1 Images of GDS825 (Human).
(ARACNe)
Source: Cytoscape 3.2.1 http://www.cytoscape.org
Figure D.2 Images of GDS825 (Human). (Biweight Midcorrelation)
Source: Cytoscape 3.2.1 http://www.cytoscape.org
31
Figure D.3 Images of GDS825 (Human). (Context Likelihood of Relatedness)
Source: Cytoscape 3.2.1 http://www.cytoscape.org
Figure D.4 Images of GDS825 (Human). (Cor-Pearson Correlation)
Source: Cytoscape 3.2.1 http://www.cytoscape.org
32
Figure D.5 Images of GDS825 (Human). (MRNET)
Source: Cytoscape 3.2.1 http://www.cytoscape.org
Figure D.6 Images of GDS825 (Human). (WGCNA)
Source: Cytoscape 3.2.1 http://www.cytoscape.org
33
APPENDIX E
Figure E.1 to E.6 are network images of GDS958 (Mouse).
Figure E.1 Images of GDS958 (Mouse).
(
ARACNe)Source: Cytoscape 3.2.1 http://www.cytoscape.org
Figure E.2 Images of GDS958 (Mouse).
(
Biweight Midcorrelation)Source: Cytoscape 3.2.1 http://www.cytoscape.org
34
Figure E.3 Images of GDS958 (Mouse).
(
Context Likelihood of Relatedness)Source: Cytoscape 3.2.1 http://www.cytoscape.org
Figure E.4 Images of GDS958 (Mouse).
(
Cor- Pearson Correlation)Source: Cytoscape 3.2.1 http://www.cytoscape.org
35
Figure E.5 Images of GDS958 (Mouse).
(
MINE- Maximal Information Coefficient)Source: Cytoscape 3.2.1 http://www.cytoscape.org
Figure E.6 Images of GDS958 (Mouse). (WGCNA)
Source: Cytoscape 3.2.1 http://www.cytoscape.org
36
APPENDIX F
Figure F.1 to F.6 are network images of GDS3702 (Rat).
Figure F.1 Images of GDS3702 (Rat). (ARACNe)
Source: Cytoscape 3.2.1 http://www.cytoscape.org
Figure F.2 Images of GDS3702 (Rat). (Biweight Midcorrelation)
Source: Cytoscape 3.2.1 http://www.cytoscape.org
37
Figure F.3 Images of GDS3702 (Rat). (Context Likelihood of Relatedness)
Source: Cytoscape 3.2.1 http://www.cytoscape.org
Figure F.4 Images of GDS3702 (Rat). (MINE- Maximal Information Coefficient)
Source: Cytoscape 3.2.1 http://www.cytoscape.org
38
Figure F.5 Images of GDS3702 (Rat). (MRNET)
Source: Cytoscape 3.2.1 http://www.cytoscape.org
Figure F.6 Images of GDS3702 (Rat). (WGCNA)
Source: Cytoscape 3.2.1 http://www.cytoscape.or
39
APPENDIX G
Figure G.1 to G.6 are network images of Thaliana.
Figures G.1 Images of Thaliana.
(
ARACNe)Source: Cytoscape 3.2.1 http://www.cytoscape.org
Figures G.2 Images of Thaliana.
(
Biweight Midcorrelation)Source: Cytoscape 3.2.1 http://www.cytoscape.org
40
Figures G.3 Images of Thaliana. (Context Likelihood of Relatedness)
Source: Cytoscape 3.2.1 http://www.cytoscape.org
Figures G.4 Images of Thaliana. (Cor- Pearson Correlation)
Source: Cytoscape 3.2.1 http://www.cytoscape.org
41
Figures G.5 Images of Thaliana. (MINE- Maximal Information Coefficient)
Source: Cytoscape 3.2.1 http://www.cytoscape.org
Figures G.6 Images of Thaliana. (MRNET)
Source: Cytoscape 3.2.1 http://www.cytoscape.org
42
REFERENCES
1. Rohde, K.H., Veiga, D.F.T., Caldwell, S., Balazsi, G., Russell, D.G., (2012) Linking the Transcriptional Profiles and the Physiological States of Mycobacterium tuberculosis during an Extended Intracellular Infection. PLoS Pathog 8(6): e1002769. doi:10.1371/journal.ppat.1002769
2. Balazsi, G., Heath, A.P., Shi, L., Gennaro, M.L.: The temporal response of the
Mycobacterium tuberculosis gene regulatory network during growth arrest. Mol Syst Biol 2008;4:225.
3. Langfelder, P., Horvath, S., (2008) WGCNA: an R package for weighted correlation network analysis. BMC Bioinformatics 2008, 9:559
4. Gautier L., Cope, L., Bolstad, B.M., Irizarry, R.A.: affy–analysis of Affymetrix GeneChip data at the probe level. Bioinformatics 2004, 20(3):307-315.
5. Voskuil, M.I., Visconti, K.C., Schoolnik, G.K., (2004) Mycobacterium tuberculosis gene expression during adaptation to stationary phase and low-oxygen
dormancy.Tuberculosis (Edinb) 84: 218–227
6. Madan, B.M., Teichmann, S.A., Aravind, L., (2006) Evolutionary dynamics of prokaryotic transcriptional regulatory networks. Journal of Molecular Biology 358: 614–633. [PubMed]
7. Roback, P., Beard, J., Baumann, D., Gille, C., Henry, K., Krohn, S., Wiste, H., Voskuil, M.I., Rainville, C., Rutherford, R., (2007) A predicted operon map for Mycobacterium tuberculosis. Nucleic Acids Res 35: 5085–5095 [PMC free article] [PubMed]
8. Kalinowski, J., Bathe, B., Bartels, D., Bischoff, N., Bott, M., Burkovski, A., Dusch, N., Eggeling, L., Eikmanns, B.J., Gaigalat, L., Goesmann,, A., Hartmann, M.,
Huthmacher, K., Kramer, R., Linke, B., McHardy, A.C., Meyer, F., Mockel, B., Pfefferle, W., Puhler, A., Rey, D.A., Ruckert, C., Rupp, O., Sahm, H., Wendisch, V.F., Wiegrabe, I., Tauch, A.: The complete Corynebacterium glutamicum ATCC 13032 genome sequence and its impact on the production of L-aspartate- derived amino acids and vitamins. Journal of Biotechnology. 2003;104(1-3):5–25.
9. Abreu, V.A., Almeida, S., Tiwari, S., Hassan, S.S., Mariano, D., Silva, A., Baumbach, J., Azevedo, V., Rottger, R. (2015) CMRegNet-An interspecies reference
database for corynebacterial and mycobacterial regulatory networks. BMC Genomics 16:452. doi:10. 1186/ s12864-015-1631-0
43
10. Shannon, P., Markiel, A., Ozier, O., Baliga, N.S., Wang, J.T., Ramage, D., Amin, N., Schwikowski, B., Ideker, T., (2003) Cytoscape: A software environment for integrated models of biomolecular interaction networks. Genome Res 13(11):2498–2504.
11. Pauling J., Rottger, R., Tauch, A., Azevedo, V., Baumbach, J.: CoryneRegNet 6.0– Updated database content, new analysis methods and novel features focusing oncommunity demands. Nucleic Acids Resources. 2012;40(Database
issue):D610–4.
12. Song, L., Langfelder, P., Horvath, S., (2002) Comparison of co-expression measures: mutual information, correlation, and model based indices. BMC Bioinformatics, 13(1), 328. doi: http://dx.doi.org/10.1186/1471-2105-13-328. Retrieved from: https://escholarship.org/uc/item/1510c2sx.
13. Langfelder, P., Horvath, S.: WGCNA: an R package for weighted correlation network analysis. BMC Bioinformatics 2008, 9:559
14. Margolin, A.A., Nemenman, I., Basso, K., Wiggins, C., Stolovitzky, G., Favera, R.D., Califano, A.: ARACNE: An Algorithm for the Reconstruction of Gene
Regulatory Networks in a Mammalian Cellular Context. BMC Bioinformatics 2006, 7(Suppl 1):S7
15. Meyer, P.E., Lafitte, F., Bontempi, G.: minet: A R/Bioconductor Package for Inferring Large Transcriptional Networks Using Mutual Information, BMC Bioinformatics 2008, 9:461
16. Yuan, L., Sha, W., Sun, Z., Zheng, C.: Biweight Midcorrelation-Based Gene Differential Coexpression Analysis and Its Application to Type II Diabetes. ;In ICIC (3)(2013)81-87
17. Roy, S., Bhattacharyya, D.K., Jugal K.K .: Reconstruction of gene co-expression network from microarray data using local expression patterns. From the 10th Annual Biotechnology and Bioinformatics Symposium (BIOT 2013) Provo, UT, USA 5-6 December 2013.