Robustness of serial clustering of
extratropical cyclones to the choice of
tracking method
Article
Accepted VersionPinto, J. G., Ulbrich, S., Economou, T., Stephenson, D. B.,
Karremann, M. K. and Shaffrey, L. C. (2016) Robustness of
serial clustering of extratropical cyclones to the choice of
tracking method. Tellus A, 68. 32204. ISSN 16000870 doi:
https://doi.org/10.3402/tellusa.v68.32204 Available at
http://centaur.reading.ac.uk/66165/
It is advisable to refer to the publisher’s version if you intend to cite from the work. To link to this article DOI: http://dx.doi.org/10.3402/tellusa.v68.32204 Publisher: CoAction Publishing All outputs in CentAUR are protected by Intellectual Property Rights law, including copyright law. Copyright and IPR is retained by the creators or other copyright holders. Terms and conditions for use of this material are defined in the End User Agreement .CentAUR
Central Archive at the University of Reading
Reading’s research outputs onlineRobustness of serial clustering of extra-tropical cyclones to
1
the choice of tracking method
2
3
Joaquim G. Pinto
4
Department of Meteorology, University of Reading, UK and
5
Institute for Geophysics and Meteorology, University of Cologne, Germany
6 7
Sven Ulbrich
8
Institute for Geophysics and Meteorology, University of Cologne, Germany
9
Theodoros Economou, David B. Stephenson,
10
Department of Mathematics, University of Exeter, UK
11
Melanie K. Karremann
12
Karlsruhe Institute of Technology, Institute of Meteorology and Climate Research, Germany
13
Len C. Shaffrey
14
NCAS-Climate, Department of Meteorology, University of Reading, UK
15 16
17
Tellus A - Thematic Cluster
18
“Intercomparison of Mid-Latitude Storm Diagnostics”
19
20
Accepted version 4 July 2016
21
doi:10.3402/tellusa.v68.32204
22
Corresponding author address: Joaquim G. Pinto, Department of Meteorology, University of Reading, Earley
Abstract
23
Cyclone clusters are a frequent synoptic feature in the Euro-Atlantic area. Recent studies have
24
shown that serial clustering of cyclones generally occurs on both flanks and downstream
25
regions of the North Atlantic storm track, while cyclones tend to occur more regulary on the
26
eastern side of the North Atlantic basin near Newfoundland. This study explores the
27
sensitivity of serial clustering to the choice of cyclone tracking method using cyclone track
28
data from 15 methods derived from ERA-Interim data (1979-2010). Clustering is estimated by
29
the dispersion (ratio of variance to mean) of winter (DJF) cyclones passages near each grid
30
point over the Euro-Atlantic area. The mean number of cyclone counts and their variance are
31
compared between methods, revealing considerable differences, particularly for the latter.
32
Results show that all different tracking methods qualitatively capture similar large-scale
33
spatial patterns of underdispersion / overdispersion over the study region. The quantitative
34
differences can primarily be attributed to the differences in the variance of cyclone counts
35
between the methods. Nevertheless, overdispersion is statistically significant for almost all
36
methods over parts of the Eastern North Atlantic and Western Europe, and is therefore
37
considered as a robust feature. The influence of the North Atlantic Oscillation on cyclone
38
clustering displays a similar pattern for all tracking methods, with one maximum near Iceland
39
and another between the Azores and Iberia. The differences in variance between methods are
40
not related with different sensitivities to the NAO, which can account to over 50% of the
41
clustering in some regions. We conclude that the general features of underdispersion /
42
overdispersion of extra-tropical cyclones over the North Atlantic and Western Europe is
43
robust to the choice of tracking method. The same is true for the influence of the North
44
Atlantic Oscillation on cyclone dispersion.
45
Keywords: Poisson process; extra-tropical cyclones, clustering, dispersion statistics, North
1. Introduction
48
Extra-tropical cyclones over the North Atlantic play a key role in determining the weather and
49
climate of Western Europe. Cyclones have a tendency to serially cluster close to Europe
50
(Mailer et al., 2006), particularly extreme ones (Vitolo et al., 2009; Pinto et al., 2013), which
51
can lead to severe socio-economic impacts and cumulative losses. A recent example is the
52
unusually large number of storms that affected the British Isles during the winter of 2013/2014
53
(Matthews et al., 2014). The winter of 2013/2014 was characterized by exceptionally wet and
54
windy conditions in this region, and the resulting wind damage and widespread coastal and
55
inland flooding had a considerable impact on infrastructure and transportation (Huntingford et
56
al., 2014). Such stormy winters are characterized by the frequent occurrence of cyclone
57
families (Bjerknes and Solberg, 1922).
58
Pinto et al. (2014) recently provided evidence that the occurrence of cyclone clusters is
59
governed by a persistent, zonally orientated and extended eddy-driven polar jet stream over
60
the Eastern North Atlantic and Western Europe, which drives the North Atlantic cyclones
61
towards the British Isles and sometimes further into Central Europe. The maintenance of these
62
large-scale conditions is supported by two-sided Rossby wave breaking over the North
63
Atlantic (Hanley and Caballero, 2012; Gómara et al, 2014; Messori and Caballero, 2015).
64
Pinto et al. (2014) demonstrated for four selected stormy periods 1990, 1993, 1999 and 2007,
65
that secondary cyclogenesis (new storms develop on the trailing fronts of previous storms, cf.
66
Parker, 1998) further contributes to the occurrence of cyclones clusters arriving into Western
67
Europe in rapid succession.
68
If cyclone occurrences at a certain area were completely random, then they can be statistically
69
modelled as Poisson (point) process. Deviations from a Poisson process can indicate whether
70
cyclones occur either in a more clustered (cyclones occur in groups) or a more regular way
71
(time between occurrences almost constant). Thus, implementing Poisson models to cyclone
count data can be used as a way of quantifying the amount of clustering/regularity (e.g.,
73
Mailier et al., 2006; Vitolo et al., 2009; Pinto et al., 2013; Blender et al., 2015; Economou et
74
al., 2015). The common result from these publications is that cyclone clustering
75
(overdispersion) occurs on both flanks and downstream of the North Atlantic storm track
76
(Mailier et al., 2006, their Fig. 6), while regularity (underdispersion) is found near the core of
77
the storm track by Newfoundland. This pattern is a robust feature in different reanalysis
78
datasets (Pinto et al., 2013, their Fig. 3). Global circulation models also broadly capture this
79
spatial pattern of overdispersion / underdispersion over the North Atlantic and Western
80
Europe (Economou et al., 2015, their Fig. 2).
81
Previous studies (Mailier et al., 2006; Vitolo et al., 2009) have shown that large-scale
82
atmospheric modes of variability such as the North Atlantic Oscillation (NAO, e.g. Hurrell et
83
al., 2003) have a strong influence on cyclone clustering. The NAO is the dominant large-scale
84
atmospheric pattern over the North Atlantic and Western Europe. The NAO has two centers of
85
action, the Azores high and the Icelandic low, and its index is a proxy for the strength of the
86
westerlies over the Northeast Atlantic. Thus, the NAO largely determines the weather
87
conditions over this area, particularly in wintertime. The NAO varies on time scales ranging
88
from days to centuries, but with dominant interdecadal to decadal time scales (Pinto and
89
Raible, 2012). Cyclone tracks are shifted northward and extended downstream in positive
90
NAO phases, while they are shorter and shifted southward in negative NAO phases (e.g.,
91
Pinto et al., 2009). Furthermore, the NAO and other large-scale modes affect both the
92
frequency and intensity of extratropical cyclones over the North Atlantic (Hunter et al., 2016).
93
The existence of clustering has been associated with NAO variability (e.g. Mailier et al.,
94
2006), as a prolonged time period with a dominant NAO phase will tend to direct cyclones
95
over the North Atlantic towards a specific area (Pinto et al., 2009), thus enhancing (reducing)
developed to analyse the relationship between NAO and cyclone activity, revealing that a
98
considerable part of the clustering is related to NAO variability (e.g. Mailier et al., 2006;
99
Vitolo et al., 2009; Economou et al., 2015). This is true for both reanalysis datasets and global
100
climate models.
101
Publications quantifying cyclone clustering over the North Atlantic have used single cyclone
102
tracking methods, either Hodges (1994), Murray and Simmonds (1991) or Blender et al.
103
(1997). As noted by Neu (2013), there is no single scientific definition of what an extratropical
104
cyclone is, and thus no consensus on the best atmospheric variable to use, leading to different
105
approaches for identifying and tracking cyclones. As a consequence, cyclone statistics and
106
characteristics differ depending on the cyclone tracking method and/or the key variable used
107
(e.g., Hoskins and Hodges, 2002; Raible et al., 2008; Rudeva et al., 2014). One of the
108
objectives of the Intercomparison of Mid-Latitude Storm Diagnostics (IMILAST) project is to
109
understand which cyclone statistics are robust to the choice of tracking algorithm (Neu et al.,
110
2013). Such an assessment is necessary to be able to provide objective information to
111
stakeholders regarding cyclone activity in general and windstorms in particular (Hewson and
112
Neu, 2015).
113
The present manuscript is a contribution to the IMILAST project. The main question explored
114
in this study is how robust the general features of underdispersion / overdispersion over the
115
study area are to the choice of cyclone tracking method. With this aim, we perform for the first
116
time a multi-tracking approach analysis of clustering over the North Atlantic and Europe. The
117
second aim is to evaluate how the NAO influence on cyclone clustering depends on the choice
118
of tracking method. Section 2 describes the datasets and methodologies used. The
119
quantification of cyclone passages is explained in section 3, together with a description of
120
mean and variance of counts. Section 4 presents the clustering as identified for all the 15
methods and investigates spread between methods. Section 5 quantifies the links between
122
clustering and the NAO variability. A short conclusion follows.
123
124
2. Data and Methods
125
The IMILAST project cyclone track dataset
126
One of the main objectives of the IMILAST project is to document and understand the
127
sensitivity of the representation of cyclone activity and extreme windstorms in reanalysis
128
datasets and global climate model simulations to the choice of cyclones tracking method. In
129
particular, the IMILAST team has been evaluating which cyclone features are largely
130
independent of the tracking method used (and hence can be regarded as robust), and which
131
features differ between tracking methods. In a first analysis, Neu et al. (2013) concluded that
132
differences between methods are typically small for long-lived, transient, deep, intense lows
133
over large oceanic basins. This is not unexpected, as extremes associated with extratropical
134
cyclones (e.g., minimum sea level pressure, vorticity, peak winds) are strongly inter-related
135
(Economou et al., 2014). On the other hand, considerable discrepancies between tracking
136
methods are found for short-lived, shallow, and slow moving systems, particularly over areas
137
like the Mediterranean or over the continents (Neu et al., 2013; Lionello et al., 2016). More
138
details on the inter-comparison strategy, general results and proposed future directions of
139
research are discussed in Hewson and Neu (2015).
140
The cyclone track database from the IMILAST project is used here to estimate the dispersion
141
of cyclone counts over the North Atlantic and Europe. The cyclone tracks were derived with
142
multiple cyclone tracking methods (see Neu et al., their Table 1) based on European Centre for
143
Medium-Range Weather Forecasts (ECMWF) Interim Reanalysis (ERA-Interim; Dee et al.,
144
2011). The horizontal resolution of the dataset is T255 (approximately 0.75°x0.75° latitude /
1.5°x1.5° and made available to all IMILAST participants. The investigation period is
147
December 1979 to February 2010 (at 6-hourly resolution), and only winter months are
148
analysed (December, January, February: DJF). Here, we consider results from 14 tracking
149
methods from the IMILAST project (cf. Table 1, M02-M22). Additionally, we considered also
150
cyclone tracks derived with the Hodges tracking method (Hodges, 1994, 1999; Hodges et al.,
151
2011, HOD) for the same time period and set up as the IMILAST tracking data. Tracks over
152
high orography (>1500 m) are not considered (e.g. Greenland, Atlas Mountains) and such
153
areas are disregarded in this study. All tracks have a lifetime of at least 24 hours (five time
154
frames). For specific details on the individual methods see references inserted in Table 1.
155
Comparisons between the tracking methods are presented in e.g., Raible et al. (2008), Neu et
156
al. (2013), Rudeva et al. (2014) and Lionello et al. (2016). Several case studies are discussed
157
in Hewson and Neu (2015), including comparisons to observations. The colors of the method
158
in Figures 1 and 5 correspond to the type of method (cf. Table 1): Green colours for 850 hPa
159
vorticity (M07, M18, M21, HOD), grey for 850 hPa geopotential height minimum contour
160
(M14), orange/brown for mean sea level (MSLP) minimum (M12, M15, M16, M20), red for
161
MSLP gradient or minimum contour (M06, M08, M22), and blue for Laplacian of MSLP
162 (M02, M09, M10). 163 164 Quantification of clustering 165
The occurrence of random events in time can be represented by the homogeneous Poisson
166
process (Cox and Isham, 1980). If the events (cyclones) arise with a rate of occurrence λ, then
167
the number of events y in a time interval T is Poisson distributed (random), with mean (𝑦̅) and
168
sample variance (s𝑦2) both equal to λT, and thus s𝑦2 / 𝑦̅ = 1. Deviations from the Poisson
169
process indicate a non-random arrival of cyclones over time, in the sense that events
170
systematically occur in a more clustered (in groups) or a more regular way (equal spacing in
time; cf. Fig. S1). These deviations from the Poisson process can be used to assess the degree
172
of clustering, and following Mailier et al. (2006), we use the dispersion statistic:
173
𝜙 =s𝑦2
𝑦̅ − 1. (1)
174
A Poisson process (s𝑦2 = 𝑦̅) with a constant rate of occurrence λ implies 𝜙 = 0. Positive
175
values of 𝜙indicate clustering (overdispersion; s𝑦2> 𝑦̅), and negative values of 𝜙 indicate
176
regularity (underdispersion; s𝑦2< 𝑦̅; cf. Fig. S1). Following Pinto et al. (2013), events are
177
defined as cyclone tracks intercepting a radius of influence around a certain grid point. An
178
identification radius of 700 km was selected based on considerations related to cyclone sizes
179
and potential impacts, so the rate is the number of cyclones that pass through this region with
180
an area of 𝜋 ∙ 700km² (see Pinto et al., 2013 for more details). When a cyclone track intercepts
181
the circle for a selected grid point, the time corresponding to the nearest position to the circle
182
center is counted (cf. Fig. 1a for an example). In this way, time series are obtained for each
183
method (Fig. 1b). This approach is applied at each location (grid point) and was recently used
184
to estimate clustering of cyclones simulated by CMIP5 global climate models (Economou et
185
al., 2015). For each winter (DJF), cyclone counts (𝑦𝑖) are computed for the period
1979/80-186
2009/10 to produce a time-series of counts {𝑦1, 𝑦2, … , 𝑦𝑛} at each grid point, where n is the
187
number of winters.
188
189
Relationship with the North Atlantic Oscillation
190
As explained in Economou et al. (2015), overdispersioncan be approximated by
191 𝜙′ = 4(𝑠 √𝑦) 2 -1. (2) 192
where (𝑠√𝑦)2 is the sample variance of √𝑦, and thus
(𝑠√𝑦)2 = 1 𝑛∙ ∑ (√𝑦𝑖 − √𝑦̅̅̅̅) 2 = 𝑦̅ 𝑛 𝑖=1 − (√𝑦̅̅̅̅) 2 . (3) 194
The square root transformation stabilizes the variance, i.e. removes the dependence between
195
mean and variance. Economou et al. (2015) showed that this also allows a regression of √𝑦 on
196
the NAO, in order to quantify the possible influence of the NAO on dispersion:
197
√𝑦 = 𝛼 + 𝛽𝑥 + 𝜀; 𝜀~𝑁(0, 𝜎2) (4)
198
where 𝑥 is the seasonal mean of NAO. Parameters 𝛼 and 𝛽 are estimated from the data, and
199
represent the intercept and slope parameters of the assumed linear relationship between √𝑦
200
and the NAO. The term 𝜀 represents the error about the straight line, and is assumed to follow
201
a Normal distribution with variance 𝜎2, which is also estimated from the data. To investigate
202
whether the assumption that NAO is linearly related to √𝑦 holds across all methods, we have
203
additionally implemented an extended regression assuming a quadratic relationship:
204
√𝑦 = 𝛼 + 𝛽𝑥 + 𝛾𝑥2 + 𝜀; 𝜀~𝑁(0, 𝜎2) (5)
205
The estimated linear and quadratic relationships for two exemplary grid points near the Azores
206
and Iceland are shown in Figures S2 and S3. In general, these plots indicate that there is no
207
real difference between the linear and quadratic fits, so that the linear fit is retained. The NAO
208
index is calculated following the methodology by Barnston and Livezey (1987), which is
209
based on Rotated Principal Component Analysis. The monthly time series for December,
210
January and February were provided by the Climate Prediction Center from the National
211
Oceanic and Atmospheric Administration and averaged for each winter (DJF).
212
Using equation (4), it can be shown that
213
𝜙′ = 4(𝑠√𝑦)2− 1 = 4𝛽2(𝑠𝑥)2+ 4σ2− 1 (6)
where (𝑠𝑥)2 is the sample variance of the NAO-index x. This allows to diagnose how much of
215
the underdispersion can attributed to modulation of counts by NAO (the parameter 𝛽).
216
217
3. Quantification of cyclone passages on a grid point basis
218
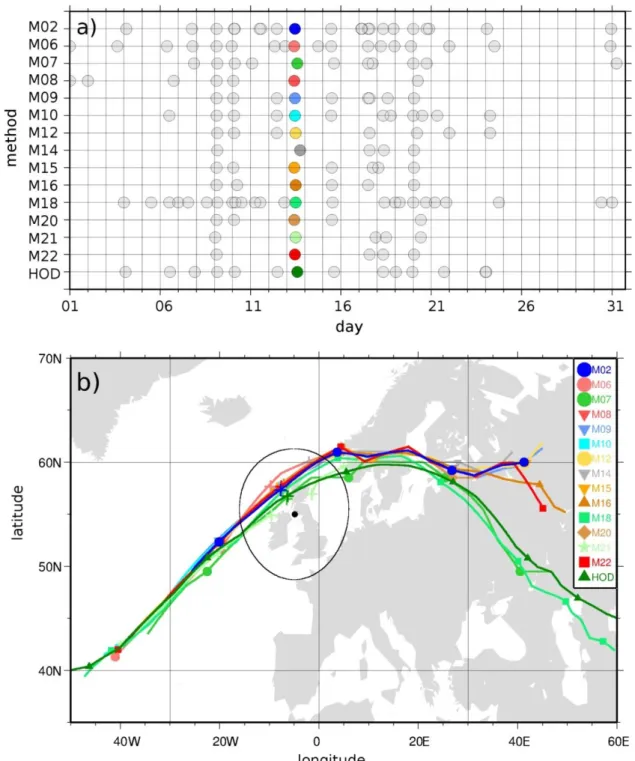
Time series of cyclone counts for all 15 methods are first analysed at each grid point. As an
219
example, we consider the grid point 55°N, 5°W centered over the British Isles and cyclone
220
counts for January 2007 (Fig. 1), a period characterized by a large number of storms over this
221
area (Pinto et al., 2014). The corresponding 700 km identification radius is shown in Fig. 1b.
222
The cyclone passages within this area are indicated in the time line (Fig. 1a) and show some
223
similarities but also differences for the individual methods: for example, the number of
224
identified cyclones for this grid point and month ranges from 5 (M22) to 25 (M18). On the
225
other hand, the main cyclones passing through this area (9, 10, 12, 13, 15, 18 and 20 January;
226
cf. Pinto et al., 2014; their Figure 3) are captured by most methods. Fig. 1b shows the
227
individual tracks for all methods for the cyclone passing on 13 January (named storm “Hanno”
228
by the Free University of Berlin). The tracks show generally a good agreement for all methods
229
in the main development phase, when all tracks are found within a corridor of a few 100
230
kilometers. Small differences between the tracks at this development stage are typical, given
231
that the methods use different key variables for tracking: for example, the MLSP minima and
232
850 hPa vorticity maxima do not exactly overlap in an extra-tropical cyclone (e.g. Pinto et al.,
233
2005; their Figure 1), with the vorticity maxima (e.g., M07, M18, HOD) typically being
234
located south of the former (e.g. M02, M06). Less agreement is found at the beginning
235
(different starting points) and particularly at the end of the cyclone tracks, which show
236
diverging trajectories over Eastern Europe: while most methods show a zonal track towards
237
southern Finland and further into Northern Russia, some of the vorticity methods (green) show
a track towards the Caspian Sea. Similar results have been found in previous case studies
239
analysed in the IMILAST project (Neu et al., 2013; their Figs 4 and 5).
240
Following this methodology, time series of cyclone counts are derived for each grid-point in
241
the domain 30°N – 70°N and 80°W – 20°E and for the whole study period (winters 1979/80 to
242
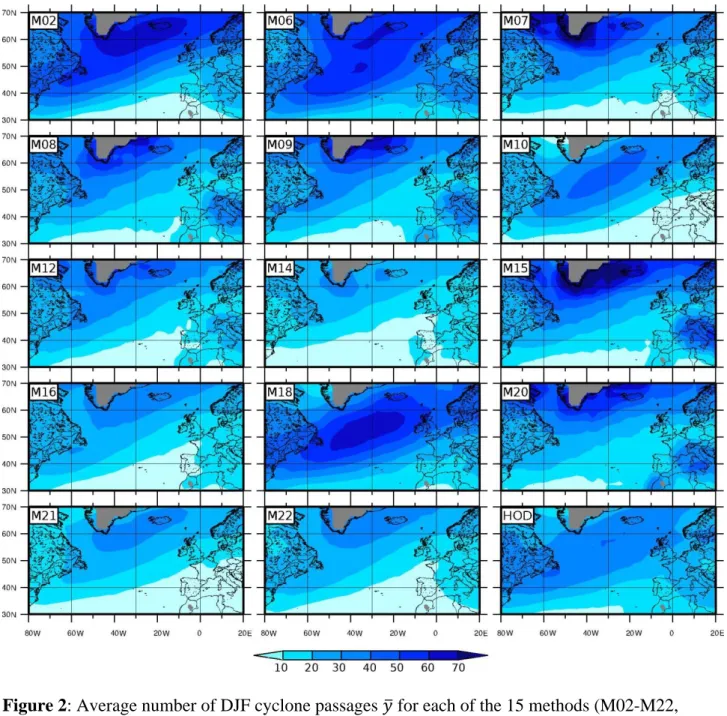
2009/10). The mean of counts 𝑦̅ and their variance (𝑠𝑦)2, the two components needed to
243
estimate are displayed in Figures 2 and 3 for all 15 cyclone tracking methods. The number
244
of tracks passing through a certain area (𝑦̅; Figure 2) is comparable to a cyclone track density
245
field, and depict higher magnitudes in areas with many transient cyclones. This is unlike
246
cyclone count statistics, in which cyclones can be counted multiple times in the same location
247
(cf. Pinto et al., 2005). Therefore, some intrinsic differences are found between Figure 2 and
248
Figure 1 from Neu et al. (2013), which shows cyclone count statistics. This reveals a larger
249
discrepancy between the algorithms compared to Neu et al. (2013), e.g. there is no common
250
peak south of Greenland for all methods (Figure 2).
251
Differences between tracking methods are identified both in terms of total numbers, position
252
of the North Atlantic storm track and regional aspects such as Mediterranean cyclones: For
253
example, methods M14, M21 and M22 show generally small cyclone numbers and relatively
254
weak activity over the Mediterranean Basin (Figure 2). This is not the case for other methods
255
such as M02, M06, M15 and M20. However, the general spatial pattern in mean counts over
256
the North Atlantic storm track qualitatively agrees between methods. Some of the spatial
257
differences between methods can be explained by the choice of variable used in the tracking.
258
For example, cyclone tracks based on 850 hPa vorticity (VORT) are typically displaced
259
southwards to cyclone tracks derived from MSLP pressure minimum (cp. M15 and M18).
260
Systematic discrepancies between the various cyclone track algorithms also play a role for the
261
identified differences. See also Neu et al. (2013) for more details. Specific differences within
the Mediterranean Basin are discussed in Lionello et al. (2016) and will not be further
263
analysed here.
264
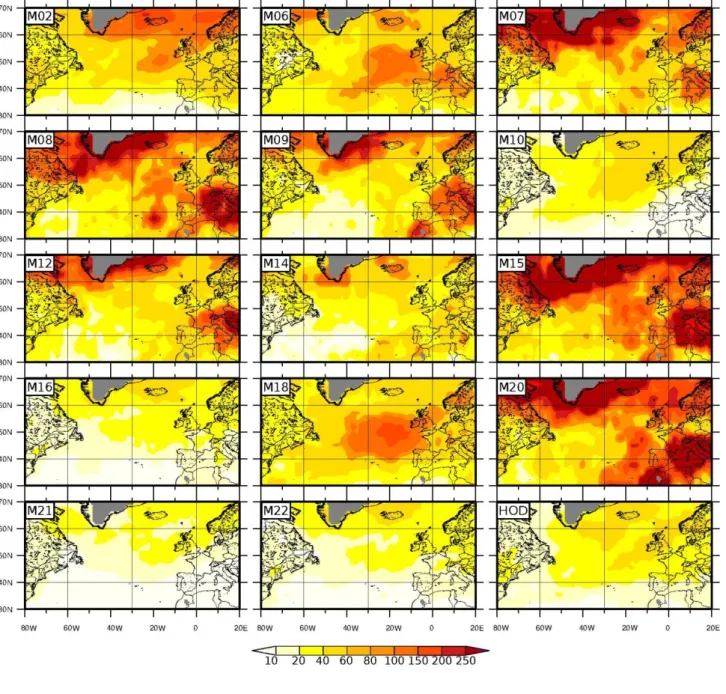
The variance of counts (𝑠𝑦)2shows more diverse results (Figure 3). Spatial patterns typically
265
display a maximum of activity south of Greenland, which often extends towards Northern
266
Europe. However, the relative maximum over Western / Central Europe is not found for some
267
methods (e.g. M16, M21), or is displaced in others (M06, M18) to around 50°N–55°N over
268
the Eastern North Atlantic. While this relative maximum is also found for other methods (e.g.
269
M02, M15) it is not the dominant feature. In terms of numbers, the differences in (𝑠𝑦)2
270
between methods are even larger than for 𝑦̅, with values differing by an order of magnitude in
271
some areas, e.g. south of Greenland.
272
273
4. Quantification of clustering
274
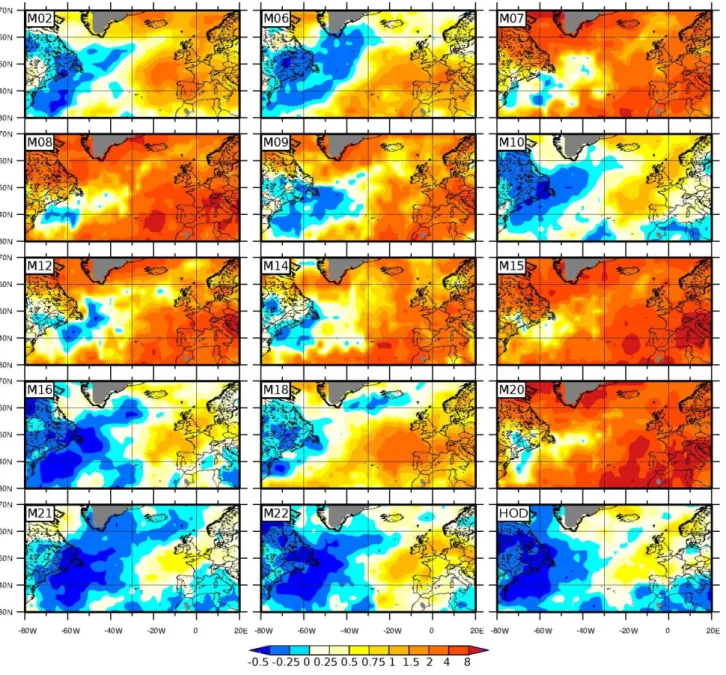
The estimates of 𝜙 for the different methods are shown in Figure 4. The general spatial pattern
275
qualitatively agrees between tracking methods, e.g. an area of 𝜙<0 identified over the western
276
North Atlantic (regularity or underdispersion; blue colours), while 𝜙>0 (clustering or
277
overdispersion; red colours) is found on northern and southern flanks and the downstream
278
region of the North Atlantic storm track (cp. Mailier et al., 2006; Pinto et al., 2013).
279
Considering the whole study area, overdispersion (red) tends to dominate for some methods
280
(e.g., M15, M20), while underdispersion (blue) dominates for others (e.g., M21, M22).
281
However, most methods show a balance between the two features (e.g. M02, M06, M18), in
282
line with previous works (Mailier et al., 2006; Pinto et al., 2013). While all methods show
283
overdispersion over Western Europe, the magnitude of 𝜙 clearly differs between methods. For
284
the example grid point 55°N, 5°W, 𝜙 is positive for all methods (clustering), but ranges from
285
0.27 (M21) to 4.73 (M20). Differences appear to be dominated primarily by the variance of
To provide further insight into the differences between methods, we analyse in detail the
288
relations between 𝑦̅ and (𝑠𝑦)2 for 55°N, 5°W. In Figure 5, the mean is plotted against the
289
variance, and the lines corresponding to 𝜙 =0, 1, 2, 3, 4, and 5 are shown for orientation. Half
290
of the methods are found in the range between 𝜙 =0.86 and 1.32, and four methods around 2.0
291
(M07, M08, M09, M14). Methods M15, M20 and M21 are outliers: the two former methods
292
(both based on MSLP) display a much higher (𝑠𝑦)2 compared to 𝑦̅, while for the latter (𝑠𝑦)2
293
and 𝑦̅ are small and roughly equal. The statistical significance bounds for the Poisson
294
distribution (𝜙 =0) is estimated using parametric bootstrapping: 10000 time series of 30
295
counts are generated for each mean value (1-55) assuming a Poisson distribution. For each
296
mean value, the empirical 95% quantile of those 10000 variance values is used to construct a
297
95% confidence interval (gray area around 𝜙 =0 in Figure 5). This implies that dispersion
298
values for all but two methods (M21, HOD) significantly deviate from Poisson. Similar results
299
are found for other grid points over the Eastern North Atlantic and Western Europe (not
300
shown), revealing the robustness of overdispersion of cyclone counts for this area.
301
The range of the horizontal axis (in Figure 5), which shows the mean, is much smaller than the
302
range of the vertical axis, which shows the variance. This indicates that differences in (𝑠𝑦)2
303
are the primary driver behind the differences in 𝜙. For example, 𝑦̅ is actually quite similar for
304
M20 and M21 (20.9 and 18.5, respectively), while (𝑠𝑦)2 and thus 𝜙 are very different. On the
305
other hand, the consistency of results between M02 and M10 is noteworthy: these approaches
306
basically use the same tracking method with different parameters, and provide very similar
307
values of 𝜙 (1.21 and 1.32) despite the differences in 𝑦̅. Methods displaying underdispersion
308
over most of the study area (e.g., M21, M22) typically have a small number of cyclone counts
309
(cf. Fig. 2), but the dominant factor for the differences in 𝜙 remains (𝑠𝑦)2. It is noteworthy
310
that the two methods with the highest 𝜙 values (M15, M20) are MSLP minimum methods
(orange/brown). However, other MSLP minimum methods (M12, M16) show values closer to
312
the other approaches. It is therefore difficult to associate the diversity of 𝜙 results with
313
particular features of tracking methods. This result is consistent with the conclusions of Neu et
314
al. (2013) and Rudeva et al. (2014) regarding cyclone characteristics and their possible
315
dependence on the tracking method.
316
317
5. Relationship with the NAO
318
The recent study by Economou et al. (2015) showed that a considerable part of the
319
overdispersion identified based on ERA-Interim reanalysis cyclone tracks derived with the
320
HOD approach is due to the modulation of cyclone counts by the NAO. In order to investigate
321
the NAO influence on cyclone clustering, dispersion is now quantified following Economou et
322
al. (2015), where 𝜙 is approximated by 𝜙′ = 4(𝑠√𝑦)2-1 (equation 2). Results are shown in
323
Figure 6 for each tracking method. The two estimation methods for 𝜙 are very similar (cp.
324
Figs 4 and 6), implying that the 𝜙′ is a good approximation to 𝜙. In the following, we use this
325
approximation to estimate the contribution of the NAO index to the dispersion index
326
according to equation (6).
327
The linear relationship between the strength of the NAO x and √𝑦 is quantified by the
328
parameter β. The result is a dipolar structure, revealing a positive pole near Iceland and a
329
negative pole over the Azores (cf. Figure 7). This systematic influence of the NAO-Phase on
330
clustering can now be quantified as 4𝛽2(𝑠𝑥)2 (equation 6). Figure 8 shows the NAO
331
contribution for each method, revealing two maxima, one north and one south of the North
332
Atlantic storm track. This general spatial pattern is in good agreement with Economou et al.
333
(2015) who considered cyclone tracks derived with HOD method and ERA-40 data (Uppala et
334
al., 2005). The North Atlantic storm track moves latitudinally depending on the NAO-phase,
However, there are differences in the detail between the 15 methods, both in terms of spatial
337
pattern and magnitude. This can be partly explained by the relationship between the NAO
338
influence on dispersion and the magnitude of dispersion itself per method (compare Figures 4
339
and 8). For example, a strong influence of the NAO on the clustering of cyclones is found in
340
regions and methods where overdispersion is high (cp. Figure 4 and Figure 8 for M07, M08,
341
M15, M20 near the Alps). The spatial pattern of NAO influence also shows some differences
342
over Europe: for example, while the region with low NAO influence (white) is located over
343
Northern Europe for most methods, a few methods have this region over Central Europe
344
(M10, M18) or over France (M20). The spatial variability of the NAO-influence is high for
345
some methods (M07, M08, M15), which indicates a larger uncertainty of the β estimate. In
346
general, it is difficult to associate the different types of methods (e.g. using vorticity or MSLP
347
as the cyclone tracking variable) with a specific type of behavior regarding the NAO influence
348
on cyclone clustering over the North Atlantic and Europe, but the general agreement between
349
the methods is encouraging.
350
The large differences in the number of counts between the methods leads to strong differences
351
in β and therefore also on the absolute contribution of the NAO to overdispersion. As all the
352
effects contributing to clustering can be quantified as 4𝛽2(𝑠𝑥)2+ 4σ2(equation 6), the
353
relative contribution of the NAO is defined as 4𝛽2(𝑠
𝑥)2⁄(4𝛽2(𝑠𝑥)2+ 4σ2 ) and shown in
354
Figure 9. A similar pattern to Figure 8 is revealed, with the two maxima near Iceland and the
355
Azores, plus additional maxima over Central Europe or near Newfoundland. The relative
356
contribution of the NAO to clustering exceeds 50% for some methods, particularly south of
357
Iceland and in the region between Azores and Iberia. The intensity and extension of the area
358
around each of the two maxima differ. For example, for M02, both maxima are approximately
359
equally strong, while for M18 the southern maximum is more pronounced. This suggests a
360
stronger (weaker) contribution of other processes than the NAO to the clustering for one
(other) maximum. Comparing the figures 3 and 9, it is quite apparent that there is no clear link
362
between the difference in variance between methods and the sensitivity to the NAO.
363
364
6. Conclusions
365
The main objective of this paper was to assess if the cyclone clustering over the eastern North
366
Atlantic and Europe is a robust feature using results from 15 cyclone tracking methods. A
367
second objective was to evaluate whether the relationship between NAO and clustering
368
depends on the choice of the tracking method. The main findings of this study are as follows:
369
370
The general spatial pattern of the cyclone dispersion statistic (𝜙), as previously
371
identified with single tracking methods, is qualitatively captured by all methods:
372
underdispersion (regularity) is identified near the core of the North Atlantic storm
373
track near Newfoundland, while overdispersion (clustering) can be found over the
374
eastern North Atlantic and Western Europe, particularly on both sides and downstream
375
of the North Atlantic storm track.
376
Quantitative differences in the values of 𝜙 are identified between methods. Some
377
methods display predominantely underdispersion (regularity) over the study area,
378
while others indicate overdispersion (clustering) over almost the whole study area.
379
The differences in 𝜙 can be primarily attributed to the differences in the variance of
380
cyclone counts between the methods.
381
Significant overdispersion is identified for almost all methods over parts of the Eastern
382
North Atlantic and Western Europe, indicating the robustness of cyclone clustering in
383
this area. Still, the magnitude of 𝜙 may vary strongly between methods.
384
The statistical link between NAO and clustering of cyclone tracks found for all
both sides of the main storm track are identified, though with slightly different
387
magnitudes and spatial extension.
388
The explained variance of the NAO on clustering exceeds 50% for some tracking
389
methods and locations. The differences in the variance of cyclone counts cannot be
390
attributed to different sensitivities to the NAO.
391
392
We conclude that both the general pattern of underdispersion / overdispersion over the North
393
Atlantic and Western Europe and the dipolar pattern of NAO influence on dispersion are
394
largely independent from the choice of tracking method and hence from the definition of a
395
cyclone. In particular, overdispersion of cyclone counts is identified for all methods over the
396
Western Europe, and can therefore be considered as a robust feature. This is important and
397
valuable information for stakeholders, such as the insurance industry, for whom the clustering
398
of extreme cyclones is a major economic risk.
399
The present results suggest that estimates of cyclone clustering obtained with single tracking
400
methods can be regarded as qualitatively representative for a wider range of tracking methods.
401
This is particularly important because cyclone clustering may change under future climate
402
conditions (Pinto et al., 2013). Given the large sampling uncertainty, such potential changes
403
may not be detectable in single 30-year climate model simulations (Economou et al., 2015).
404
Still, Karremann et al. (2014) has recently provided evidence based on a large ensemble of
405
simulations with a single global circulation model that cumulative annual losses associated
406
with extra-tropical cyclones may increase over most of Europe in future decades due to a
407
combination of changes in potential loss magnitude and changes in storm clustering.
408
Future research could analyse differences between tracking methods also in higher resolution
409
reanalysis datasets such as NASA-MERRA (Rienecker et al., 2011). The higher spatial and
410
temporal resolution will permit a better quantification of the features identified here and a
more detailed dynamical analysis similar to Pinto et al. (2014). Another interesting line of
412
research is to quantify the role of the jet location and intensity for cyclone clustering across
413
Western Europe. Preliminary results (for the grid point 55°N, 5°W) indicate that winters with
414
a stronger jet also have a higher number of counts for all methods, particularly when the jet is
415
located around 45°N-50°N (not shown). Finally, it will be interesting to investigate clustering
416
of extratropical cyclones in global circulation models in more detail, taking into account how
417
cyclones and cyclone clustering are represented at different resolutions, evaluating the
418
representation of the associated physical processes, and analysing how results depend on the
419 tracking method. 420 421 Acknowledgements 422
The authors would like to thank Swiss Re for sponsoring the Intercomparison of Mid-Latitude
423
Storm Diagnostics (IMILAST) project. T.E. and D.B.S. were supported by NERC project
424
CREDIBLE. We thank the European Center of Medium Range Weather Forecast (ECMWF,
425
www.ecmwf.int) for the ERA-Interim reanalysis, and the Climate Prediction Center from the
426
National Oceanic and Atmospheric Administration for the NAO index
427
(http://www.cpc.ncep.noaa.gov/products/precip/CWlink/pna/nao.shtml). We thank all the
428
members of the IMILAST project (www.proclim.ch/imilast) for making the cyclone tracks
429
available. We also thank Kevin Hodges for making the cyclone tracks available for this study
430
and for discussions. The present manuscript profited from discussion with various members of
431
the IMILAST project group. We are thankful to the two anonymous reviewers for their
432
valuable comments and suggestions on a previous version of this manuscript.
433
References
435
Akperov, M. G., Bardin, M. Y., Volodin, E. M., Golitsyn, G. S. and Mokhov, I. I. 2007.
436
Probability distributions for cyclones and anticyclones from the NCEP/NCAR reanalysis
437
data and the INM RAS climate model. Izvest. Atmos. Ocean. Phys.43, 705-712. doi:
438
10.1134/S0001433807060047.
439
Bardin, M. Y. and Polonsky, A. B. 2005. North Atlantic Oscillation and synoptic variability in
440
the European-Atlantic region in winter. Izvest. Atmos. Ocean. Phys. 41, 127-136.
441
Barnston, A. G., and Livezey, R. E. 1987. Classification, seasonality and persistence of
low-442
frequency atmospheric circulation patterns. Mon. Weather Rev. 115, 1083–1126. doi:
443
10.1175/1520-0493(1987)115<1083:CSAPOL>2.0.CO;2.
444
Blender, R., Fraedrich, K., and Lunkeit, F. 1997. Identification of cyclone track regimes in the
445
North Atlantic. Q. J. Roy. Meteorol. Soc.123, 727-741. doi: 10.1002/qj.49712353910.
446
Blender R., Raible, C.C., and Lunkeit, F. 2015. Non-exponential return time distributions for
447
vorticity extremes explained by fractional Poisson processes. Q. J. Roy. Meteorol. Soc.141,
448
249–257. doi: 10.1002/qj.2354.
449
Bjerknes, J., and Solberg, H. 1922. Life cycle of cyclones and the polar front theory of
450
atmospheric circulation, Geofys. Publ.3, 3–18.
451
Cox, D. R., and Isham, V. 1980. Point Processes, pp. 188, Chapman and Hall/CRC, London.
452
Dee, D. P., Uppala, S. M., Simmons, A. J., Berrisford, P., Poli, P., and co-authors. 2011. The
453
ERA-Interim reanalysis: Configuration and performance of the data assimilation system. Q.
454
J. Roy. Meteorol. Soc. 137, 553–597. doi: 10.1002/qj.828.
455
Economou, T., Stephenson, D. B., Ferro, C. A. T. 2014. Spatio-temporal modelling of extreme
456
storms. Ann. Appl. Stat.8, 2223-2246. doi:10.1214/14-AOAS766.
Economou, T., Stephenson, D. B., Pinto, J. G., Shaffrey, L. C., Zappa, G. 2015. Serial
458
clustering of extratropical cyclones in historical and future CMIP5 model simulations. Q. J.
459
Roy. Meteorol. Soc. 141, 3076–3087. doi: 10.1002/qj.2591.
460
Flaounas, E., Kotroni, V., Lagouvardos, K. and Flaounas, I. 2014. CycloTRACK (v1.0):
461
Tracking winter extratropical cyclones based on relative vorticity: Sensitivity to data
462
filtering and other relevant parameters. Geosci. Model Dev. 7, 1841-1853. doi:
463
10.5194/gmd-7-1841-2014.
464
Gómara, I., Pinto, J. G., Woollings, T., Masato, G., Zurita-Gotor, P. and Rodríguez-Fonseca,
465
B. 2014. Rossby wave-breaking analysis of explosive cyclones in the Euro-Atlantic sector,
466
Q. J. Roy. Meteorol. Soc.140, 738–753. doi: 10.1002/qj.2190.
467
Hanley, J., and Caballero, R. 2012. The role of large-scale atmospheric flow and Rossby wave
468
breaking in the evolution of extreme windstorms over Europe. Geophys. Res. Lett. 39,
469
L21708. doi: 10.1029/2012GL053408.
470
Hewson, T. D. 1997. Objective identification of frontal wave cyclones. Meteorol. Appl. 4,
471
311-315. doi: 10.1017/S135048279700073X.
472
Hewson, T. D. and Titley, H. A. 2010. Objective identification, typing and tracking of the
473
complete lifecycles of cyclonic features at high spatial resolution. Meteorol. Appl. 17,
355-474
381. doi: 10.1002/met.204.
475
Hewson, T. D. and Neu, U. 2015. Cyclones, windstorms and the IMILAST project. Tellus A
476
67, 27128, doi: 10.3402/tellusa.v67.27128
477
Hodges, K. I. 1994. A general method for tracking analysis and its application to
478
meteorological data. Mon. Weather Rev. 122, 2573–2585. doi:
10.1175/1520-479
0493(1994)122<2573:AGMFTA>2.0.CO;2.
480
Hodges, K. I. 1999. Adaptive constraints for feature tracking. Mon. Weather Rev.127, 1362–
Hodges, K. I., Lee, R. W., and Bengtsson, L. 2011. A comparison of extratropical cyclones in
483
recent reanalyses ERA-Interim, NASA MERRA, NCEP CFSR, and JRA-25. J. Clim. 24,
484
4888–4906. doi: 10.1175/2011JCLI4097.1.
485
Hoskins, B. J. and Hodges, K. I. 2002. New perspectives on the Northern Hemisphere winter
486
storm tracks. J. Atmos. Sci., 59, 1041-1061. doi:
10.1175/1520-487
0469(2002)059<1041:NPOTNH>2.0.CO;2.
488
Hunter, A., Stephenson, D.B., Economou, T., Holland, M. and Cook, I. 2016. New
489
perspectives on the aggregated risk of extratropical cyclones. Q. J. Roy. Meteorol. Soc.142,
490
243–256. doi:10.1002/qj.2649.
491
Huntingford, C., Marsh, T., Scaife, A. A., Kendon, E. J., Hannaford, J. and co-authors 2014.
492
Potential influences in the United Kingdom's floods of winter 2013–2014. Nat. Clim.
493
Change4, 769–777. doi: 10.1038/nclimate2314.
494
Hurrell, J. W., Kushnir, Y., Ottersen, G. and Visbeck, M. 2003. An Overview of the North
495
Atlantic Oscillation, in The North Atlantic Oscillation: Climatic Significance and
496
Environmental Impact (eds J. W. Hurrell, Y. Kushnir, G. Ottersen and M. Visbeck),
497
American Geophysical Union, Washington, D. C. doi: 10.1029/134GM01.
498
Inatsu, M., 2009: The neighbor enclosed area tracking algorithm for extratropical wintertime
499
cyclones. Atmos. Sci. Lett.10, 267-272. doi: 10.1002/asl.238.
500
Karremann, M. K., Pinto, J. G., Reyers, M., Klawa, M. 2014. Return periods of losses
501
associated with European windstorm series in a changing climate. Environ. Res. Lett. 9,
502
124016. doi: 10.1088/1748-9326/9/12/124016.
503
Kew, S. F., Sprenger, M. and Davies, H. C. 2010. Potential vorticity anomalies of the
504
lowermost stratosphere: A 10-yr winter climatology. Mon. Weather Rev. 138, 1234-1249.
505
doi: 10.1175/2009MWR3193.1.
Lionello, P., Dalan, F. and Elvini, E. 2002. Cyclones in the Mediterranean region: The present
507
and the doubled CO2 climate scenarios. Clim. Res.22, 147-159. doi: 10.3354/cr022147.
508
Lionello, P., Trigo, I. F., Gil, V., Liberato, M. L. R., Nissen, K. M., and co-authors. 2016.
509
Objective Climatology of Cyclones in the Mediterranean Region: a consensus view among
510
methods with different system identification and tracking criteria. Tellus A,68, 29391. doi:
511
10.3402/tellusa.v68.29391
512
Mailier, P. J., Stephenson, D. B., Ferro, C. A. T., and Hodges, K. I. 2006. Serial clustering of
513
extratropical cyclones. Mon. Weather Rev.134, 2224-2240. doi: 10.1175/MWR3160.1.
514
Matthews, T., Murpy, C., Wilby, R. L., and Harrigan, S. 2014. Stormiest winter on record for
515
Ireland and UK. Nat. Clim. Change4, 738–740. doi: 10.1038/nclimate2336.
516
Messori, G., and Caballero, R. 2015. On double Rossby wave breaking in the North Atlantic.
517
J. Geophys. Res. Atmos.120, 11129–11150. doi: 10.1002/2015JD023854.
518
Murray, R. J. and Simmonds, I. 1991. A numerical scheme for tracking cyclone centres from
519
digital data. Part I: Development and operation of the scheme. Aust. Meteorol. Mag. 39,
520
155-166.
521
Neu, U., Akperov, M. G., Bellenbaum, N., Benestad, R., Blender, R., and co-authors. 2013.
522
IMILAST - a community effort to intercompare extratropical cyclone detection and
523
tracking algorithms: assessing method-related uncertainties. Bull. Am. Meteorol. Soc. 94,
524
529-547. doi: 10.1175/BAMS-D-11-00154.1.
525
Parker, D. J. 1998. Secondary frontal waves in the North Atlantic region: A dynamical
526
perspective of current ideas. Q. J. Roy. Meteorol. Soc. 124, 829–856.
527
doi: 10.1002/qj.49712454709.
528
Pinto, J. G., Spangehl, T., Ulbrich, U. and Speth, P. 2005. Sensitivities of a cyclone detection
529
and tracking algorithm: Individual tracks and climatology. Meteorol. Z. 14, 823-838. doi:
Pinto, J. G., and Raible C. C. 2012. Past and recent changes in the North Atlantic oscillation.
532
Wiley Interdisc. Rev. Clim. Change3, 79–90. doi: 10.1002/wcc.150.
533
Pinto, J. G., Bellenbaum, N., Karremann, M. K., and Della-Marta, P. M. 2013. Serial
534
clustering of extratropical cyclones over the North Atlantic and Europe under recent and
535
future climate conditions, J. Geophys. Res. Atmos., 118, 12476–12485. doi:
536
10.1002/2013JD020564.
537
Pinto, J. G., Gómara, I., Masato, G., Dacre, H. F., Woollings, T., Caballero, R. 2014.
Large-538
scale dynamics associated with clustering of extra-tropical cyclones affecting Western
539
Europe. J. Geophys. Res. Atmos.,119, 13704–13719. doi: 10.1002/2014JD022305.
540
Raible, C. C., Della-Marta, P., Schwierz, C., Wernli, H., and Blender, R., 2008. Northern
541
Hemisphere extratropical cyclones: A comparison of detection and tracking methods and
542
different reanalyses. Mon. Weather Rev.136, 880-897. doi: 10.1175/2007MWR2143.1.
543
Rienecker, M. M., Suarez M. J., Gelaro R., Todling, R., Bacmeister J., and Coauthors. 2011.
544
MERRA: NASA's Modern-Era Retrospective Analysis for Research and Applications. J.
545
Clim.24, 3624–3648. doi: 10.1175/JCLI-D-11-00015.1.
546
Rudeva, I., and Gulev, S.K. 2007. Climatology of cyclone size characteristics and their
547
changes during the cyclone life cycle. Mon. Weather Rev. 135, 2568–2587. doi:
548
10.1175/MWR3420.1.
549
Rudeva, I., Gulev, S. K., Simmonds, I., and Tilinina, N. 2014. The sensitivity of
550
characteristics of cyclone activity to identification procedures in tracking algorithms. Tellus
551
A, 66, 24961. doi: 10.3402/tellusa.v66.24961.
552
Serreze, M. C. 1995. Climatological aspects of cyclone development and decay in the Arctic.
553
Atmos.-Ocean33, 1-23. doi: 10.1080/07055900.1995.9649522
Simmonds, I., Keay, K. and Lim, E.-P. 2003. Synoptic activity in the seas around Antarctica.
555
Mon. Weather Rev. 131, 272-288. doi:
10.1175/1520-556
0493(2003)131<0272:SAITSA>2.0.CO;2.
557
Sinclair, M. R., 1994. An objective cyclone climatology for the Southern Hemisphere. Mon.
558
Wea. Rev. 122, 2239-2256. doi: 10.1175/1520-0493(1994)122<2239:AOCCFT>2.0.CO;2.
559
Sinclair, M. R. 1997. Objective identification of cyclones and their circulation intensity, and
560
climatology. Weather Forecast. 12, 595-612. doi:
10.1175/1520-561
0434(1997)012<0595:OIOCAT>2.0.CO;2.
562
Trigo, I. F. 2006. Climatology and interannual variability of storm-tracks in the Euro-Atlantic
563
sector: a comparison between ERA-40 and NCEP/NCAR reanalyses. Clim. Dyn. 26, 127–
564
143. doi: 10.1007/s00382-005-0065-9.
565
Uppala, S. M., Källberg, P. W., Simmons, A. J., Andrae, U., Bechtold, V. D. C., and
co-566
authors. 2005. The ERA-40 re-analysis. Q. J. Roy. Meteorol. Soc. 131, 2961–3012.
567
doi: 10.1256/qj.04.176.
568
Vitolo, R., Stephenson, D. B., Cook, I. M., and Mitchell-Wallace, K. 2009. Serial clustering of
569
intense European storms. Meteorol. Z.,18, 411-424. doi: 10.1127/0941-2948/2009/0393
570
Wang, X. L., Swail, V. R. and Zwiers, F. W. 2006. Climatology and changes of extratropical
571
cyclone activity: Comparison of ERA-40 with NCEP-NCAR reanalysis for 1958-2001. J.
572
Clim.19, 3145-3166. doi: 10.1175/JCLI3781.1.
573
Wernli, H. and Schwierz, C. 2006. Surface cyclones in the ERA-40 dataset (1958-2001). Part
574
I: Novel identification method and global climatology. J. Atmos. Sci. 63, 2486-2507. doi:
575
10.1175/JAS3766.1.
576
Zolina, O. and Gulev, S. K. 2002. Improving the accuracy of mapping cyclone numbers and
577
frequencies. Mon. Weather Rev. 130, 748-759. doi:
Figures
580 581
582
Figure 1: (a) Cyclone count time series of cyclone passages in January 2007 for different
583
methods (M02-M22, cf Table 1) for the grid point 55ºN, 5ºW (black dot in b). Events on
584
January 13th are marked in colour for each method. (b) Map with tracks corresponding to
585
marked events in a). Closest position of the track to the grid point is marked by +.
586
587 588
589 590
Figure 2: Average number of DJF cyclone passages 𝑦̅ for each of the 15 methods (M02-M22,
591
HOD) derived from ERA-Interim (1979-2010).
592
593 594 595 596
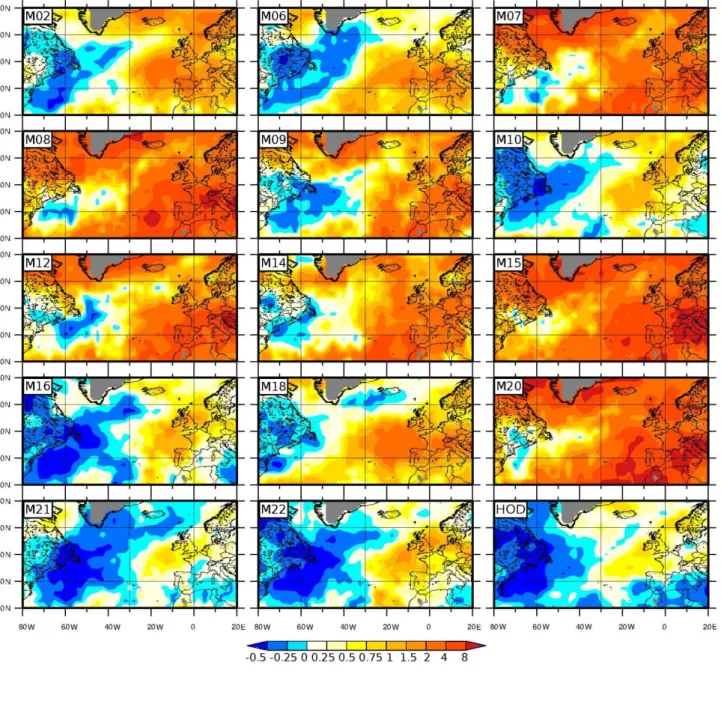
597 598
Figure 3 Variance of DJF cyclone passages (𝑠𝑦)2 for each of the 15 methods (M02-M22,
599
HOD) derived from ERA-Interim (1979-2010).
600
601
602 603
604 605
Figure 4: Dispersion statistic 𝜙 for each of the 15 methods (M02-M22, HOD) derived from
606 ERA-Interim (1979-2010). 607 608 609 610
611
612 613
Figure 5: Variance (𝑠√𝑦)2(y-axis) and mean of cyclone track counts per winter 𝑦̅ (x-axis) for
614
the grid point 55ºN, 5ºW for each method (M02-M22,HOD). Isolines of dispersion statistic 𝜙
615
are depicted in black (for values 0 to 5). The gray area depicts a 95% (bootstrap) confidence
616
interval for the variance, under the assumption of no overdispersion.
617
618 619
620 621
Figure 6: Estimated dispersion statistic 𝜙′ quantified with 4 ∙ (𝑠√𝑦)2-1 for each of the 15
622
methods (M02-M22, HOD) derived from ERA-Interim (1979-2010).
623
624 625
626 627
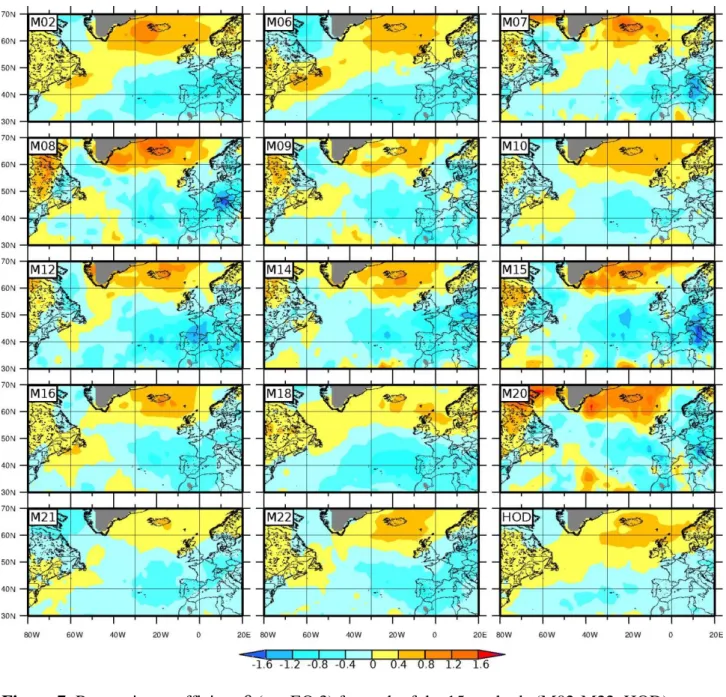
Figure 7: Regression coefficient 𝛽 (see EQ.3) for each of the 15 methods (M02-M22, HOD)
628
derived from ERA-Interim (1979-2010).
630
Figure 8: Effect of NAO on dispersion following 4𝛽2(𝑠𝑥)2 for each of the 15 methods
(M02-631
M22, HOD) derived from ERA-Interim (1979-2010).
632
634
Figure 9: Relative effect of NAO on dispersion following 𝛽2(𝑠𝑥)2/(𝑠 √𝑦)
2
for each of the 15
635
methods (M02-M22, HOD) derived from ERA-Interim (1979-2010).
636
637
638
Table 1: List of cyclone tracking methods used in this study according to the IMILAST
640
project denominations (Code M02-M22, HOD), main references of the method description,
641
and main variable used (MSLP: mean sea level pressure; VORT: vorticity or Laplacian of
642
MSLP; Z850 VORT: vorticity at 850 hPa; Z850: geopotential height at 850 hPa; grad.:
643
gradient of MSLP; min: minimum).
644
645
Code Main references for method description Main variable used M02 Murray and Simmonds (1991), Pinto et al. (2005) MSLP (min), VORT M06 Hewson (1997), Hewson and Titley (2010) MSLP (min. grad.)
M07 Flaounas et al. (2014) Z850 VORT
M08 Trigo (2006) MSLP (min. grad.)
M09 Serreze (1995), Wang et al. (2006) MSLP (min. grad.), VORT
M10 Murray and Simmonds (1991), Simmonds et al. (2003) MSLP (min), VORT M12 Zolina and Gulev (2002), Rudeva and Gulev (2007) MSLP (min)
M14 Kew et al. (2010) Z850 (min. contour)
M15 Blender et al. (1997), Raible et al. (2008) MSLP (min)
M16 Lionello et al. (2002) MSLP (min)
M18 Sinclair (1994, 1997) Z850 VORT
M20 Wernli and Schwierz (2006) MSLP (min)
M21 Inatsu (2009) Z850 VORT
M22 Bardin and Polonsky (2005), Akperov et al. (2007) MSLP (min. contour) HOD Hodges (1994), Hodges (1999), Hodges et al. (2011) Z850 VORT
646 647
Supplementary Material
648 649 650
651
Figure S1: Examples of time series with randomness, regularity and clustering of counts. For
652
more details see text.
653
654 655
656 657
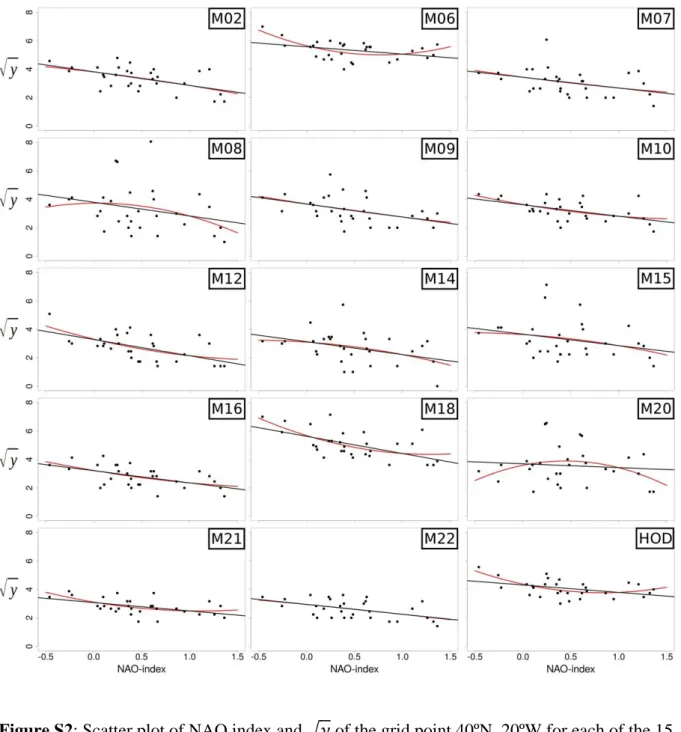
Figure S2: Scatter plot of NAO index and √𝑦 of the grid point 40ºN, 20ºW for each of the 15
658
methods (M02-M22, HOD) derived from ERA-Interim (1979-2010) including the linear
659
(black line) and the quadratic (red line) fits.
660
662 663
Figure S3: Scatter plot of NAO index and √𝑦 of the grid point 62.5ºN, 20ºW for each of the
664
15 methods (M02-M22, HOD) derived from ERA-Interim (1979-2010) including the linear
665
(black line) and the quadratic (red line) fits.
666
667 668