ResearchOnline@JCU
This file is part of the following work:
Cheok, Jessica (2018)
Systematic conservation planning in marine environments:
sensitivities of the planning framework to aspects of scale.
PhD Thesis, James
Cook University.
Access to this file is available from:
https://doi.org/10.25903/5be21337d3ad0
Copyright © 2018 Jessica Cheok
The author has certified to JCU that they have made a reasonable effort to gain
permission and acknowledge the owners of any third party copyright material
included in this document. If you believe that this is not the case, please email
Systematic conservation planning in marine
environments – sensitivities of the planning framework
to aspects of scale
Thesis submitted by
Jessica Cheok
BSc GDipResMeth
June 2018
For the degree of Doctor of Philosophy
Australian Research Council Centre of Excellence for Coral Reef Studies
College of Science and Engineering
James Cook University
Statement of contribution of others
Research funding
James Cook University International Postgraduate Research Scholarship Award (stipend for 3 years)
ARC Centre of Excellence for Coral Reef Studies
School of Earth and Environmental Sciences, James Cook University
AUD $ 79,000
AUD $ 7,000
AUD $ 2,000
Thesis committee
Distinguished Professor Robert L. Pressey, Australian Research Council Centre of Excellence for Coral Reef Studies, James Cook University, Townsville, Queensland, Australia
Dr Rebecca Weeks, Australian Research Council Centre of Excellence for Coral Reef Studies, James Cook University, Townsville, Queensland, Australia
Dr James Moloney, College of Science and Engineering, James Cook University, Townsville, Queensland, Australia
Dr Jeremy VanDerWal, College of Science and Engineering, James Cook University, Townsville, Queensland, Australia
Editorial support
Robert Pressey, Rebecca Weeks, Tiffany Morrison, Graeme Cumming, James Moloney, Serge Andréfouët, Scott Parsons, Collin Storlie, Steven Vandervalk, Christopher Cheok, and
anonymous reviewers.
Technical support
Robert Pressey, Rebecca Weeks, James Moloney, Jeremy VanDerWal, Tiffany Morrison, Matt Watts, Collin Storlie, Loïc Thibaut, Scott Parsons, Andrew Norton, Wayne Mallett, and Jason Bell.
Data providers
Serge Andréfouët, Institut de Recherche pour le Développement, Nouméa, New Caledonia (geomorphological reef-class maps for Chapters 2, 3)
Phil Bright, The Pacific Community, Nouméa, New Caledonia (population data and shapefiles of census areas for Chapter 2)
Declaration on ethics
Acknowledgements
I would like to begin with heartfelt gratitude to my supervisors, who have been involved in my thesis throughout my candidature: Bob Pressey and Rebecca Weeks. I am enormously grateful and honoured for the unfailing support and incredible intellectual input I have received from you both during this time. Thank you for the freedom to explore interesting and ambitious ideas, and the many hours of inspiring and encouraging meetings. There is no doubt that this challenging journey would not have been as enjoyable or enlightening without either of your supervision. Bob, it has been a real honour to work with and learn from you. Your wisdom, fortitude, and passion for conservation planning and thoughtful research constantly inspires me and will continue to do so in all my future work. Bec, thank you for being a source of endless insights in all aspects of research – even when you have been en route to a conference, workshop, holiday, or new home! Suffice it to say that my work would not have been as well considered without your continuous wit for all things constructive. You are both such immense sources of inspiration and for this, I am most grateful.
I am greatly appreciative of James Moloney and Jeremy VanDerWal. James, thank you for all your help and advice in the beginning with all things spatial, and never failing to support me and my research. Jeremy, thank you for providing the knowledge and skills that allowed me to explore conservation planning scenarios that have never been undertaken before. I am especially grateful to Tiffany Morrison and Graeme Cumming for their expertise and guidance in my research. Tiffany, thank you for being willing to get involved in my final year and sharing such a wealth of wisdom in anything related to social science, political geography, and general
academia. Graeme, thank you for always taking the time to provide me with such insightful feedback and thoughtful discussions on my ideas and manuscripts. I really appreciate all the valuable advice I have received from you.
I am deeply indebted to all the gatekeepers of data that I have had the fortune of meeting throughout my research. In particular, Geoff Lipsett-Moore – for believing in my research ideas and interests despite having never met me. You opened the door to a world of applied
conservation planning that gave me invaluable experiences and insights into on-ground
Phil Bright, thank you for all your practical advice and assistance with accessing datasets for the Pacific region.
I am extremely grateful to all of the key informants that agreed to participate in my interviews. These interviews demanded much valuable time from your busy schedules and yet you were still willing to help with my research. Thank you for the invaluable insights that I gained from them.
This thesis would not have been possible without the financial and administrative support of James Cook University and its Graduate Research School, as well as the School of Earth and Environmental Sciences and the ARC Centre of Excellence for Coral Reef Studies. In particular, I would like to thank Debbie Berry – without all of your guidance during the upgrade process, none of this would have happened. A big thanks to the administrative staff at the Centre, whose steadfast support considerably lessened bureaucratic pains throughout my candidature: Janet Swanson, Vivian Doherty, Olga Bazaka, Jenny Lappin, Alana Grech, and Paula Gaffney. Thanks also to the IT staff at JCU, Andrew Norton and Wayne Mallet. Your assistance at all times has meant my success with any of the machines I have had to use during my candidature. Sincere and immense gratitude to Collin Storlie – you were a most cherished source of statistical, R, and HPC expertise; it is certain that my thesis would not have been what it is without your time, effort, and knowledge. Thanks to Loïc Thibaut for brilliant statistical advice – you made some analysis-related decisions infinitely easier to understand. Thanks also to Bob’s mob, who provided me with valuable and constructive feedback and support during my candidature. Finally, I sincerely appreciate the financial and administrative support I received from The Nature Conservancy Pacific Division that allowed me to participate in the New Britain planning workshops.
Lastly, and far from least, my family and friends. To the dear friends I have had the pleasure and honour of meeting during my time in Townsville (and those that remain from past lives), these friendships have fulfilled and enriched my life immensely and are what fuels and inspires me. I am forever grateful to my dearest friends and housemates – no words can express my deep appreciation for your existence, endless support and wise advice: Pacha, Lorenzo, Fei, and Ben. This thesis was made in part from the incredible, never-ending feasts and unparalleled
Outputs related to thesis
Peer-reviewed papers
Cheok, J., R. L. Pressey, R. Weeks, S. Andréfouët, and J. Moloney. 2016. Sympathy for the devil: detailing the effects of planning-unit size, thematic resolution of reef classes, and
socioeconomic costs on spatial priorities for marine conservation. PLoS ONE. 11(11):e0164869.1
Cheok, J., R. L. Pressey, R. Weeks, J. VanDerWal, and C. Storlie. 2018. The plans they are a-changin’: more frequent iterative adjustment of regional priorities in the transition to local actions can benefit implementation. Diversity and Distributions. 24(1):48-57.2
Papers in review
Cheok, J., R. Weeks, and R. L. Pressey. In review. Identifying the strengths and weaknesses of conservation planning at different scales: the Coral Triangle as a case study. Ecology and Society.3
Cheok, J., R. Weeks, T. H. Morrison, and R. L. Pressey. In review. Scalar capital as ingredient of success in multiscale conservation governance. Global Environmental Change.4
Conference presentations
Cheok, J., R. L. Pressey, R. Weeks, J. VanDerWal, and C. Storlie. 2018. The plans they are a-changin’: more frequent iterative adjustment of regional priorities in the transition to local actions can benefit implementation. 5th Oceania Congress for Conservation Biology, Wellington, New Zealand.
Cheok, J., R. Weeks, T. H. Morrison, and R. L. Pressey. 2018. Unpacking the theory and practice of multiscale marine conservation planning. 5th International Marine Conservation Congress, Kuching, Malaysia.
Cheok, J., R. L. Pressey, R. Weeks, S. Andréfouët, and J. Moloney. 2016. Detailing the effects of planning-unit size, thematic resolution of habitats, and socioeconomic costs on spatial priorities for marine conservation. 4th Oceania Congress for Conservation Biology, Brisbane, Australia.
Cheok, J., R. L. Pressey, R. Weeks, J. VanDerWal, and C. Storlie. 2016. Simulating the dynamic transition from regional designs to local actions. 13th International Coral Reef Symposium, Honolulu, Hawaii.
Other outputs generated during candidature
Peer-reviewed papers
Álvarez-Romero, J. G., M. Mills, V. M. Adams, G. G. Gurney, R. L. Pressey, R. Weeks, N. C. Ban, J. Cheok, T. E. Davies, J. C. Day, M. A. Hamel, H. M. Leslie, R. A. Magris, and C. Storlie. In press. 2018. Research advances and gaps in marine planning: towards a global database in systematic conservation planning. Biological Conservation.
Technical reports
Lipsett-Moore, G., N. Peterson, J. Butler, R. Wise, C. Apelis, S. Meharg, K. Kalit, R. James, R. Hamilton, B. Masike-Liri, J. Allan, D. Hayes, J. Cheok, T. Seeto, and M. Fischer. 2017. Ridges to Reefs Assessment for New Britain, PNG: Planning for Responsible, Sustainable Development (East New Britain). TNC Pacific Division Report No. 2/10. 83pp.
Abstract
Problems of scale abound in the science, governance, and conservation planning of complex social-ecological systems. In systematic conservation planning processes, which aim to
effectively and efficiently allocate conservation interventions in space and time, nearly half of the stages in the planning framework involve decisions directly related to scale. The implications of scale-related problems are still poorly understood by conservation planners and researchers, as well as approaches to deal with these problems and integrate explicit multiscale thinking into the planning process. Thus, the overall goal of this thesis is to improve understanding of the different influences of scale on conservation planning outcomes, with the ultimate goal of making specific recommendations to improve the conservation planning framework to deal with scale more explicitly. As such, the structure of this thesis mirrors the relevant stages in the planning framework that involve scale-explicit decisions, organized by the two groups of scale considerations: technical versus practical.
The first research objective of my thesis seeks to understand the extent to which technical aspects of setting spatial priorities for marine conservation (‘spatial prioritisations’) influence where priorities are determined, and how this relates to conservation strategies that rely on broad, coarse-resolution prioritisations to guide the locations of finer-resolution priorities are actions. I address this objective in Chapter 2 by quantifying the individual and interacting effects of three prioritisation factors on spatial priorities for marine conservation: (1) planning-unit size, (2) thematic resolution of coral reef classes, and (3) spatial variability of socioeconomic costs. I used Fiji and Micronesia as case studies and found that all three factors influenced spatial priorities to different extents, with the spatial variability of socioeconomic costs having the largest influence, followed by planning-unit size and thematic resolution of reef classes. Furthermore, I identified an interaction effect between the thematic resolution of reef classes and the socioeconomic cost data used. These findings have important implications for the strategy of relying on coarse-resolution prioritisations to guide finer-coarse-resolution assessments and invalidate a number of implicit assumptions that are made when adopting such strategy.
Progressing to practical considerations of scale, my second research objective seeks to investigate the implications of another strategy commonly assumed or proposed to overcome scale
explore how frequently regional priorities should be updated as local actions are gradually
implemented. Using Fiji as a case study region, I found that changes in the frequency of updating regional priorities did not influence the total time taken to achieve conservation objectives, or the total extent of final reserve systems. However, I did identify two potential benefits to updating priorities more frequently: faster achievement of objectives for high-priority features, and greater potential to capitalise on areas that have previously had conservation efforts applied. This work provides insights into trade-offs to consider regarding the frequency of updating regional conservation assessments, which vary depending on specific planning contexts.
My third research objective seeks to determine if there is an optimal scale at which to conduct conservation planning, as a precursor to understanding how best to integrate planning across multiple scales (‘multiscale conservation planning’). I address this in Chapter 4 by elucidating the respective strengths and weaknesses of conservation plans developed at different jurisdictional levels in the Coral Triangle region (e.g., local, national) to adequately consider multiple social and ecological scales. I found that no plans I assessed were able to adequately address all social and ecological scales, and that plans generally best addressed social and ecological components representative of the same level at which the plan was developed. This research adds nuanced appreciation of the limitations of lower- versus higher-level conservation planning. While these respective limitations are understood as the general inability to consider components at other scales, I demonstrate that these limitations can be attributed to differences in technical versus conceptual abilities. My findings demonstrate the necessity for vertical integration between planning levels as a means to overcome their respective limitations.
characteristics constitute a new form of conservation capital, ‘scalar capital’, as a necessary resource or investment for successful outcomes across multiple scales.
My thesis contributes nuanced understanding of the sensitivities of the conservation planning framework to aspects of scale, in both theory and practice. I offer specific recommendations for each of the relevant stages in the conservation planning framework that involve scale-explicit concerns and illuminate some implications of existing problems and influences of scale. Essentially, it is the aim of my thesis to conduct research that can enable conservation
Table of Contents
Statement of contribution of others ... iv
Acknowledgements ... vi
Outputs related to thesis ... viii
Other outputs generated during candidature... ix
Abstract ... x
Table of Contents... xiii
1 General Introduction ... 3
1.1 Research context ... 3
1.1.1 Concept of scale in ecology and environmental science ... 3
1.1.2 Systematic conservation planning ... 4
1.1.3 Influence of scale in spatial prioritisations ... 5
1.1.4 Transitioning between regional conservation assessments and local actions ... 9
1.1.5 Integrating planning across multiple scales with social-ecological systems theory ... 10
1.2 Improving explicit considerations of scale in conservation planning ... 12
1.2.1 Technical concerns (stages 5 & 6)... 12
1.2.2 Practical concerns (stages 1, 9 & 10) ... 13
1.3 Thesis goals and objectives ... 13
1.4 Study regions ... 14
1.5 Thesis structure... 15
2 Sympathy for the devil: detailing the effects of spatial prioritisation factors on priorities for marine conservation ... 20
2.1 Abstract ... 20
2.2 Introduction... 20
2.3 Methods ... 22
2.3.1 Study regions ... 22
2.3.2 Study design ... 25
2.3.3 Planning-unit size ... 25
2.3.4 Thematic resolution ... 26
2.3.5 Socioeconomic cost data ... 27
2.3.6 Priority-setting tool parameters and calibrations ... 28
2.4 Results ... 33
2.4.1 Individual effects of prioritisation factors ... 33
2.4.2 Interaction effects between prioritisation factors ... 37
2.4.3 Ability of coarse prioritisations to represent finer-resolution priorities ... 38
2.5 Discussion ... 41
2.5.1 Individual effects of prioritisation factors ... 41
2.5.2 Interaction effects between prioritisation factors ... 42
2.5.3 Ability of coarse prioritisations to represent finer-resolution priorities ... 44
2.6 Conclusions ... 45
3 The plans they are a-changin’: more frequent iterative adjustment of regional priorities in the transition to local actions can benefit implementation ... 49
3.1 Abstract ... 49
3.2 Introduction... 49
3.3 Methods ... 51
3.4 Results ... 57
3.4.1 Total time taken ... 57
3.4.2 Total extent ... 60
3.4.3 Spatial overlap ... 60
3.5 Discussion ... 62
4 Identifying the strengths and weaknesses of conservation planning at different scales: the Coral Triangle as a case study ... 68
4.1 Abstract ... 68
4.2 Introduction... 68
4.3 Methods ... 71
4.3.1 Assessing the adequacy with which ecological objectives are addressed ... 72
4.3.2 Assessing the adequacy with which socioeconomic objectives are addressed ... 75
4.4 Results ... 76
4.4.1 Strengths and weaknesses of plans to address intra-level versus extra-level objectives ... 76
4.4.2 Strengths and weaknesses of plans in addressing ecological and socioeconomic objectives ... 78
4.5 Discussion ... 80
4.5.1 Apparent strengths and weaknesses of lower-level planning ... 80
4.5.2 Apparent strengths and weaknesses of higher-level planning ... 81
4.5.4 Limitations ... 84
4.6 Conclusions ... 84
5 Scalar capital as ingredient of success in multiscale conservation governance: evidence from Melanesia ... 88
5.1 Abstract ... 88
5.2 Introduction... 88
5.3 Multiscale conservation governance ... 89
5.4 Methods ... 93
5.4.1 Identifying scalar pathway case studies ... 93
5.4.2 Document review ... 93
5.4.3 Key-informant interviews and participant observation ... 93
5.4.4 Analysis ... 94
5.5 Multidirectional scaling: multiscale planning in practice ... 94
5.6 Scalar capital as input and outcome of multiscale planning success ... 97
5.7 Novel dimensions of scalar capital ... 101
5.7.1 Multiscale understanding ... 101
5.7.2 Scale jumping: types and enabling mechanisms ... 102
5.8 Scope to foster dimensions of scalar capital ... 107
5.9 Conclusion ... 108
6 General Discussion ... 112
6.1 Thesis summary... 112
6.2 Achievement of objectives and thesis contributions ... 113
6.2.1 Technical concerns of scale in conservation planning (stages 5 & 6) ... 113
6.2.2 Practical concerns of scale in conservation planning (stages 1, 9 & 10)... 115
6.3 Remaining gaps and scope for future work ... 121
6.4 Returning to real-world context ... 123
6.5 Conclusions ... 124
References ... 125
Appendix 1. Chapter 2 Supplementary materials ... 142
Appendix 2. Chapter 3 Supplementary materials ... 149
Appendix 3. Chapter 4 Supplementary materials ... 155
List of figures
Figure 1.1 Systematic conservation planning framework adapted from Pressey and Bottrill (2009)
... 5
Figure 1.2 Schematic representation of the assumptions of homogeneity (1) and nestedness (2), implicit in the approach of relying on coarse prioritisations to guide finer-resolution assessments ... 8
Figure 1.3 Social-ecological systems framework reproduced from Ostrom (2009) ... 11
Figure 1.4 Overview of thesis structure ... 15
Figure 2.1 Regional context and enlarged maps of the two study regions: (A) Micronesia and (B) Fiji... 24
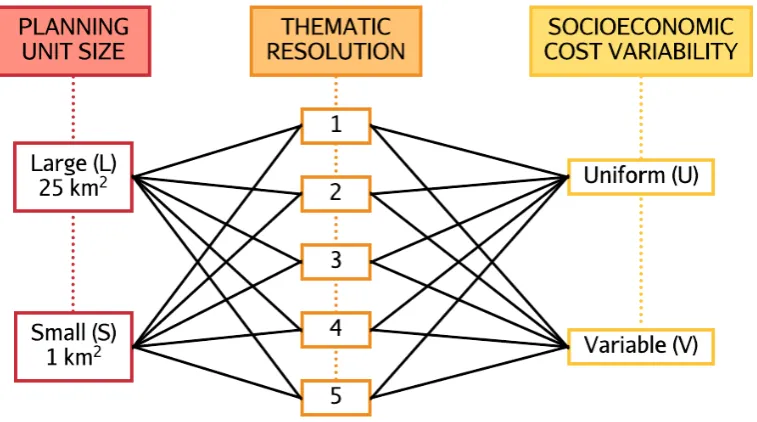
Figure 2.2 Study design showing tested factors, factor levels, and the 20 unique combinations between all levels ... 25
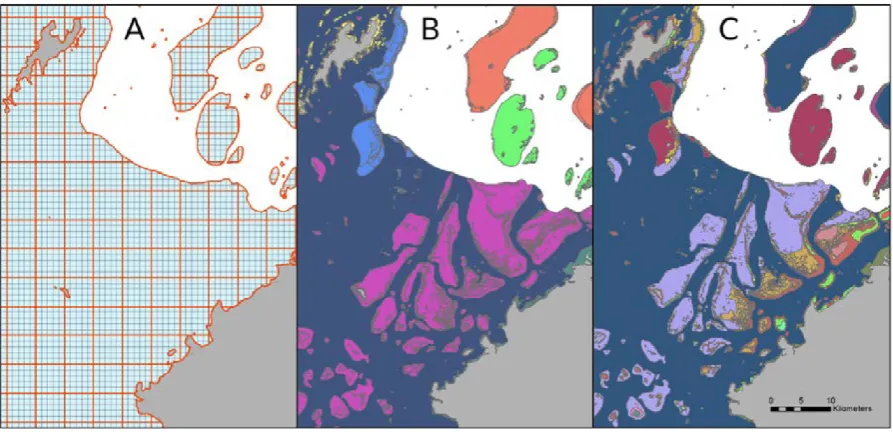
Figure 2.3 Example maps of planning-unit sizes and thematic resolutions explored in the Fiji dataset ... 27
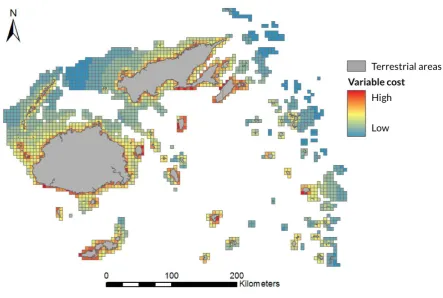
Figure 2.4 Example map showing distribution of cost variability across the Fiji planning region ... 28
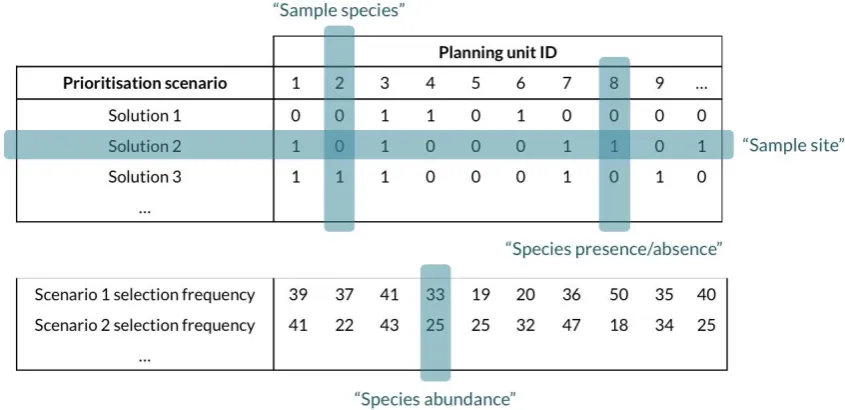
Figure 2.5 Example of Marxan output data ... 30
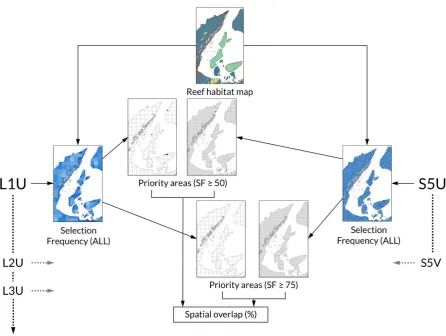
Figure 2.6 The flow of analyses related to spatial nestedness... 32
Figure 2.7 Comparisons of total reserve size and proportions of maximum possible cost ... 34
Figure 2.8 Spatial dissimilarity between all 2000 solutions for the Fiji case study ... 36
Figure 2.9 Comparison of spatial variation between all solutions produced using RDA for the Fiji case study ... 37
Figure 2.10 Nestedness of high-priority small planning units (test scenarios) within high-priority areas defined by large planning units ... 39
Figure 2.11 Incidental representation of level 5 reef classes by scenarios using large planning units ... 40
Figure 3.1 Transitions from regular prioritised planning units used in assessment to irregular management units used to apply actions ... 52
Figure 3.3 Total times taken to achieve all conservation objectives across scenarios, indicated by total numbers of planning unit investigations throughout the simulations ... 58 Figure 3.4 Numbers of unique planning units investigated and reinvestigated during the
simulations... 59 Figure 3.5 Spatial results for implemented marine reserves ... 61 Figure 4.1 SES framework reproduced from Cumming et al. (2015) summarising patterns and
processes at different social and ecological scales ... 70 Figure 4.2 Overview of analytical process (adapted from Magris et al. 2014), depicting major steps
in analysing each conservation plan against the SES framework ... 74 Figure 4.3 Differences in ecological and social levels addressed by conservation plans developed
at different levels... 77 Figure 4.4 Differences in breadth and extent of stakeholder engagement across the four planning levels ... 79 Figure 5.1 Conceptual representations of directional movement (e.g., of planning resources, such
as data or funding) across multiple jurisdictional levels over time ... 91 Figure 5.2 Relationships between spatial extents and jurisdictional levels in the two study regions: Papua New Guinea (PNG) and Solomon Islands (SI) ... 92 Figure 5.3 Simplified depiction of scalar pathways among published conservation planning
processes in Papua New Guinea and Solomon Islands between 1995 and 2017... 95 Figure 5.4 Schematic depiction of the five types of scale jumping identified, across various
jurisdictional levels: (1) integrating lessons from other scales, (2) contextualising, (3) grounding, (4) forecasting, and (5) accessing exogenous and cross-level resources ... 103 Figure 5.5 Combinations of types of scale jumping and enabling mechanisms identified from
interviews with key informants involved in conservation planning in PNG and SI ... 105 Figure 6.1 Summary of the contributions of each chapter in this thesis, in the context of the
List of tables
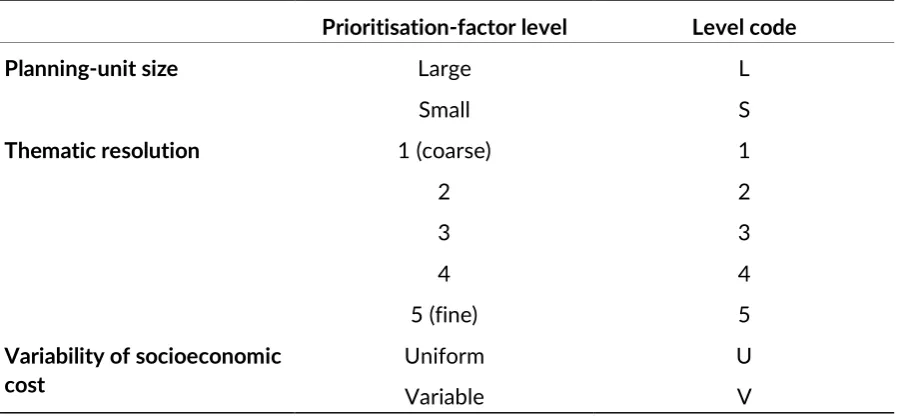
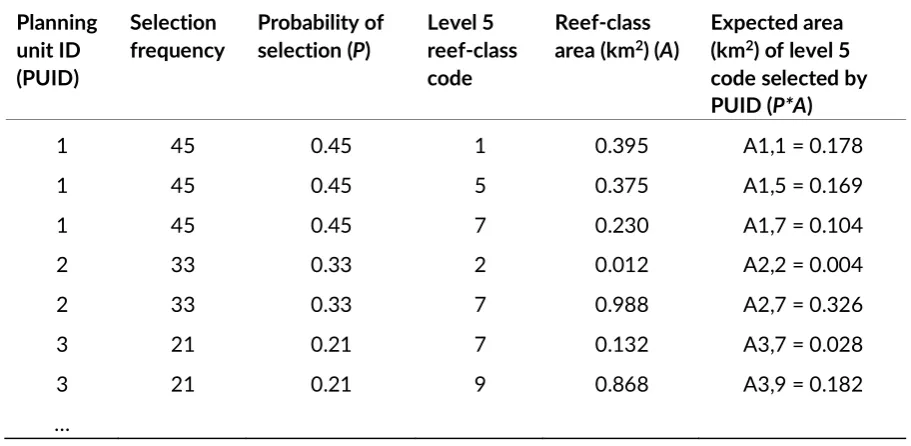
Table 1.1 Definitions of key scale-related terms and concepts. ... 4 Table 2.1 Coding system to identify individual scenarios... 26 Table 2.2 Summary of output comparisons and statistical analyses for each research aim ... 29 Table 2.3 Method calculating the expected areas of level 5 reef classes that would be selected for reservation in each of the scenarios using large planning units ... 33 Table 2.4 Permutation test results showing significance of each of the tested prioritisation factors in influencing the spatial dissimilarity of solutions ... 37 Table 3.1 Definitions of key terms used to describe the simulations ... 54 Table 4.1 Summary of all conservation plans and associated reports collated for evaluations of
scalar coverage... 73 Table 5.1 Summary of definitions, example outcomes, and indicators for the five forms of capital
relevant to conservation planning processes (natural, financial, human, social, and institutional) from Bottrill & Pressey (2012), with the addition of scalar capital as a
Chapter 1
1
General Introduction
1
General Introduction
Environmental problems and ecosystem degradation are now globally widespread (Levin et al. 2013, Palomo et al. 2014, Cumming et al. 2017). With the increasing globalisation of
socioeconomic and cultural systems (Hill et al. 2015), the scale of problems that require solutions are also becoming increasingly complex (Virapongse et al. 2016). At the same time, there is little evidence of the successes of conservation efforts around the world, in terms of avoided loss of biodiversity or real gains in human well-being (McShane et al. 2011, Gill et al. 2017, Barnes et al. 2018). It is now more pertinent than ever that endeavours in conservation and natural resource governance be conducted effectively and to consider complex social-ecological systems as a whole (Levin et al. 2013).
1.1
Research context
1.1.1 Concept of scale in ecology and environmental science
The importance of scale has been recognised for decades in sciences concerned with the spatial organisation of human activities and physical processes (Marceau 1999). Issues of scale pervade many fields of enquiry, from geography, the very foundation of which concerns scaling, to atmospheric and earth sciences, which define linkages between local and global patterns, to physical and biological oceanography, where scale guides research and defines sub-disciplines, to physics and certain mathematics, where scale is inextricable in investigations (Wiens 1989). More recently, the developing field of environmental assessment and management has recognised the importance of scale and cross-scale dynamics in environmental processes and change (Cash and Moser 2000). These dynamics of scale are inherent in our understanding of patterns and processes occurring in the natural world.
For more than half a century, studies have shown that social and ecological conclusions derived at one scale are specific to that scale and may not remain valid at different scales (Wiens 1989, Marceau 1999). For example, there is substantial evidence in the scientific literature
my thesis are described in Table 1.1. It is within the context of decision-making in systematic conservation planning (Margules and Pressey 2000), particularly for marine environments, that I examine a number of pervasive scale-related problems.
Table 1.1 Definitions of key scale-related terms and concepts.
Key term Definition
Scale The spatial, quantitative, or analytical spectra that are used to measure and understand social or ecological phenomena, and the relational comparisons between different points along these spectra
Level The units of analysis that are located at different positions on a scale (for example, local and national levels occur along a scale of jurisdictions; Cash et al. 2006)
Extent The size of the spatial, temporal, quantitative, or analytical dimensions of scale
Resolution The precision used in measurement (Scholes et al. 2013) Spatial resolution The minimum spatial unit of measured information
Thematic resolution The amount of geospatial information influencing landscape classification or categorisation (Dalleau et al. 2010)
Fine-resolution Typically associated with conservation prioritisations at local scales (i.e., small spatial extents) and generally involving data at fine (high) resolutions
Coarse-resolution Typically associated with conservation prioritisations at regional or global scales (i.e., large spatial extents) and generally involving data at coarse (low) resolutions
1.1.2 Systematic conservation planning
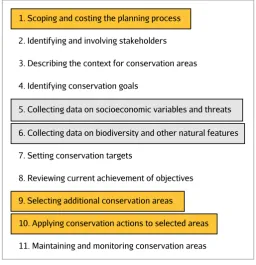
The process of systematic conservation planning (hereafter, ‘conservation planning’) concerns deciding when, where, and how to allocate constrained resources to conserve biodiversity, ecosystem services, and other valuable attributes of the natural environment (Pressey and Bottrill 2009). Conservation planning involves stages from stakeholder engagement through to the application and maintenance of conservation actions (Figure 1.1), and is ideally characterised as a process that should be systematic, flexible, transparent, and accountable (Margules and Pressey 2000). Despite some successful outcomes occurring from conservation planning efforts (e.g., Kapos et al. 2008), factors related to scale that affect nearly half of the stages of the conservation planning framework (Figure 1.1) have frequently resulted in less effective or unsuccessful
distinguish those that concern more technical aspects of conservation planning (e.g., data selection and resolution of assessing spatial priorities; stages 5 & 6 in Figure 1.1) and those more practical in nature (e.g., scoping the optimal scale at which to plan and transitioning from planning at regional scales to implementation at local scales; stages 1, 9 & 10 in Figure 1.1).
Figure 1.1 Systematic conservation planning framework adapted from Pressey and Bottrill (2009). The framework is represented here as consisting of 11 main stages. While presented in linear order, application of this framework in practice should involve feedbacks between later and earlier stages. For example, information learned from maintaining and monitoring applied
conservation areas (stage 11) should be used to inform the selection of any additional
conservation areas (stage 9). Stages highlighted with boxes indicate those that involve decisions directly related to spatial scale (Mills et al. 2010). Grey-coloured boxes signify technical concerns in conservation planning (e.g., data selection or resolution of assessments); orange-coloured boxes, practical concerns (e.g., transitioning from regional designs to local conservation actions).
1.1.3 Influence of scale in spatial prioritisations
Spatial prioritisations (hereafter, ‘prioritisations’) are a key component in conservation planning (stages 5 & 6; Figure 1.1) to ensure efficient and systematic allocation of priority areas for creating protected reserves, which, while not solely adequate for nature conservation, play a critical role in preserving natural biodiversity values (Margules et al. 2002). Prioritisations are typically undertaken by dividing the planning region (the geographic area that is the focus for conservation) into planning units. These are often arbitrary spatial units of assessment and comparison used to determined high-priority areas within which conservation actions might be
1. Scoping and costing the planning process
2. Identifying and involving stakeholders
3. Describing the context for conservation areas
4. Identifying conservation goals
5. Collecting data on socioeconomic variables and threats
6. Collecting data on biodiversity and other natural features
7. Setting conservation targets
8. Reviewing current achievement of objectives
9. Selecting additional conservation areas
10. Applying conservation actions to selected areas
intersected with different spatial layers commonly containing data on biodiversity features (e.g., Pressey & Logan 1995) or socioeconomic costs (e.g., Richardson et al. 2006).
Originally, biodiversity data (or associated surrogates) alone were used for prioritisation
assessments in systematic conservation planning (Margules et al. 2002, Ban and Klein 2009). In the last decade however, conservation planners have increasingly realised the importance of integrating socioeconomic data in prioritisations (Naidoo et al. 2006, Carwardine et al. 2008, Ban et al. 2009a, 2013). The significance of incorporating socioeconomic data stems from the recognition that the success of implementing conservation actions is highly dependent on
predominant stakeholder and community support (Stewart and Possingham 2005). Furthermore, there is evidence indicating that conservation priorities are more sensitive to variation in cost data and degree of threats, compared to variability in how biodiversity is measured (Bode et al. 2008).
Dealing with these spatial data layers alone involves decisions about various aspects of resolution (i.e., spatial, thematic; Table 1.1); additionally, the size or extent of planning regions and
planning units can vary. Unsurprisingly, a number of terrestrial studies on conservation prioritisations have shown that the resolution (of spatial data or planning units) can greatly influence their outcomes (Pressey and Logan 1995, 1998, Rouget 2003, Araújo 2004, Pascual-Hortal and Saura 2007, Arponen et al. 2012). Fewer studies demonstrate analogous findings in marine environments (Richardson et al. 2006, Dalleau et al. 2010, Hamel et al. 2013). Thus, there is strong evidence to suggest that the different modes of resolution acting, and potentially interacting, in the prioritisation process will impact how and where areas are identified as priorities. The extent of these effects is not fully understood, however. Given that prioritisations are increasingly used to determine or justify conservation actions, this is a vital knowledge gap to fill.
Conservation planning often favours large planning regions because these can capture regional-scale ecological processes and patterns, which underpin regional biodiversity (Poiani et al. 2000, Rouget et al. 2006, Pressey et al. 2007). However, there typically exists a trade-off between extent of the planning region, the size (spatial resolution) of the planning units, and the attainable underlying data used to assess the region. This trade-off primarily exists due to resource
(large) planning units exacerbated problems encountered when trying to achieve conservation objectives for small islands that included fishery objectives. This is a salient consideration with almost all the existing tropical coral reef habitats occurring in the Indo-Pacific (Spalding et al. 2007), where most nations are archipelagic.
Coarse (e.g., national level) prioritisations of conservation priorities have become increasingly common around the world, both in terrestrial and marine environments (Olson and Dinerstein 2002, Alpine and Hobday 2007, Klein et al. 2010, Beger et al. 2013, Mazor et al. 2014). One reason for this is the influence of international commitments to achieve global conservation targets (e.g., the Convention on Biological Diversity; Jones et al. 2011, Gray et al. 2014, Watson et al. 2016). Additionally, environmental problems are rarely restricted to local extents and this motivates conservation planning at regional or global extents, which attempts to formulate appropriately-scaled responses to the large scale of problems being managed (Agardy 2005). As a strategy to overcome the disparity between necessary broad-scale ecological views and the much finer-resolutions at which conservation actions need to be applied (Mills et al. 2010), coarse prioritisations have been suggested as a starting point to guide subsequent finer-resolution conservation assessments (Larsen and Rahbek 2003, Fjeldså 2007). However, there are at least two major problems that can arise with this strategy. These are related to two implicit
assumptions that are likely to be invalid. One is the assumption of homogeneity, i.e., that coarse-resolution planning units are internally homogeneous with respect to conservation priority, or that biodiversity features with broad thematic resolution (e.g., ecoregions) are homogeneous with respect to physical and biological characteristics. The other assumption is that of nestedness, i.e., that fine-resolution priorities naturally nest spatially within coarse-resolution priorities. These potentially significant problems have received very little attention in the prioritisation literature, despite being critical aspects that may be undermining recent efforts directed at broad-extent (i.e., regional, international) marine conservation prioritisations (e.g., Beger et al. 2013).
effective conservation actions for these fine-resolution patterns and processes are incidental at best. While one study has demonstrated that reasonable incidental representation is possible with coarse prioritisations identifying marine priorities (Bridge et al. 2016), this haphazard approach should not be relied upon. A considerable challenge here is to determine what levels of resolution are most appropriate for conservation planning, noting the trade-offs between the costs of
obtaining very fine-resolution data and expedited decision-making possible with more easily available coarse-resolution data.
Figure 1.2 Schematic representation of the assumptions of homogeneity (1) and nestedness (2), implicit in the approach of relying on coarse prioritisations to guide finer-resolution assessments. Red grid cells indicate high-priority planning units, demonstrating the likely disparities with fine-resolution environmental variation (1) or priority areas determined using smaller planning units (2).
The second assumption of nestedness is similarly unreliable because it presumes that conservation priorities determined with coarse-resolution planning units will encompass the same areas as those determined with fine-resolution planning units. As with the first assumption, using coarse-resolution planning units will likely result in a loss of compared environmental (or socioeconomic) heterogeneity between units, with priorities over larger areas averaged out and finer variations lost. This means that areas identified as high priority using coarse-resolution planning units may not necessarily translate to an area of the same priority level when fine-resolution planning units are used (Figure 1.2). Such may be the case when the high-priority, fine-resolution planning unit is a small fraction of an otherwise low-priority large (coarse) planning unit, resulting in a low priority level overall. Given the increasing prevalence of regional planning exercises and the common suggestion that planning will progress from coarse to finer scales in many of them (e.g., Klein et al. 2010, Beger et al. 2013), the strategy of relying on coarse prioritisation to guide finer ones and its implicit assumptions must be examined empirically.
ASSUMPTIONS
1) Homogeneity 2) Nestedness
Coarse
Fine SCALE
1.1.4 Transitioning between regional conservation assessments and local actions
A further problem related to scale occurs when navigating the transition from broad-scale, coarse-resolution regional conservation assessments to the implementation of conservation actions at local levels. By assessment, I refer to the design phase of conservation planning (stages 1-9; Figure 1.1), particularly the spatial prioritisation process. By implementation, I reference the translation of assessments into applied actions on the ground (stage 10; Figure 1.1), such as the implementation of protected areas. With regional priority assessments, the spatial extent of the planning region and the planning units becomes mismatched to that of implementing
conservation actions, which occur at much finer-resolution local levels (Pressey et al. 2013). For example, mean sizes of marine protected areas have been reported around ranges of 1-100 km2
(Edgar et al. 2014, White et al. 2014), while planning-unit sizes in coarse prioritisation have been as large as 900 km2 (Venter et al. 2014) or even using whole marine ecoregions (Klein et al.
2010). This mismatch of scales is understood to be an important factor in the failure of regional or global planning to inform local actions (Mills et al. 2010) and is well known as an
‘implementation crisis’ (Biggs et al. 2011) in conservation. This can be seen as a quintessential ‘problem of fit’ (Cash et al. 2006).
As a result of the mismatch between regional conservation assessments and local actions, modifications are required to reconcile the differences between these spheres of operation. This includes incorporating newly obtained information on ecological or social features or constraints, updating the original design to adjust for over- or under-achievement of objectives, and
evaluations of implementation procedures (Mills et al. 2010, Pressey et al. 2013). The most effective strategy to incorporate these modifications into the planning process is still not well understood. Nevertheless, it is argued in the literature that a necessary strategy to incorporate these modifications is in a dynamic, iterative manner (hereafter, ‘iterative planning’) (Holness and Biggs 2011, Pressey et al. 2013, Beger et al. 2015). As new information emerges during the on-ground implementation of conservation actions and adjustments to regional assessments are inevitably made, this will potentially change new areas of priority for subsequent actions (Pressey et al. 2013). Thus, feedbacks between the regional and local perspectives should ideally occur as regional plans transition to implemented actions.
There is considerable acknowledgement of cross-level (between institutions of the same operating scale; e.g., between regional institutions) and cross-scale (between institutions of different
making the dynamic transition to applied local actions, or the implications of this on the
achievement of conservation objectives through time. Some studies have quantified differences in the efficiency of transitioning to local implementation by incorporating governance units in the assessment stages (Aswani and Lauer 2006, Weeks et al. 2010b, Horigue et al. 2015). This approach operates on the assumption that doing so facilitates local actions through minimising the amount of adjustment necessary to planning units. Mills et al.(2014) have proposed using social network analyses to facilitate implementation by strengthening linkages between local and regional conservation actors.
Despite these studies, explicit methods for the dynamic transition between different scales of planning and action remain obscure and have yet to be formally quantified or operationalised. The successful transition between regional assessments and local implementation is a vital knowledge gap to fill in improving conservation outcomes (Knight et al. 2008). Without this knowledge, planning is rendered essentially inapplicable and ineffective, wasting already scarce conservation resources (Bottrill et al. 2008).
1.1.5 Integrating planning across multiple scales with social-ecological systems theory
Over the last two decades, social-ecological systems (SES) theory has increasingly been adopted as the lens through which environmental management and governance are understood and applied (Berkes and Folke 1998, Ostrom 2009, Ban et al. 2013, Cumming et al. 2015). In contrast to earlier conservation concepts, where the focus was on separating human and ecological
Figure 1.3 Social-ecological systems framework reproduced from Ostrom (2009). The four main subsystems of the broader SES system are shown as resource units, resource system, governance system, and users.
Problems of scale in conservation planning commonly involve scale mismatches or problems of fit (Bodin et al. 2014, Epstein et al. 2015), which arise when social or ecological patterns or interactions are scale-dependent (Levin 1992, Ament and Cumming 2016) and operate on different scales (Cumming et al. 2006, 2017, Guerrero et al. 2013). A widespread manifestation of this problem of fit occurs when the spatial extent of an environmental resource misaligns with the jurisdictional extent of institutions in place to manage the resource. An example can be found in the upper tributary watershed in montane mainland Southeast Asia, where multiple counties and local governments have jurisdiction over different parts of the same resource (Lebel et al. 2008). Another common problem relates to temporal mismatches, whereby the temporal scale of the environmental phenomenon operates on timescales different to the institutional response. For example, fishing quotas that are calculated on the basis of maximum sustainable yield are incompatible with the intrinsic dynamics of fish populations (Epstein et al. 2015).
With the prevalence of scale-related problems in conservation planning, the need to consider multiple scales explicitly is now extensively recognised in the literature (Lengyel et al. 2014, Weeks et al. 2014, Guerrero and Wilson 2017). Suggested methods have included: using basic decision frameworks to incorporate scale considerations in conservation triage (du Toit 2010); evaluating stakeholders at different scales through social network analysis to inform actions (Guerrero et al. 2013, Mills et al. 2014); and integrating ecological data representing different scales (e.g., ecosystems, processes, species) into spatial prioritisations (Squeo et al. 2012, Bombi et al. 2013). Other approaches propose sequential planning processes undertaken at successively
RESOURCE SYSTEM
RESOURCE UNITS
GOVERNANCE SYSTEM
USERS
Interactions
Outcomes
Social, economic, and political settings
higher or lower levels. In ‘scaling up’, separate local planning processes are coordinated and placed within a broader context (e.g., Lowry et al. 2009). In ‘scaling down’, planning
incorporates patterns or processes at progressively finer scales, within areas of interest identified at broader scales (Groves et al. 2002). Scaling up and scaling down are not without their
limitations however, with both approaches facing governance and implementation challenges (Lovell et al. 2002, Lowry et al. 2009, Mills et al. 2010, Gaymer et al. 2014).
Despite frequent calls for integration across scales, conservation scientists, policymakers and practitioners have yet to define explicitly what this means or demonstrate how they should approach it (Guerrero et al. 2015b). Given that hundreds of conservation plans are developed every year (Álvarez-Romero et al.in press), more effective and deliberate planning across multiple scales could improve conservation outcomes and achieve greater impact with the limited resources available for conservation. Currently, our understanding of systematic conservation planning techniques far exceeds our ability to apply them effectively to real-world conservation problems (Knight et al. 2006). The core of these problems revolves around: uncertainties about the size of planning units and data resolution, the scales at which we assess conservation priorities and how these translate to actual actions on the ground, and the explicit integration of multiple social and ecological scales throughout the conservation planning framework.
1.2
Improving explicit considerations of scale in conservation planning
It is apparent that conservation planning must move towards more explicit multiscale
considerations, in both theory and practice. To provide the contextual backbone of my thesis, I identify specific knowledge gaps that pertain to the scale-affected stages in the conservation planning framework (Figure 1.1) and outline these below.
1.2.1 Technical concerns (stages 5 & 6)
While scale-explicit considerations have likely occurred most in these stages in the conservation planning literature, there is still a lack of understanding of scale influences on spatial
1. Understanding the individual and interacting effects between different levels of resolution of prioritisation factors on marine spatial priorities.
2. Examining the ability of coarse prioritisations to guide finer-resolution assessments.
1.2.2 Practical concerns (stages 1, 9 & 10)
To begin with, it is still not well understood what the optimal scale to plan at is. Does an optimal scale of planning even exist, or is integrating conservation planning across multiple scales
(hereafter, ‘multiscale planning’) necessary? If multiscale planning is required, how does the initial scale of planning influence the essential later stages of implementing conservation action? The implementation crisis in conservation planning is a critical bottleneck in the effectiveness and success of conservation planning outcomes. The process of dynamically transitioning between regional conservation assessments and locally applied actions and the implications of doing so, particularly in prevailing contexts where actions are applied incrementally over time, must be examined further. Additionally, if multiscale conservation planning is being undertaken, it is crucial to evaluate these processes to understand specific conditions that influence successful outcomes so that future applications can be more effective. I identify five key knowledge gaps related to these concerns:
1. Identifying the optimal frequency with which regional assessments should be updated in the transition to local actions.
2. Understanding the extent to which plans need to change when transitioning from regional assessments to local actions.
3. Elucidating the respective strengths and weaknesses of plans developed at different levels in an SES context.
4. Understanding whether multiscale conservation planning occurs in practice and if so, through what mechanisms.
5. Discerning the factors that impede or facilitate successful outcomes in multiscale planning.
1.3
Thesis goals and objectives
Objective 1. Understand the extent to which technical aspects of setting spatial priorities for marine conservation influence where priorities are determined, and how this relates to assumptions of homogeneity and nestedness.
Objective 2. Quantitatively investigate and operationalise the transition from regional conservation assessments to implementing local actions.
Objective 3. Determine if there is an optimal scale at which to plan to address multiple social and ecological scales.
Objective 4. Investigate the theory and practice behind multiscale conservation planning.
1.4
Study regions
I address the research objectives outlined above using countries with developing economies and significant marine-resource dependency in Southeast Asia and the Western Pacific as case study regions. The Coral Triangle region includes six countries: Indonesia, Malaysia, Papua New Guinea (PNG), Philippines, the Solomon Islands (SI), and Timor Leste. This region is of particular interest and concern for conservation scientists and practitioners because of its global biodiversity importance coupled with highly varied socioeconomic, cultural, and political contexts (Mills et al. 2010, Fidelman et al. 2012). All but two of the Coral Triangle countries (Malaysia and Timor Leste) have some form of decentralised natural resource governance (where decision-making power is devolved to local governments or customary clans; Fidelman et al. 2012), for which problems of scale mismatches are known to be especially acute (Mills et al. 2010). Similarly, the nearby archipelagic and non-industrialised countries of Fiji and Micronesia (the latter considered here to include the Mariana Islands, Marshall Islands, Palau, Guam, and the Federated States of Micronesia) also urgently require effective conservation action but the mismatch between regional-level planning and local-level implementation is large, with primarily devolved resource governance occurring in conjunction with complex social, economic and political factors shaping conservation decisions (Govan et al. 2009, Weeks et al. 2010b, Hamel et al. 2013, Horigue et al. 2015). For these reasons, the developing economies of Southeast Asia and the Western Pacific are significant and relevant study regions to use in my investigations on the problems of scale and scale mismatches in the conservation planning framework.
1.5
Thesis structure
This thesis presents a total of six chapters (Figure 1.4), which consist of a general introduction (this chapter, Chapter 1), four data-based chapters (Chapters 2-5), and a general discussion (Chapter 6). All data-based chapters are presented in this thesis as manuscripts formatted for publication in peer-reviewed journals. The structure of this thesis reflects the varying natures of concern that describe the scale-related decisions and problems that can manifest in the
conservation planning framework (Figures 1.1 & 1.4): technical concerns (Chapter 2), practical concerns (Chapters 4 & 5), and the transition between these two (Chapter 3).
Figure 1.4 Overview of thesis structure.
SCALE-RELATED DECISIONS IN THE CONSERVATION PLANNING FRAMEWORK:
TECHNICAL CONCERNS (Stages 5 & 6): Object ive 1.
Under st and t he ext ent t o w hich t echnical aspect s of set t ing spat ial pr ior it ies inf luence w her e pr ior it ies ar e det er mined, and how t his r elat es t o assumpt ions of homogeneit y and nest edness.
PRACTICAL CONCERNS (Stages 1, 9 & 10): Object ive 3.
Det er mine if t her e is an opt imal scale at w hich t o plan t o addr ess mult iple social and ecological scales. Object ive 4.
Invest igat e t he t heor y and pr act ice behind int egr at ing conser vat ion planning acr oss mult iple scales.
Chapt er 2.
How do technical aspects of determining spatial priorities influence their location, and how does this relate to the ability of coarse-resolution priorities to represent fine-resolution priorities?
Chapt er 1. General Introduction
Chapt er 3.
In an interative planning context, how frequently should regional priorities be updated as local actions are implemented protractedly across a region?
T R A N S IT IO N
Chapt er 4.
What are the relative strengths and weaknesses of conservation plans developed at different scales to consider multiple social and ecological scales?
Chapt er 5.
Does multiscale planning occur in practice; if so, to what extent, through what mechanisms and what factors impede or facilitate this?
Chapt er 6. General Discussion Object ive 2.
In Chapter 1 (this introductory chapter), I establish the background and context for my research. Using the different stages in the conservation planning framework that involve scale-explicit decisions as thematic groups (i.e., technical and practical concerns, and transitioning between these), I identify broad research objectives that pertain to scale within each of these groups and specific related knowledge gaps.
In Chapter 2 where I address Objective 1, I determine the extent to which technical aspects of setting spatial priorities for marine conservation influence how and where priorities are determined. I examine three prioritisation factors: (1) the size of planning units, (2) thematic resolution of reef-class maps, and (3) the spatial variability of socioeconomic cost data used, using the conservation prioritisation software, Marxan, and Fiji and Micronesia as case study regions. Further, I examine whether there are any interaction effects occurring between these three factors in influencing where spatial priorities are determined. Finally, I assess how these prioritisation factors influence the extent to which coarse-resolution priorities are able to incidentally represent fine-resolution priorities. The results from this chapter have important implications for conservation planning strategies that rely on broad-scale, regional conservation assessments to guide subsequent assessments at smaller extents and finer-resolutions.
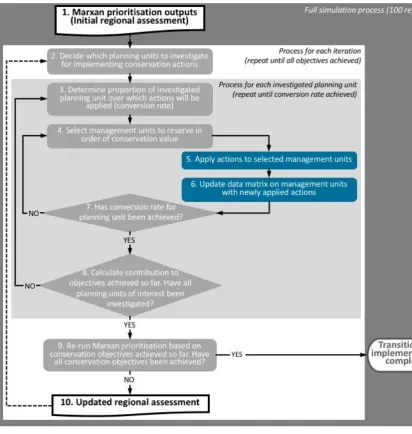
Chapter 3 addresses Objective 2 andis situated in the context of transitioning from conservation assessments formulated at broad extents to implementing conservation actions at local levels. Within this broader context of iterative planning, I specifically investigate how frequently regional priorities should be updated as local actions are implemented protractedly across the region, using Fiji as a case study. To do this, I use the programming language, R, and
prioritisation software, Marxan, to simulate the process of iterative planning for the first time in the field of conservation planning. For these simulations, I designed specific parameters and rule sets to reflect the relevant decision-making steps that would be involved in applying conservation actions at local levels. For example, only a certain proportion of a prioritised planning unit would have conservation actions applied within it, to reflect the real-world constraint of spatial mismatch between planning units and management units. Other important rule sets incorporated were to apply conservation actions on the basis of the relative importance of targeted
conservation features, and to ensure that applied actions in one planning iteration could not be spatially adjacent to each other. This last rule was included to emulate the common situation in which creating extensive contiguous reserves is not pragmatic and unlikely.
conservation plans developed at different scales (Chapter 4), and use this understanding to help inform the theory and practice of conservation planning across multiple scales (Chapter 5). In
Chapter 4, I identify the strengths and weaknesses of conservation plans developed at different jurisdictional levels in terms of adequately considering multiple social and ecological scales. To do this, I collate conservation plans developed at all levels (patch, local, regional, and
international) across the CT region and evaluate each plan using an explicitly multiscale social-ecological systems framework. In Chapter 5, I explore the scope of multiscale planning in practice using Papua New Guinea and the Solomon Islands as case study regions. I first establish the extent to which multiscale planning is occurring in practice in these regions. I then evaluate each identified case study to determine any factors that impede or facilitate multiscale planning.
Finally, Chapter 6 demonstrates in detail how each of my data-based chapters (Chapters 2-5) addresses the four research objectives of my thesis. In addition, I synthesise all my findings to demonstrate how my thesis contributes to filling the critical knowledge gaps related to problems of scale in the conservation planning process, highlighted in this chapter.
Chapter 2
2
Sympathy for the devil: detailing the effects of spatial prioritisation
factors on priorities for marine conservation
In Chapter 2, I examine the individual and interacting effects of three spatial prioritisation factors on priorities for marine conservation: (1) planning-unit size, (2) thematic resolution of reef classes, and (3) spatial variability of socioeconomic costs. This chapter contributes to existing knowledge on the technical considerations of scale in conservation planning processes, outlined in Chapter 1: first, the significant influence of socioeconomic cost data on where conservation priorities are determined and its ability to interact with other data layers, and second, the implicit assumptions made when relying on coarse-resolution prioritisations to guide subsequent finer-resolution prioritisations. I conceptualised the research, curated and analysed the data, and wrote the chapter. Pressey and Weeks provided advice in conceptualising the research and assisted with analyses and structuring and editing the manuscript. Andréfouët provided the data and assisted with editing the manuscript. Moloney assisted with curating and processing the data and editing the manuscript.
As version of this chapter has been published as: Cheok, J., R. L. Pressey, R. Weeks, S.
Andréfouët, and J. Moloney. 2016. Sympathy for the devil: detailing the effects of planning-unit size, thematic resolution of reef classes, and socioeconomic costs on spatial priorities for marine conservation. PLoS ONE 11(11):e0164869.
SCALE-RELATED DECISIONS IN THE CONSERVATION PLANNING FRAMEWORK:
TECHNICAL CONCERNS (Stages 5 & 6):
Object ive 1.
Under st and t he ext ent t o w hich t echnical aspect s of set t ing spat ial pr ior it ies inf luence w her e pr ior it ies ar e det er mined, and how t his r elat es t o assumpt ions of homogeneit y and nest edness.
PRACTICAL CONCERNS (Stages 1, 9 & 10):
Object ive 3.
Det er mine if t her e is an opt imal scale at w hich t o plan t o addr ess mult iple social and ecological scales.
Object ive 4.
Invest igat e t he t heor y and pr act ice behind int egr at ing conser vat ion planning acr oss mult iple scales.
Chapt er 2.
How do technical aspects of determining spatial priorities influence their location, and how does this relate to the ability of coarse-resolution priorities to represent fine-resolution priorities?
Chapt er 1. General Introduction
Chapt er 3.
In an interative planning context, how frequently should regional priorities be updated as local actions are implemented protractedly across a region?
T R A N S IT IO N
Chapt er 4.
What are the relative strengths and weaknesses of conservation plans developed at different scales to consider multiple social and ecological scales?
Chapt er 5.
Does multiscale planning occur in practice; if so, to what extent, through what mechanisms and what factors impede or facilitate this?
Chapt er 6. General Discussion Object ive 2.
2
Sympathy for the devil: detailing the effects of spatial prioritisation
factors on priorities for marine conservation
2.1
Abstract
Spatial data characteristics have the potential to influence various aspects of prioritising bio- diversity areas for systematic conservation planning. There has been some exploration of the combined effects of size of planning units and level of classification of physical environments on the pattern and extent of priority areas. However, these data characteristics have yet to be explicitly investigated in terms of their interaction with different socioeconomic cost data during the spatial prioritisation process. I quantify the individual and interacting effects of three factors on spatial priorities for marine conservation, in typical marine planning exercises that use reef classification maps as a proxy for biodiversity: (1) planning-unit size, (2) thematic resolution of reef classes, and (3) spatial variability of socioeconomic costs. I assess these factors by creating 20 unique prioritisation scenarios involving combinations of different levels of each factor. Because output data from these scenarios are analogous to ecological data, I applied ecological statistics to determine spatial similarities between reserve designs. All three factors influenced
prioritisations to different extents, with cost variability having the largest influence, followed by planning-unit size and thematic resolution of reef classes. The effect of thematic resolution on spatial design depended on the variability of cost data used. In terms of incidental representation of conservation objectives derived from finer-resolution data, scenarios prioritised with uniform cost outperformed those prioritised with variable cost. Following my analyses, I make
recommendations to help maximise the spatial and cost efficiency and potential effectiveness of future marine conservation plans in similar planning scenarios. I recommend that planners: employ the smallest planning-unit size practical; invest in data at the highest possible resolution; and, when planning across regional extents with the intention of incidentally representing fine-resolution features, prioritise the whole region with uniform costs rather than using coarse-resolution data on variable costs.
2.2
Introduction
off-park interventions for conservation (Margules et al. 2002, Carwardine et al. 2008). Prioritising allows planners to quantitatively assess the importance of sites for conservation action, while also explicitly considering aspects of their socioeconomic context. Prioritisations are typically based on data on biodiversity and, more recently, socioeconomic costs, coupled with predefined quantitative objectives for environmental classes, species, or processes of interest (Rouget et al. 2006, Green et al. 2009). By ‘environmental classes’ I refer to spatial subdivisions of terrestrial, freshwater, or marine environments, based on physical, climatic, and/or biological variables, with the aim of deriving environmental surrogates (sensu Margules and Pressey 2000) for conservation planning. Once the planning region is subdivided into planning units and intersected with data on biodiversity and socioeconomic costs, conservation objectives are formulated and the accumulated information is analysed by decision-support tools that determine low- or least-cost conservation designs (Watson et al. 2011).
A number of studies, mostly terrestrial, have explored the influence of planning-unit size and thematic resolution of environmental classes on prioritisation (e.g., Pressey and Logan 1995, 1998, Rouget 2003, Payet et al. 2010; and see Richardson et al. 2006, Van Wynsberge et al. 2012, Hamel et al. 2013 for marine studies). While there is a growing body of evidence for the
influence of aspects of resolution on prioritisation outputs, studies so far have mainly focused on the individual effects of spatial resolution of data, thematic resolution of environmental classes, and size of planning units, with few examining the effects of combinations of these factors. Importantly, no studies have yet considered how socioeconomic cost data can also interact with all these other factors to influence the selection of prioritised areas. With our increasing
recognition of the importance of considering socioeconomic costs in prioritisations (Naidoo et al. 2006, Carwardine et al. 2008, Ban et al. 2009a, 2013), and the potential for conservation designs to guide conservation actions, it is necessary to investigate the potential interactions that can occur between planning-unit size, thematic resolution of environmental classes, and spatial variability of cost data.
fragmented areas (Pressey and Logan 1995, 1998, Rouget 2003, Payet et al. 2010). However, key gaps apparent from these studies are that the findings were not consistent (fine-resolution
priorities were represented to varying extents), and data were for terrestrial environments only. Moreover, neither of these studies considered the role of socioeconomic cost data, and how these could influence the nestedness of fine-resolution priorities within coarse ones.
With so many aspects of data interacting in the prioritisation process across multiple extents or resolutions, the devil is in the detail. Important details that remain to be explored are the potential interactions between three prioritisation factors: size of planning units, thematic resolution of environmental classes, and spatial variability in socioeconomic costs, and how these together influence prioritisation outputs, particularly in terms of the spatial configuration of priorities when different cost layers are used. These interactions likely have important
implications for identifying effective prioritisation strategies. Here, I investigate the interacting effects of these three factors on conservation prioritisations in marine planning contexts, where environmental classes are used commonly as proxies for biodiversity. Specifically, I use
geomorphological reef classes (hereafter, ‘reef classes’). I assess the relative effect of each of these factors and, for the first time to my knowledge, interactions occurring between all three factors, on: (1) the total extent and cost of reserve solutions, and (2) spatial configurations of priority areas. I also assess the ability of coarse prioritisations to adequately represent finer-resolution priorities, in terms of: (1) the spatial nestedness of priorities determined at different resolutions, and (2) the extent of incidental representation of reef classes at high thematic resolution by coarse-resolution priorities. Using case studies from marine environments provides insights to support the rapidly increasing number of marine protected areas in response to targets under the Convention on Biological Diversity (CBD; Edgar et al. 2014). In doing so, I help to understand the devil in the detail of marine conservation prioritisation.
2.3
Methods
2.3.1 Study regions
Two regions were used as case studies: Fiji and Micronesia (consisting of the Mariana Islands, Marshall Islands, Palau, Guam, and the Federated States of Micronesia; Figure 2.1). The
individual Micronesian nations were considered as one region for the purposes of my analyses to provide a large, regional extent. The total extent of the planning regions for Fiji and Micronesia were approximately 24,439 km2 and 32,168 km2, respectively. The focus of this study was on
action but the mismatch between regional-level planning and local-level implementation is large (Weeks et al. 2010b). This disparity between regional and local perspectives is primarily
Figure 2.1 Regional context and enlarged maps of the two study regions: (A) Micronesia and (B) Fiji. Buffers are shown around Micronesian nations to increase visibility of the numerous small coral islands and atolls.
A
B
A
B
M$I$C$R$O$N$E$S$I$A
S$O$U$T$H$$ E$A$S$T$
A$S$I$A M$E$L$A$N$E$S$I$A
MARIANA& ISLANDS
PALAU
FEDERATED&STATES&OF&MICRONESIA MARSHALL&
ISLANDS
VANUA& LEVU
VITI& LEVU
GUAM
Kilometres
Kilometres 0&&&&&&&&&&50&&&&&&100
Though my analyses are grounded in real data, they are demonstration exercises, not intended to inform real-world conservation action in these study regions. For this reason, I did not consider existing marine protected areas in Fiji or Micronesia. The benefits of using empirical rather than modelled data (in the case of the reef-class maps) are that the results from this study will be a more realistic representation of outcomes expected in real-world applications.
2.3.2 Study design
[image:44.595.110.489.339.550.2]I examined three prioritisation factors: planning-unit size (analysed at two levels), thematic resolution (five levels), and spatial variability of socioeconomic costs (two levels). A full factorial design (giving a total of 20 unique prioritisation scenarios; Figure 2.2) was employed to deter- mine the influence of each of these factors in combination with the others. I used a scenario coding system (Table 2.1) to facilitate interpretation of subsequent results.