I
NFLATION
E
XPECTATIONS AND
I
NFLATION
U
NCERTAINTY IN THE
E
UROZONE
:
E
VIDENCE FROM
S
URVEY
D
ATA
I
VO
J.
M.
A
RNOLD
J
AN
J.
G.
L
EMMEN
CES
IFO
W
ORKING
P
APER
N
O
.
1667
C
ATEGORY6:
M
ONETARYP
OLICY ANDI
NTERNATIONALF
INANCEF
EBRUARY2006
An electronic version of the paper may be downloaded
• from the SSRN website: www.SSRN.com
CESifo Working Paper No. 1667
I
NFLATION
E
XPECTATIONS AND
I
NFLATION
U
NCERTAINTY IN THE
E
UROZONE
:
E
VIDENCE FROM
S
URVEY
D
ATA
Abstract
This paper uses the European Commission’s Consumer Survey to assess whether inflation expectations have converged and whether inflation uncertainty has diminished following the introduction of the Euro in Europe. Consumers’ responses to the survey suggest that inflation expectations depend more on past national inflation rates than on the ECB’s anchor for price stability. The convergence in inflation expectations does not appear to be faster than the convergence in actual inflation rates. Regarding inflation uncertainty, the data indicate a relationship with country size, suggesting that within EMU, inflation uncertainty may increase in countries that have a smaller influence on ECB policy.
JEL Code: D84, E31, E58.
Keywords: monetary union, inflation differentials, consumer survey.
Ivo J. M. Arnold University Nyenrode Straatweg 25 3621 BG Breukelen The Netherlands [email protected] Jan J. G. Lemmen
CPB Netherlands Bureau for Economic Policy Analysis
Van Stolkweg 14 2585 JR The Hague
The Netherlands [email protected]
Third version, December 2005
This paper was presented at the 3rd INFINITI Conference at Trinity College Dublin on June 24, 2005. We gratefully acknowledge the comments by the discussant Philip Lane and by other participants. We also thank Brian Lucey and two anonymous referees. All remaining errors are our own. We thank the European Commission DG ECFIN (Cédric Viguié) for providing the Consumer Survey data. The results in this paper do not reflect the views of the European Commission.
1. Introduction
Why should the European Central Bank (ECB) care about regional differences in inflation rates across the Eurozone? In general, the ECB focuses on average economic conditions in the Eurozone and attempts to ignore national idiosyncrasies as much as possible. This focus seems to fall within the parameters of its mandate to maintain price stability in the Eurozone as a whole. It is also in line with the absence of instruments to fine-tune monetary policy to cyclical circumstances in individual EMU countries. However, in a recent paper the ECB (2003) acknowledges that its monetary policy must consider the size, persistence and determinants of differences in inflation rates.1 The ECB is targeting a European-wide consumer price index, yet nobody in the
monetary union consumes according to this price index. The recent inflation experience in the Eurozone underpins the ECB’s concern. After the introduction of the Euro, the cross-country variation in the inflation rates of Member States has not fallen quickly. In the run-up to EMU all countries with the exception of Greece fulfilled the inflation criterion of the Maastricht Treaty. However, in each year since 1999, three or more countries have failed to fulfil the Maastricht criterion.
In an integrated market such as the Euro Area, inflation differentials across countries arise as an integral part of catching up and adjustment mechanisms to shocks. Policymakers’ main concern is that inflation differentials are more than just temporary deviations from the Eurozone average. Consequently, in EMU monetary policy has real effects because monetary policy affects the real interest rate which in
1
The ECB (2003, p. 6) writes “[...] the ECB’s monetary policy strategy attributes a secondary role to inflation differentials when calibrating the safety margin for admissible inflation in the Euro Area”.
turn affects aggregate spending decisions. With a uniform nominal interest rate, the domestic real interest rates will be lower in high inflation regions, discouraging savings and stimulating consumption and investment. In comparison to a monetary policy that is conducted nationally via a Taylor-type interest rate rule, within a monetary union the real interest rate channel no longer acts as a brake on the cycle but instead may accelerate regional economic developments. This effect may be further amplified by wealth effects, as low real interest rates may inflate share and real estate prices. The sole remaining countervailing force is the appreciation of the real exchange rate. However, the elimination of nominal exchange rates within the union reduces the speed with which this variable adjusts. Adjustment mechanisms of real appreciation or depreciation likely operate only at a slow pace.
Empirical evidence on the size and persistence of inflation differentials is provided by Cecchetti, Mark and Sonora (2002) for US cities, by Rogers (2001), Berk and Swank (2002) and Ortega (2003) for European countries and by Alberola and Marqués (1999) for Spanish provinces. Overviews are provided by Angeloni and Ehrmann (2004) and Gadzinski and Orlandi (2004). Most empirical studies conclude that relative price levels between regions converge at a surprisingly slow rate; in case of US cities the half-life of convergence is approximately nine years. Persistent inflation differences may influence inflationary expectations and can amplify regional business cycles. The vulnerability of the adjustment mechanism to self-reinforcing effects within a monetary union is discussed in Honohan and Lane (2003), Arnold and Kool (2004), Deroose, Langedijk and Roeger (2004) and Hofmann and Remsperger (2005).
The literature on cross-country inflation dispersion in the Eurozone and their effects on macroeconomic adjustment has focused on actual inflation rates. This has evoked strong criticism from among others the ECB (2004). According to the ECB (2004), the use of actual instead of expected inflation rates will exaggerate cross-country differences. The ECB argues that economic agents should be able to foresee the consequences of regional inflation differentials for a region’s competitive position and understand the implications of the ECB’s price stability objective. Economic agents should therefore conclude that, in the medium to long run, inflation divergences cannot last. In theory, they will adjust their inflation expectations accordingly. For macroeconomic adjustment the relevant interest rates are the ex ante real rates, not the ex post real rates. Using Consensus inflation forecasts, the ECB (2004) shows that the dispersion in ex ante real rates is lower than the dispersion in ex post real rates. Table 1 reproduces the main ECB findings. The dispersion of ex ante rates is 30-35% lower for short-term rates and almost 60% lower for long-term rates.
Table 1: Dispersion in real interest rates
Short-term real interest rates Long-term real interest rates Standard deviation, 1/1999-7/2004 Ex ante (using 1-year ahead Consensus inflation forecasts) Ex post (using current annual HICP inflation rates) Ex ante (using 6 to 10 years ahead Consensus inflation forecasts) Ex post (using current annual HICP inflation rates) unweighted 0.53 0.80 0.26 0.62 weighted 0.45 0.70 0.23 0.57 Source: ECB (2004), p. 34.
This paper adds the following contributions to the debate. Using data from the European Commission’s Consumer Survey we attempt to corroborate the ECB findings that cross-country differences in expected inflation rates (used to calculate ex ante real rates) are smaller than cross-country differences in actual inflation rates
(used to calculate ex post real rates). An advantage of the use of the Consumer Survey is that it provides a direct measure of consumers’ inflation expectations. A limitation is that it confines the analysis to short-term (one-year ahead) inflation expectations. Nevertheless, this allows a comparison with the short-term Consensus inflation forecasts in Table 1. In contrast to the Consensus Forecasts that summarize the views of a limited number of professional economists, the Consumer Survey is based on a large-scale survey among consumers. We hypothesize that professional economists may be better placed to deduct the theoretical implications of monetary union for the convergence in inflation rates than ordinary consumers. The Consensus data might therefore demonstrate more convergence in inflationary expectations than actually exists among the public (according to the Consumer Survey data). A low convergence of inflation expectations among the public might subsequently reinforce inflation persistence through its effect on the wage- and price-setting process. After deriving quantitative estimates of expected inflation from the qualitative survey data using the so-called probability approach, we estimate a model to test for beta-convergence in consumers’ inflation expectations. In addition to our analysis of inflation expectations, we document and analyze the development in inflation uncertainty in EMU Member States before and after the introduction of the Euro.
The outline of this paper is as follows. In Section 2, we discuss the Consumer Survey data and the methodology used to extract quantitative inflation expectations from these data. Section 3 reports the empirical findings. Using the Consumer Survey data, we are unable to detect a significantly stronger convergence in inflation expectations than the convergence in actual inflation rates. Drawing from the empirical findings there thus seems to be no substantial evidence that consumers use EMU to anchor
their inflation expectations to the price stability objective of the ECB. Instead, the formation of inflation expectations seems to depend mainly on past national inflation rates. We also confirm the generally accepted link between the inflation rate and inflation uncertainty. Moreover, since 1999 an interesting new link has arisen between country size and inflation uncertainty. Section 4 summarizes and concludes our findings on inflation expectations and inflation uncertainty.
2. Data and methodology
Our data on inflation expectations consists of the European Commission’s Consumer Survey. The Consumer Survey asks approximately 50,000 people in the Eurozone about their expectations regarding developments in the consumer price level over the following year. The data are collected monthly. The survey is conducted nationally. Each country’s sample consists of at least 1500 consumers. For the larger countries (France, Italy, Spain and the United Kingdom) the sample size was increased to 2000, and for Germany to 2500. The results from these surveys are available since 1985 except for Luxemburg and for member countries which entered the European Union later (Spain, Portugal, Austria, Finland). Across all countries, consumers are asked the following identical question on future price developments (Question 6): “By comparison with the past 12 months, how do you expect consumer prices will develop in the next 12 months? They will …
1.…increase more rapidly, 2.…increase at the same rate, 3.…increase at a slower rate, 4.…stay about the same,
5.…fall,
6….don’t know.”
In principle, the survey responses provide only qualitative information on the expected direction of the change in inflation in the next 12 months. Usually the responses are summarized in the form of a “balance statistic”, computed as a difference among the proportion of consumers opting for the different response categories. For Question (6), the balance is calculated as follows:
1 1 1 2 4 5 2 2 ( ) ( t t t t t ), Balance = S + S − S +S (1)
where Si refers to the sample proportion for the corresponding response category.
A sizable amount of literature has developed on the extraction of quantitative estimates of expected inflation from qualitative survey data using the so-called probability approach. Early contributions are by Carlson and Parkin (1975) and Batchelor and Orr (1988). More recent contributions are by Reckwerth (1997), Berk (1999, 2000), Gerberding (2001), Forsells and Kenny (2004) and Paloviita (2004). The main idea is to interpret the share of responses to each category as estimates of areas under the density function of aggregate inflation expectations (i.e. as probabilities). This approach requires the specification of the distribution function.
Following Gerberding (2001), we use the logistic distribution.2 The solutions for the
mean expected inflation (πte+12) and its standard deviation (σte+12) are in equations (2) and (3), see also Forsells and Kenny (2002):
3 4 12 1 2 3 4 ( ) e p t t t t t t t t Z Z Z Z Z Z π + = −π ⎡⎢ + ⎤⎥ + − − ⎣ ⎦ (2) 12 1 2 3 4 2 , e p t t t t t t Z Z Z Z σ+ =π ⎡⎢ ⎤⎥ + − − ⎣ ⎦ (3)
where theZti’s are defined as follows:
1 1 1 2 1 1 2 3 1 1 2 3 4 1 5 [1 ], [1 ], [1 ], [ ], t t t t t t t t t t Z N S Z N S S t Z N S S S Z N S − − − − = − = − − = − − − = (4)
and where the ’s are again the sample proportions for the corresponding response category and N
i t
S
-1
is the inverse of the cumulative logistic distribution function.
As the wording of the survey question indicates, the consumers are assumed to condition their inflation expectations on their perceptions of past inflation. This is also reflected in the formulas (3) and (4), which include past inflation (πtp). This paper follows Gerberding (2001) in using the actual growth rate in the national consumer
2
Because of the Central Limit Theorem, the aggregate density function is usually assumed to follow a normal or logistic distribution. According to Gerberding (2001), both alternatives lead to very similar results.
price index over the past twelve months, as monthly inflation data are published on a timely basis in all Eurozone countries.
3. Empirical findings
This section reports our empirical findings. In subsection 3.1 we examine the convergence in expected inflation in the Eurozone and its consequences for ex ante real interest rates. Subsection 3.2 provides evidence of inflation uncertainty within members of the Eurozone and its relationship with inflation and country size.
3.1 Convergence in inflation expectations
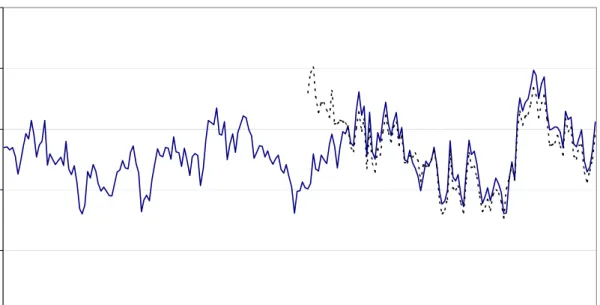
Prior to reviewing the constructed quantitative estimates of inflationary expectations, Figure 1 shows some evidence on cross-country differences using the raw qualitative survey data. The graph plots the cross-sectional dispersion of the balance of the responses to Question 6 of the Consumer Survey (see equation (1) in Section 2). The dispersion is measured as the standard deviation across 9 (11 from 1995) EMU Member States. Two striking features emerge from Figure 1. First, our balance measure shows minimal sign of convergence. Second, since the introduction of the Euro the cross-sectional standard deviation in the balance of responses has even reached an all-time high in 2003.
The balance data by themselves, however, do not provide sufficient evidence of lack of convergence. It is possible that countries with low past inflation rates have high balance scores (indicating a higher expected inflation) and conversely, resulting in a
convergence of inflation expectations, although the data would still show a high level of dispersion across the balance scores. We therefore need to look at the quantitative estimates of expected inflation derived using the methodology outlined in the previous section.
Figure 1: Cross-section standard deviations on balance of Question 6, Consumer Survey
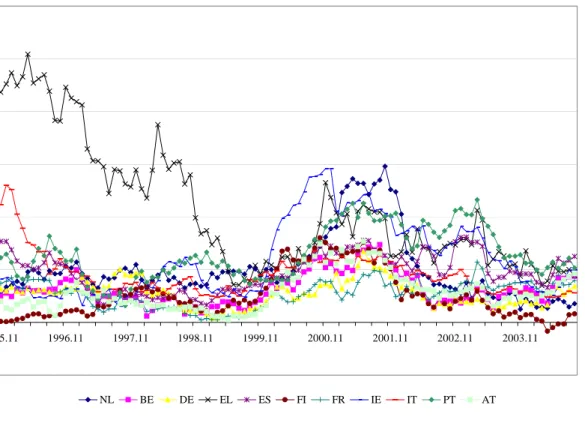
igure 2 plots time series for expected inflation over the period 1995-2004. It becomes evident that, apart from Greece, inflation expectations in the pre-EMU period (1995-1999) were much closer across EMU countries than after the introduction of the Euro. Since 1999 the smaller EMU countries (Ireland, Netherlands and Portugal) have taken turns to have the highest inflation expectations. We will further review the relationship with country size in Section 3.2. Figure 2 shows that before 1999, Greek expected inflation converges from a much higher level to the European level than expected inflation in other European countries. In order to assess the effects of this extreme pattern in Greek expected inflation, we will report results both including and excluding Greek data in the empirical analysis below. Apart from
0 5 10 15 20 25 1986 .06 1987 .06 1988 .06 1989 .06 1990 .06 1991 .06 1992 .06 1993 .06 1994 .06 199 5.06 1996 .06 1997 .06 1998 .06 1999 .06 2000 .06 2001 .06 2002 .06 2003 .06 2004 .06
Standard deviation Balance, 9 EU members Standard deviation Balance, 11 EU members
having a more recent experience of high (expected) inflation, Greece also joined EMU at a later stage (in 2001) than the other European countries. In our view, this different path towards EMU warrants reporting our results both including and excluding Greece.
Figure 2: 12-month forward-looking inflation expectations, derived from Question 6, Consumer Survey. -2 0 2 4 6 8 10 12 1995.11 1996.11 1997.11 1998.11 1999.11 2000.11 2001.11 2002.11 2003.11 NL BE DE EL ES FI FR IE IT PT AT
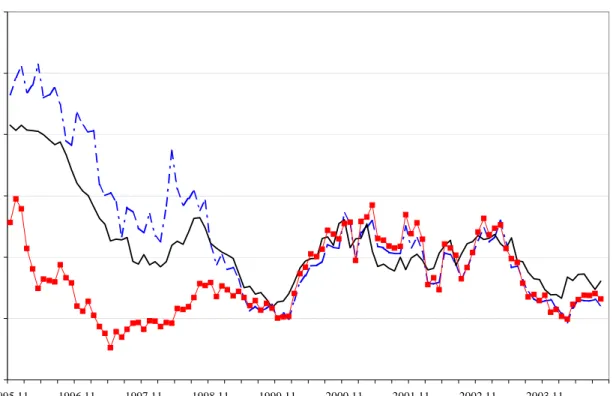
Figure 3 shows the cross-sectional dispersion of the time-series in Figure 2, and compares it with the dispersion in actual inflation rates. As Greece is the odd one out in the pre-EMU period, Figure 3 also plots the dispersion in expected inflation excluding the Greek inflation expectations. Two observations stand out from this graph. First, the dispersion in inflation expectations and actual inflation rates is very similar. In the start of the sample period, the expectations had a higher dispersion than the actual rates; from 1998 to 2003 the two series are very close and only very recently has expectational dispersion dropped below actual dispersion. Second, we
may conclude that there has not been a quick convergence in inflation expectations since 1999. Inflation expectations seem to reflect past national inflation rates more than the nominal anchor provided by the ECB’s objective to hold inflation below, but close to 2%. Third, the Greek outlier also matters for the dispersion of inflation expectations. When we exclude Greece from the sample as from 2001, we see that after the start of EMU expectational dispersion has been higher than in the run-up to EMU.
Figure 3: Cross-sectional standard deviations, 12-month forward-looking inflation expectations, derived from Question 6, Consumer Survey and actual inflation
To analyze the progress towards convergence of inflation expectations, we need indicators that can summarize the convergence over time of financial variables. We use the concept of beta-convergence borrowed from the growth literature and applied to the convergence of Eurozone interest rates by Adam et al. (2002) and Baele et al. (2004) to estimate the speed of convergence. Typical convergence studies in the
0.0 0.5 1.0 1.5 2.0 2.5 3.0 1995.11 1996.11 1997.11 1998.11 1999.11 2000.11 2001.11 2002.11 2003.11 Standard deviation expected inflation Standard deviation inflation Standard deviation expected inflation excl. EL
growth literature regress the average growth rate of real per capita GDP on its initial level for a cross-section of (regions within) countries and interprete a negative beta as sign of convergence (Barro and Sala-I-Martin, 1995, Chapters 11 & 12). Applied to inflation expectations, this involves running a panel regression of the following type:
, 1, , 1 , L t i i t i t l i t i l Eπ α β πE − Eπ − ε, = ∆ = + +
∑
∆ + (5)where Eπt,i denotes expected inflation at time t in country i and ∆ is the first
difference operator and αi is a country dummy. The more negative beta in (5), the
faster the convergence of the country will be towards the other European countries. So the concept of beta-convergence investigates how the dispersion of a cross-section of countries develops in terms of levels. A different concept of convergence investigates how the cross-sectional dispersion develops in terms of standard deviations or variances. When this dispersion decreases over time, we say there is sigma-convergence. The concept of beta-convergence is more appropriate for our purpose than the concept of sigma-convergence since the ECB aims at keeping the level of inflation for the Euro Area as a wholebelow, but close to 2% in the medium term.
Table 2 reports econometric evidence on the speed of the convergence of inflation expectations. The specification in Table 2 deviates in four respects from (5). First, the lagged changes in expected inflation were insignificant and therefore have been eliminated from the regression. Second, our regression includes the lagged log of OECD comparative price levels (log(cplt-1,i)). This variable is included to account for
possibly catching-up effects: inflation expectations may be higher in those countries where the price level is still low compared with other Eurozone countries (and vice
versa). Third, our regressions include not only cross-sectional fixed effects but also period fixed effects. The use of period fixed effects has the same effect as taking all variables in deviation from the cross-sectional average. The interpretation of (5) is then as follows: a negative beta implies that members with above-average inflation expectations will witness an stronger-than-average reduction or smaller-than-average increase in inflation expectations in the next period. Finally, we use a dummy variable (DEMU) to identify the EMU period and apply this to the beta-coefficient. The
resulting interaction term allows us to assess whether the convergence of inflation expectations has changed since the start of EMU.
The regression model is estimated for three datasets: a long sample running from July 1986 to September 2004 but excluding Greece, Austria and Finland (the first country because of its extreme inflation history and late entry into EMU, the latter two because of data unavailability) and two shorter samples running from December 1995 to September 2004, one including and one excluding the Greek outlier. The panel regressions are estimated by OLS. Standard errors have been calculated using the White period methodology to account for serial correlation due to the use of overlapping monthly data for 12-month (expected) inflation.
The main findings are as follows. All regressions report significant convergence; the estimated beta-coefficient on lagged expected inflation is statistically significant in all three specifications. Our catching-up variable (log(cplt-1,i)) is always insignificant.
The most interesting finding in Table 2 is the value and significance of the EMU interaction term (Επτ−1,ι*DEMU). The coefficient on the interaction term is insignificant
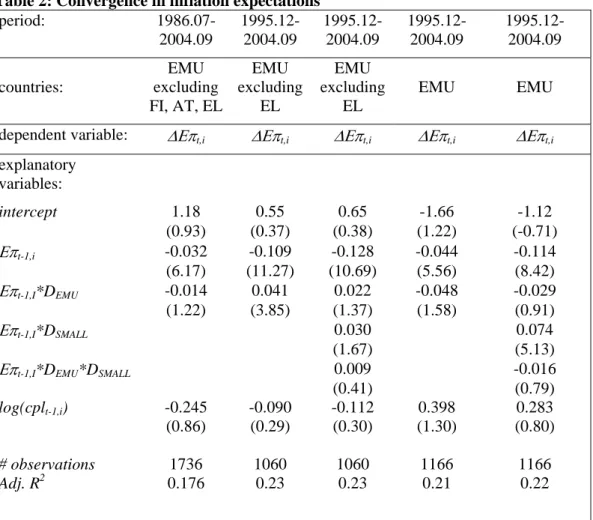
in both the long sample and in the short sample including Greece. It has, however, the anticipated negative sign, according to which EMU membership would lead to a stronger convergence. These results imply that EMU has not led to a significantly stronger convergence in inflation expectations. The regression for the shorter sample period excluding Greece (see the second column of Table 2) yields a positive and significant coefficient for the interaction term, implying that the convergence in inflation expectations has become weaker since the start of EMU. Given the strong convergence of Greek expected inflation to that of other countries before 1999, this result is unsurprising. The coefficient on lagged expected inflation is also much larger here compared with the other two specifications. These estimates correspond to the visual impression from Figures 2 and 3: strong convergence in expected inflation in the run-up towards EMU combined with a relaxation in the process of convergence after 1999. Whether we include Greece or not, we can reject the hypothesis that the EMU interaction term is negative at a 10% significance level. We therefore conclude that EMU has not led to faster convergence in inflation expectations.
To account for possible heterogeneity in beta convergence between large and small EMU countries, Table 2 also includes regressions results using a small country dummy variable (DSMALL). This dummy variable is set to zero for Germany, France,
Italy and Spain and to one for all other countries. Regressions with DSMALL are done
for the short samples including and excluding Greece. Without Greece, the coefficients on the interaction terms including DSMALL are insignificantly different
from zero at a 5% level. When we include Greece, the interaction term for DSMALL
becomes significantly positive, implying lower beta convergence among small countries. This finding illustrates the special nature of the Greek inflation
convergence during this period. We also checked for but didn’t find any asymmetries in beta convergence between countries with downwards and upwards inflation expectations. These results go unreported.
Table 2: Convergence in inflation expectations
period: 1986.07-2004.09 1995.12-2004.09 1995.12-2004.09 1995.12-2004.09 1995.12-2004.09 countries: EMU excluding FI, AT, EL EMU excluding EL EMU excluding EL EMU EMU
dependent variable: ∆Επt,i ∆Επt,i ∆Επt,i ∆Επt,i ∆Επt,i
explanatory variables: intercept 1.18 0.55 0.65 -1.66 -1.12 (0.93) (0.37) (0.38) (1.22) (-0.71) Επt-1,i -0.032 -0.109 -0.128 -0.044 -0.114 (6.17) (11.27) (10.69) (5.56) (8.42) Επt-1,I*DEMU -0.014 0.041 0.022 -0.048 -0.029 (1.22) (3.85) (1.37) (1.58) (0.91) Επt-1,I*DSMALL 0.030 0.074 (1.67) (5.13)
Επt-1,I*DEMU*DSMALL 0.009 -0.016
(0.41) (0.79)
log(cplt-1,i) -0.245 -0.090 -0.112 0.398 0.283
(0.86) (0.29) (0.30) (1.30) (0.80)
# observations 1736 1060 1060 1166 1166
Adj. R2 0.176 0.23 0.23 0.21 0.22
Panel estimates with cross-sectional fixed effects and period fixed effects; t-statistics in parentheses, calculated with White period standard errors.
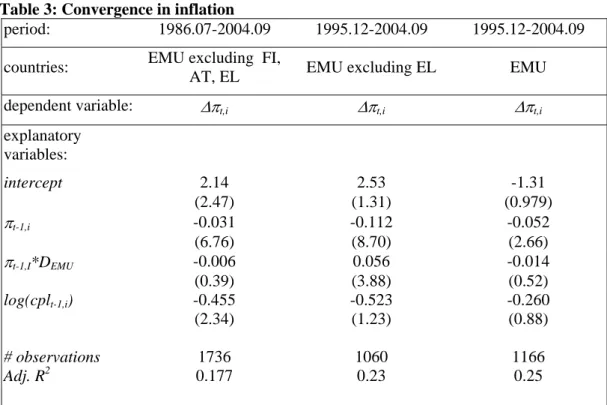
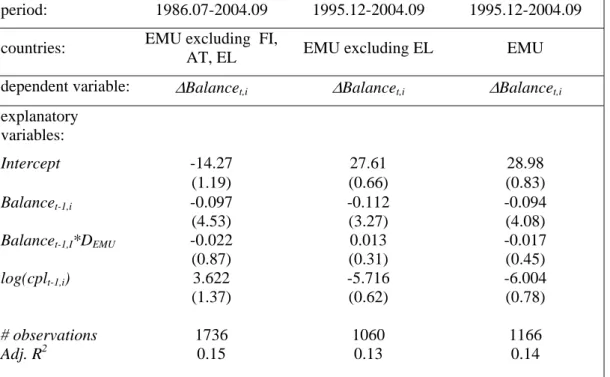
For the purpose of comparison, Table 3 reports similar estimates for actual inflation convergence. It shows that the patterns across the three samples are very similar compared with Table 2. The coefficients on lagged inflation are also close to those on lagged expected inflation. Thus, the regressions do not seem to support the notion of stronger convergence in inflation expectations as compared with actual inflation rates. In order to check the robustness of our results to the quantification of the survey data, we finally tested for convergence using the qualitative balance scores, see equation (1). Table 4 shows the beta coefficients to be negative and significantly different from
zero. This estimate of the beta coefficient implies that an above-average balance score in the previous period leads to a below-average increase in the balance score in the next period. The EMU-interaction term is, however, insignificant in all three specifications, implying that EMU has not led to stronger convergence in balance scores to the Eurozone average.
Table 3: Convergence in inflation
period: 1986.07-2004.09 1995.12-2004.09 1995.12-2004.09
countries: EMU excluding FI,
AT, EL EMU excluding EL EMU
dependent variable: ∆πt,i ∆πt,i ∆πt,i
explanatory variables: intercept 2.14 2.53 -1.31 (2.47) (1.31) (0.979) πt-1,i -0.031 -0.112 -0.052 (6.76) (8.70) (2.66) πt-1,I*DEMU -0.006 0.056 -0.014 (0.39) (3.88) (0.52) log(cplt-1,i) -0.455 -0.523 -0.260 (2.34) (1.23) (0.88) # observations 1736 1060 1166 Adj. R2 0.177 0.23 0.25
Panel estimates with cross-sectional fixed effects and period fixed effects; t-statistics in parentheses, calculated with White period standard errors.
We can now summarize the conclusions on convergence as follows. The data show that significant beta-convergence has occurred in inflation rates, balance scores and constructed inflation expectations. There is, however, no evidence that EMU has accelerated the process of convergence. If anything, the data suggest that after strong convergence in the run-up to EMU, convergence has become weaker since. The estimates also do not support the hypothesis that the convergence in inflation expectations is more pronounced that the convergence in actual inflation rates. These findings support the evidence in Figure 3, showing comparable dispersion in actual
and expected inflation rates. Applied to the distinction between ex ante and ex post real interest rates, we are unable to corroborate the ECB’s finding that, using Consensus data, the dispersion in ex ante real rates is much lower than the dispersion in ex post rates. In contrast, the Consumer Survey data suggest a similar dispersion of ex ante and ex post real interest rates. A likely explanation for this result is that consumers’ inflation expectations rather than professional economists’ inflation expectations depend more on past inflation.
Table 4: Convergence in balance scores
period: 1986.07-2004.09 1995.12-2004.09 1995.12-2004.09
countries: EMU excluding FI,
AT, EL EMU excluding EL EMU
dependent variable: ∆Balancet,i ∆Balancet,i ∆Balancet,i
explanatory variables: Intercept -14.27 27.61 28.98 (1.19) (0.66) (0.83) Balancet-1,i -0.097 -0.112 -0.094 (4.53) (3.27) (4.08)
Balancet-1,I*DEMU -0.022 0.013 -0.017
(0.87) (0.31) (0.45)
log(cplt-1,i) 3.622 -5.716 -6.004
(1.37) (0.62) (0.78)
# observations 1736 1060 1166
Adj. R2 0.15 0.13 0.14
Panel estimates with cross-sectional fixed effects and period fixed effects; t-statistics in parentheses, calculated with White period standard errors.
3.2 Inflation uncertainty
The probability approach explained above also allows for the estimation of the standard deviation of the distribution of inflation expectations, see equation (3). Below, this estimate will be used as our indication of inflation uncertainty. Before turning to the empirical findings, we first need, however, to clarify the concept of inflation uncertainty.
The empirical literature identifies two very different approaches in measuring inflation uncertainty or inflation volatility. The time-series approach utilizes (G)ARCH models to estimate the time-varying conditional volatility of inflation, see e.g. Engle (1982). Basically, this approach tries to econometrically identify clusters of large or small inflation shocks in order to estimate the variance of inflation in the next period. In contrast, the cross-sectional approach uses information on (dis)agreement about the inflation outlook among different forecasters at one point in time to assess inflation uncertainty. Our measure of inflation uncertainty belongs to the latter approach. In general, the two approaches do not yield comparable results, see e.g. Giordani and Söderlind (2003).
Apart from the distinction between the time-series and cross-sectional approaches, a further complication concerns the proper interpretation of inflation uncertainty in the Eurozone. In the Consumer Survey, the European Commission calculates aggregate replies to the questionnaires as weighted averages of the country-aggregate replies. It is not clear, however, whether the resulting Eurozone aggregate has a straightforward interpretation. It would assume that economic agents (consumers or investors) care about the inflation uncertainty regarding a European consumer price index, which is calculated as a weighted average of national price developments. If we maintain the more plausible assumption that economic agents consume locally, then the national consumer price indices may be better proxies for the price increase in their consumption basket. This perspective questions the relevance of analyzing inflation uncertainty at the Eurozone level using a aggregate consumer price index for the Eurozone. If investors and consumers still consume a local basket of goods, which is
presumably better represented by the national consumer price index than by a European one, inflation uncertainty is still a national experience.
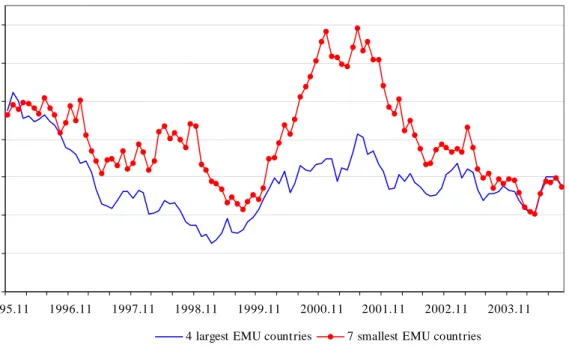
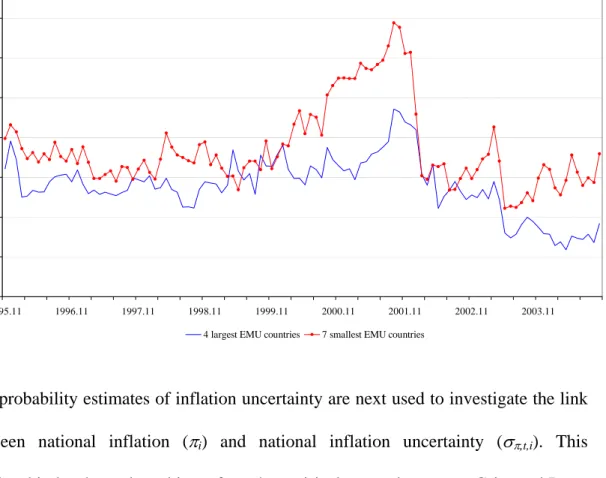
It therefore makes sense to look at the cross-sectional estimates of national inflation uncertainty, based on the probability approach outlined in Section 2. In Figure 4, each time-series corresponds to the standard deviation of the national distribution of inflation expectations by survey consumers. The figure shows a remarkable increase in uncertainty for most countries in the period 2000-2002. Moreover, Figure 5, which plots the average standard deviations for a group of large (Germany, France, Spain and Italy) and a group of small EMU countries (all other countries) suggests that the small countries have born the brunt of this increase in inflation uncertainty.
Figure 4: Cross-sectional within-country inflation uncertainty based on constructed expected inflation rates
0.0 0.5 1.0 1.5 2.0 2.5 3.0 3.5 4.0 1995.11 1996.11 1997.11 1998.11 1999.11 2000.11 2001.11 2002.11 2003.11 NL BE DE EL ES FI FR IE IT PT AT
Figure 5: Cross-sectional within-country inflation uncertainty based on constructed expected inflation rates: large vs small EMU countries
0.0 0.2 0.4 0.6 0.8 1.0 1.2 1.4 1995.11 1996.11 1997.11 1998.11 1999.11 2000.11 2001.11 2002.11 2003.11 4 largest EMU countries 7 smallest EMU countries
Again, we check for the robustness of our results by using an uncertainty measure that does not depend on the quantitative estimates of expected inflation. In Figure 6, we plot the proportions of extreme responses (in categories 1 and 5) averaged for the groups of small and large EMU countries. A higher proportion of extreme responses implies that consumers expect more change in the development of prices, either upwards or downwards. Although this is more a measure of price instability rather than inflation uncertainty, it still offers some interesting insights.
Figure 6 shows that in the early days of EMU, consumers in small Member States were expecting much more change in the direction of price developments than consumers in the four largest Member States. Consumers in the larger countries were apparently more confident in the ability of the ECB to keep prices stable in their country than consumers in smaller countries. Given that ECB interest rate setting is based on aggregate Eurozone data, this result makes intuitive sense. Inflation shocks
in small EMU countries have a smaller effect on EMU inflation than those in large Member States because of their smaller weight in the aggregate data. As a result, the ECB interest rates will react more strongly in setting interest rates to stabilize inflation in large countries compared to small countries.
Figure 6: Proportion of extreme survey responses (categories 1 and 5): large vs small
EMU countries
The probability estimates of inflation uncertainty are next used to investigate the link between national inflation (πi) and national inflation uncertainty (σπ,t,i). This
relationship has been the subject of much empirical research, see e.g. Grier and Perry (1998). The macroeconomic policy game literature has provided much of the theoretical background on the link between inflation and inflation uncertainty. Cukierman and Meltzer (1986), for example, argue that more uncertainty about money growth and inflation provides monetary authorities with the opportunity to create unexpected inflation with the aim of stimulating economic growth, thereby increasing the average inflation rate. More appealing perhaps is Ball’s (1992) theory, which assumes a reverse causal relationship. When inflation is low, it will require
0.00 0.05 0.10 0.15 0.20 0.25 0.30 0.35 0.40 1995.11 1996.11 1997.11 1998.11 1999.11 2000.11 2001.11 2002.11 2003.11 4 largest EMU countries 7 smallest EMU countries
minimal costs to keep it low. This results in a low and stable inflation. In contrast, when inflation is high, uncertainty will grow about whether policymakers will adopt costly disinflationary policies and about their time and impact.
Monetary policymaking can no longer explain the link between inflation and inflation
able 5 shows that the relationship between inflation and inflation uncertainty is uncertainty within a monetary union. But maybe the lack of monetary policy can. For economic agents in small regions which are hit by positive inflation shocks, it will be uncertain how and when the increase in inflation will be reversed. This results from imperfect information on the macroeconomic adjustment mechanism combined with the absence of a central bank dedicated to stabilizing their regional inflation rate. This does not hold true for the larger regions in the union, who have a larger weight in aggregate inflation and may therefore count on the price stability objective of the union’s central bank.
T
maintained within the Eurozone. Using the same three sample periods as in subsection 3.1, Table 5 reports positive and significant regression coefficients for all three specifications. The interaction term (πi*DEMU) shows that EMU has had little
influence on this relationship, except for the sample including Greece. As the Greek data show high inflation and inflation uncertainty in the pre-EMU period, it is unsurprising that including Greece leads to a weakening of the link, as Greek inflation had to come down significantly after 1999 to qualify for EMU entry in 2001. Table 6 reports again the results of our robustness check. Using the proportions of extreme responses as a measure of price instability, two out of three regressions show a
significant and positive link between inflation and the proportion of extreme responses.
Table 5: The relationship between inflation and inflation uncertainty
period: 1986.07-2004.09 1995.12-2004.09 1995.12-2004.09
countries: EMU excluding FI, EMU excluding EL
AT, EL EMU
dependent variable: σπ,t,i σπ,t,i σπ,t,i
explanatory variables: Intercept 0.058 0.016 -0.022 (1.86) (0.41) (0.76) πi 0.253 0.308 0.403 (26.21) (7.44) (13.59) πi*DEMU 0.005 -0.036 -0.127 (0.36) (0.94) (3.72)
# observations 1736 1060 1166
Adj. R2 0.93 0.87 0.92
Panel estimates with cross-sectional fixed effects and period fix d effec tatistics in calculated with White period standard errors.
survey responses
1986.07-2004.09 1995.12-2004.09 1995.12-2004.09
e ts; t-s
parentheses,
Table 6: The relationship between inflation and extreme
period:
countries: EMU excluding FI, EMU excluding EL
AT, EL EMU
Dependent variable:
Ex π,t,i
Extremes π,t,i Extremes π,t,i tremes
explanatory variables: Intercept 0.138 0.131 0.138 (15.22) (17.94) (17.14) πi 0.008 0.008 0.023 (2.38) (1.25) (4.69) πi*DEMU 0.006 0.004 -0.104 (1.02) (0.48) (1.65) # observations 1736 1060 1166 Adj. R2 0.61 0.56 0.66
Panel estimates with cross- nal fixed effect iod f xed eff -statistics theses, calculated with White period standard errors
sectio s and per i ects; t
We additionally provide some more evidence on the link between country size and inflation uncertainty, supporting the evidence in Figures 5 and 6. As explained above, it is straightforward to deduct this link within a monetary union. Before EMU, national central banks could still use the interest rate instrument to manage national inflation expectations and national inflation uncertainty. Since EMU, this management is no longer possible. Table 7 shows the absence of a relationship between country size and national inflation uncertainty, measured by both the mean and standard deviation of σπ,t,i, before EMU. In contrast, for the EMU sample period
the rank correlations are much higher and more significant.
Table 7: Country size and inflation uncertainty
1995:12-1998:12 1999:01-2004:08
Size Mean σπ,t,i Stdev σπ,t,i Mean σπ,t,i Stdev σπ,t,i
AT 3% 0.55 0.23 0.58 0.29 BE 4% 0.41 0.14 0.58 0.27 DE 34% 0.36 0.11 0.34 0.13 EL 2% 2.69 0.56 1.11 0.32 ES 9% 0.55 0.22 0.62 0.14 FI 2% 0.35 0.17 0.57 0.41 FR 21% 0.43 0.19 0.46 0.17 IE 1% 0.49 0.17 0.99 0.45 IT 16% 1.12 0.46 0.79 0.17 NL 5% 0.69 0.10 0.96 0.43 PT 2% 0.54 0.25 0.75 0.22 Rank correlation 0.00 -0.18 -0.52 -0.77
with country size
t-statistic 0.00 0.54 1.81* 3.63**
*
and ** indicate significance at respectively 10% and 5% level.
3.3 Short-term versus long-term inflation expectations
The findings reported above show that short-term inflation expectations based on the Consumer Survey data lack the convergence which is present in the short-term inflation expectations of Consensus Forecasts used by the ECB. Whereas the
cross-sectional dispersion in ex ante real interest rates using the Consensus data is 30-35% lower than the dispersion using actual inflation rates (see Table 1), dispersion measured using the inflation expectations from the Consumer Survey roughly equals actual dispersion (see Figure 3). As hypothesized above, this suggests that the professional economists of the Consensus Forecasts are more inclined to incorporate the implications of monetary union for the convergence in inflation rates than ordinary consumers responding to the Consumer Survey. Given the limited nature of the Consumer Survey, it is impossible to test whether the same conclusion holds for longer time horizons.
4. Conclusions
This paper has used the European Commission’s Consumer Survey to examine 1) the dispersion in expected inflation rates across EMU Member States, 2) the convergence in expected inflation over time and 3) the developments in inflation uncertainty in EMU Member States. What can we conclude from the European Commission’s Consumer Survey? Should the common monetary policy in EMU take into account the situation in individual countries? We conclude that, although significant beta-convergence has occurred in inflation rates, balance scores and constructed inflation expectations, there is no evidence that EMU has speeded up the process of convergence in inflation expectations. In contrast, the data suggest that after strong convergence in the run-up to EMU, convergence in expected inflation has become weaker since. Also, the convergence in inflation expectations is not more pronounced that the convergence in actual inflation rates. This contradicts the ECB’s (2004)
findings that dispersion in ex ante real interest rates is lower than that in ex post real interest rates.
Finally, our analysis of inflation uncertainty demonstrates that the widely accepted link between the level of inflation and the extent of inflation uncertainty still holds within EMU. In addition, we show that since the introduction of the Euro a new relationship has arisen between inflation uncertainty and country size. The latter finding is of special interest to investors residing in small EMU Member States. While these investors have witnessed an increase in inflation uncertainty since EMU, their ability to hedge this risk has been reduced. For fixed income instruments denominated in Euro, the inflation risk which is priced in reflects the inflation risk of investors across the Eurozone, including investors in large EMU countries that have not witnessed a similar increase in inflation risk. Inflation uncertainty in small EMU countries seems higher than what is socially desirable. This suggests that there may be a demand for inflation-protected securities aimed specifically at investors in small EMU countries. Although index-linked bonds indexed to French and Eurozone inflation are available, similar instruments indexed to national inflation rates in many small EMU countries are still lacking.
References
Adam, K., Jappelli, T., Menichini, A., Padula, M. & Pagano, M. (2002) Analyse, Compare, and Apply Alternative Indicators and Monitoring Methodologies to Measure the Evolution of Capital Market Integration in the European Union, CSEF Department of Economics and Statistics, University of Salerno, January.
Alberola, E. & Marqués, J.M. (1999), On the relevance and nature of regional
inflation differentials: the case of Spain, Banco de España Working Paper No. 9913.
Angeloni, I. & Ehrmann, M. (2004), Euro Area inflation differentials, ECB Working Paper No. 388, September.
Arnold, I.J.M. & Kool, C. (2004), The role of inflation differentials in regional adjustment: evidence from the United States, Kredit und Kapital, 37 (1), 62-85.
Baele, L., Ferrando, A., Hördahl, P., Krylova, E. & Monnet, C. (2004), Measuring financial integration in the Euro Area, ECB Occasional Paper No. 14, April. Ball, L. (1992), Why does high inflation raise inflation uncertainty?, Journal of
Monetary Economics, 29 (3), 371-388.
Barro, R.J. & Sala-I-Martin, X. (1995), Economic Growth, Mc.Graw-Hill, New York. Batchelor, R.A. & Orr, A.B. (1988), Inflation expectations revisited, Economica, 55
(219), 317-331.
Berk, J.M. (1999), Measuring inflation expectations: a survey data approach, Applied Economics, 31 (11), 1467-1480.
Berk, J.M. (2000), Consumers’ inflation expectations and monetary policy in Europe, De Nederlandsche Bank MEB Series No. 55.
Berk, J.M. & Swank, J. (2002), Regional price adjustment in a monetary union: the case of EMU, De Nederlandsche Bank MEB Series No. 7.
Carlson, J.A. & Parkin, M. (1975), Inflation expectations, Economica, 42 (166), 123-138.
Cecchetti, S.G., Mark, N.C. & Sonora, R.J. (2002), Price index convergence among United States cities, International Economic Review, 43 (4), 1081-1099. Cukierman, A. & Meltzer, A. (1986), A theory of ambiguity, credibility and inflation
under discretion and asymmetric information, Econometrica, 54 (5), 1099-1128.
Deroose, S., Langedijk, S. & Roeger, W. (2004), Reviewing adjustment dynamics in EMU: from overheating to overcooling, European Commission Economic Papers No. 198, January.
Engle, R.F. (1982), Autoregressive conditional heteroscedasticity with estimates of the variance of United Kingdom inflation, Econometrica, 50 (4), 987-1008. European Central Bank (2003), Inflation differentials in the Euro Area: potential
causes and policy implications, September, Frankfurt am Main.
European Central Bank (2004), Box 3 Measuring real interest rates in the Euro Area countries, Monthly Bulletin, September, 32-35.
Forsells, M. & Kenny, G. (2004), Survey expectations, rationality and the dynamics of Euro Area inflation, Journal of Business Cycle Meaurement and Analysis, 1 (1), 13-41.
Gadzinski, G. & Orlandi, F. (2004), Inflation persistence in the European Union, the Euro Area and the United States, ECB Working Paper No. 414, November. Gerberding, C. (2001), The information content of survey data on expected price
developments for monetary policy, Economic Research Centre of the Deutsche Bundesbank Discussion Paper No. 9/01, April.
Giordani, P. & Soderlind, P. (2003), Inflation forecast uncertainty, European Economic Review, 47 (6), 1037-1059.
Grier, K.B. & Perry, M.J. (1998), On inflation and inflation uncertainty in the G7 countries, Journal of International Money and Finance, 17(4), 671-689.
Hofmann, B, & Remsperger, H. (2005), Inflation differentials among the Euro Area countries: potential causes and consequences, Deutsche Bundesbank, Paper presented at the joint American Economic Association - American Committee for Asian Economic Studies session The Theory of Optimum Currency Areas Revisited, ASSA Annual Meeting, Philadelphia, 8 January 2005.
Honohan, P. & Lane, P.R. (2003), Divergent inflation rates in EMU, Economic Policy, 18 (37), 357-394.
Ortega, E. (2003), Persistent inflation differentials in Europe, Banco de España Working Paper No. 0305.
Paloviita, M. (2004), Inflation dynamics in the Euro Area and the role of expectations: further results, Bank of Finland Discussion Paper No. 21.
Reckwerth, J. (1997), Inflation and output in Germany: the role of inflation expectations, Deutsche Bundesbank Discussion Paper No. 5/97.
Rogers, J.H. (2001), Price level convergence, relative prices, and inflation in Europe, Board of Governors of the Federal Reserve System International Finance Discussion No. 699, March.
CESifo Working Paper Series
(for full list see www.cesifo-group.de)___________________________________________________________________________ 1605 Kathleen M. Day and Stanley L. Winer, Policy-induced Internal Migration: An
Empirical Investigation of the Canadian Case, November 2005
1606 Paul De Grauwe and Cláudia Costa Storti, Is Monetary Policy in the Eurozone less Effective than in the US?, November 2005
1607 Per Engström and Bertil Holmlund, Worker Absenteeism in Search Equilibrium, November 2005
1608 Daniele Checchi and Cecilia García-Peñalosa, Labour Market Institutions and the Personal Distribution of Income in the OECD, November 2005
1609 Kai A. Konrad and Wolfgang Leininger, The Generalized Stackelberg Equilibrium of the All-Pay Auction with Complete Information, November 2005
1610 Monika Buetler and Federica Teppa, Should you Take a Lump-Sum or Annuitize? Results from Swiss Pension Funds, November 2005
1611 Alexander W. Cappelen, Astri D. Hole, Erik Ø. Sørensen and Bertil Tungodden, The Pluralism of Fairness Ideals: An Experimental Approach, December 2005
1612 Jack Mintz and Alfons J. Weichenrieder, Taxation and the Financial Structure of German Outbound FDI, December 2005
1613 Rosanne Altshuler and Harry Grubert, The Three Parties in the Race to the Bottom: Host Governments, Home Governments and Multinational Companies, December 2005 1614 Chi-Yung (Eric) Ng and John Whalley, Visas and Work Permits: Possible Global
Negotiating Initiatives, December 2005
1615 Jon H. Fiva, New Evidence on Fiscal Decentralization and the Size of Government, December 2005
1616 Andzelika Lorentowicz, Dalia Marin and Alexander Raubold, Is Human Capital Losing from Outsourcing? Evidence for Austria and Poland, December 2005
1617 Aleksander Berentsen, Gabriele Camera and Christopher Waller, Money, Credit and Banking, December 2005
1618 Egil Matsen, Tommy Sveen and Ragnar Torvik, Savers, Spenders and Fiscal Policy in a Small Open Economy, December 2005
1619 Laszlo Goerke and Markus Pannenberg, Severance Pay and the Shadow of the Law: Evidence for West Germany, December 2005
1620 Michael Hoel, Concerns for Equity and the Optimal Co-Payments for Publicly Provided Health Care, December 2005
1621 Edward Castronova, On the Research Value of Large Games: Natural Experiments in Norrath and Camelot, December 2005
1622 Annette Alstadsæter, Ann-Sofie Kolm and Birthe Larsen, Tax Effects, Search Unemployment, and the Choice of Educational Type, December 2005
1623 Vesa Kanniainen, Seppo Kari and Jouko Ylä-Liedenpohja, Nordic Dual Income Taxation of Entrepreneurs, December 2005
1624 Lars-Erik Borge and Linn Renée Naper, Efficiency Potential and Efficiency Variation in Norwegian Lower Secondary Schools, December 2005
1625 Sam Bucovetsky and Andreas Haufler, Tax Competition when Firms Choose their Organizational Form: Should Tax Loopholes for Multinationals be Closed?, December 2005
1626 Silke Uebelmesser, To go or not to go: Emigration from Germany, December 2005 1627 Geir Haakon Bjertnæs, Income Taxation, Tuition Subsidies, and Choice of Occupation:
Implications for Production Efficiency, December 2005
1628 Justina A. V. Fischer, Do Institutions of Direct Democracy Tame the Leviathan? Swiss Evidence on the Structure of Expenditure for Public Education, December 2005
1629 Torberg Falch and Bjarne Strøm, Wage Bargaining and Political Strength in the Public Sector, December 2005
1630 Hartmut Egger, Peter Egger, Josef Falkinger and Volker Grossmann, International Capital Market Integration, Educational Choice and Economic Growth, December 2005 1631 Alexander Haupt, The Evolution of Public Spending on Higher Education in a
Democracy, December 2005
1632 Alessandro Cigno, The Political Economy of Intergenerational Cooperation, December 2005
1633 Michiel Evers, Ruud A. de Mooij and Daniel J. van Vuuren, What Explains the Variation in Estimates of Labour Supply Elasticities?, December 2005
1634 Matthias Wrede, Health Values, Preference Inconsistency, and Insurance Demand, December 2005
1635 Hans Jarle Kind, Marko Koethenbuerger and Guttorm Schjelderup, Do Consumers Buy Less of a Taxed Good?, December 2005
1637 Alfons J. Weichenrieder and Oliver Busch, Artificial Time Inconsistency as a Remedy for the Race to the Bottom, December 2005
1638 Aleksander Berentsen and Christopher Waller, Optimal Stabilization Policy with Flexible Prices, December 2005
1639 Panu Poutvaara and Mikael Priks, Violent Groups and Police Tactics: Should Tear Gas Make Crime Preventers Cry?, December 2005
1640 Yin-Wong Cheung and Kon S. Lai, A Reappraisal of the Border Effect on Relative Price Volatility, January 2006
1641 Stefan Bach, Giacomo Corneo and Viktor Steiner, Top Incomes and Top Taxes in Germany, January 2006
1642 Johann K. Brunner and Susanne Pech, Optimum Taxation of Life Annuities, January 2006
1643 Naércio Aquino Menezes Filho, Marc-Andreas Muendler and Garey Ramey, The Structure of Worker Compensation in Brazil, with a Comparison to France and the United States, January 2006
1644 Konstantinos Angelopoulos, Apostolis Philippopoulos and Vanghelis Vassilatos, Rent-Seeking Competition from State Coffers: A Calibrated DSGE Model of the Euro Area, January 2006
1645 Burkhard Heer and Bernd Suessmuth, The Savings-Inflation Puzzle, January 2006 1646 J. Stephen Ferris, Soo-Bin Park and Stanley L. Winer, Political Competition and
Convergence to Fundamentals: With Application to the Political Business Cycle and the Size of Government, January 2006
1647 Yu-Fu Chen, Michael Funke and Kadri Männasoo, Extracting Leading Indicators of Bank Fragility from Market Prices – Estonia Focus, January 2006
1648 Panu Poutvaara, On Human Capital Formation with Exit Options: Comment and New Results, January 2006
1649 Anders Forslund, Nils Gottfries and Andreas Westermark, Real and Nominal Wage Adjustment in Open Economies, January 2006
1650 M. Hashem Pesaran, Davide Pettenuzzo and Allan G. Timmermann, Learning, Structural Instability and Present Value Calculations, January 2006
1651 Markku Lanne and Helmut Luetkepohl, Structural Vector Autoregressions with Nonnormal Residuals, January 2006
1652 Helge Berger, Jakob de Haan and Jan-Egbert Sturm, Does Money Matter in the ECB Strategy? New Evidence Based on ECB Communication, January 2006
1653 Axel Dreher and Friedrich Schneider, Corruption and the Shadow Economy: An Empirical Analysis, January 2006
1654 Stefan Brandauer and Florian Englmaier, A Model of Strategic Delegation in Contests between Groups, January 2006
1655 Jan Zápal and Ondřej Schneider, What are their Words Worth? Political Plans and Economic Pains of Fiscal Consolidations in New EU Member States, January 2006 1656 Thiess Buettner, Sebastian Hauptmeier and Robert Schwager, Efficient Revenue
Sharing and Upper Level Governments: Theory and Application to Germany, January 2006
1657 Daniel Haile, Abdolkarim Sadrieh and Harrie A. A. Verbon, Cross-Racial Envy and Underinvestment in South Africa, February 2006
1658 Frode Meland and Odd Rune Straume, Outsourcing in Contests, February 2006
1659 M. Hashem Pesaran and Ron Smith, Macroeconometric Modelling with a Global Perspective, February 2006
1660 Alexander F. Wagner and Friedrich Schneider, Satisfaction with Democracy and the Environment in Western Europe – a Panel Analysis, February 2006
1661 Ben J. Heijdra and Jenny E. Ligthart, Fiscal Policy, Monopolistic Competition, and Finite Lives, February 2006
1662 Ludger Woessmann, Public-Private Partnership and Schooling Outcomes across Countries, February 2006
1663 Topi Miettinen and Panu Poutvaara, Political Parties and Network Formation, February 2006
1664 Alessandro Cigno and Annalisa Luporini, Optimal Policy Towards Families with Different Amounts of Social Capital, in the Presence of Asymmetric Information and Stochastic Fertility, February 2006
1665 Samuel Muehlemann and Stefan C. Wolter, Regional Effects on Employer Provided Training: Evidence from Apprenticeship Training in Switzerland, February 2006
1666 Laszlo Goerke, Bureaucratic Corruption and Profit Tax Evasion, February 2006
1667 Ivo J. M. Arnold and Jan J. G. Lemmen, Inflation Expectations and Inflation Uncertainty in the Eurozone: Evidence from Survey Data, February 2006