Electronic publications
Constructing experimental indicators for open
access documents
Philipp Mayr
The ongoing paradigm change in the scholarly publication system makes it necessary to con-struct alternative evaluation criteria/metrics which appropriately take into account the unique characteristics of electronic publications and other research output in digital formats. Today, major parts of scholarly open access (OA) publi-cations and the self-archiving area are not well covered in traditional citation and indexing da-tabases. The growing share and importance of freely accessible research output demands new approaches/metrics for measuring and evaluat-ing these new types of scientific publication. We propose a simple quantitative method which es-tablishes indicators by measuring the ac-cess/download pattern of OA documents and other web entities of a single web server. The ex-perimental indicators are constructed, based on standard local web usage data. This new type of web-based indicator is developed to model the specific demand for better study/evaluation of the accessibility, visibility and interlinking of open accessible documents. We conclude that e-science will need new stable e-indicators.
Philipp Mayr is a doctoral candidate at the Institute of Library and Information Science, Humboldt-University Berlin, Ger-many; Email: [email protected]; <http://www.ib.hu-berlin. de/~mayr>; Steubenring 17, 53175 Bonn, Germany
He would like to thank Jeof Spiro for helpful questions and proof-reading of the manuscript.
EB DATA-DRIVEN STUDIES are a rela-tively new, interdisciplinary and demand-ing research field in the information science sector. The impetus for this mostly empiri-cally oriented research comes from the rampant increase in users, documents and scholarly research output on the Web. In these studies there are two types of essential data: Web link data, well-explored by Mike Thelwall (Thelwall, 2004) and other researchers; and the relatively under-valued web usage data, which we have been studying.
Web log files (web usage data) record user trans-actions on web servers and other openly accessible document repositories and provide an excellent source for information behavior analysis due to their properties and amount of data (Nicholas et al, 2005a; 2005b). In addition to this well-known analy-sis path, usage data offer the possibility to draw con-clusions concerning accessibility and visibility including interlinking of various types of documents. Recent informetric studies demonstrate the potential to build indicators on this kind of data (Brody and Harnad, 2005; Bollen et al, 2005).
Our approach is also based on web usage data. This approach could be relevant for the field of re-search evaluation because in the electronic age of publishing science, policy-makers and reviewers, as well as others who use these results, need proper instruments. There is a need to construct new met-rics which are comparable or compatible to citation impact. Perhaps measuring usage impact or new metrics of user preference can be a supplement for citation impact.
Is it possible to identify the importance of an article earlier in the read-cite cycle, at the point
when authors are accessing the literature? Now that researchers access and read articles through the Web, every download of an article can be logged. The number of downloads of an article is an indicator of its usage impact, which can be measured much earlier in the reading-citing cycle. (Brody and Harnad, 2005)
As a first step, the paper introduces to the field of open access (OA) and webometrics, including web-based indicators. Second, we propose three experi-mental web indicators and briefly describe their construction. The paper ends with a discussion and a conclusion of the relevance and specific value of the proposed indicators for research evaluation.
Open access and web indicators
According to advocates of OA and recent political declarations (eg Berlin declaration, 2003), the share and impact of OA journals as well as the self-archiving area (Lawrence, 2001) will extensively increase in coming years. In fact, this OA sector is still underrepresented and not well covered by the major indexing services (eg McVeigh, 2004). The consequence is a lack of established instruments to measure or evaluate the OA published and archived research output. All stakeholders involved in the scientific process (scientists, peers, journal editors, librarians, etc) have indicated that robust web data-based measuring methods and indicators1 — for ex-ample, for determining the impact or quality of a document — are still lacking. There are presently no sustainable and simple standard indicators in sight. Only experimental approaches have been proposed (web link indicators included).
Open access repositories, such as CiteSeer, ArXiv and others, are especially suited for developing web-based indicators because they are defined by their scope and offer a certain degree of import control and content quality. The growing share and impor-tance of freely accessible research documents in scholarly communication demand robust web-based indicators now. Otherwise evaluation of these new publication types is not feasible.
The WISER project defines a web indicator as “a policy relevant measure that quantifies aspects of the creation, dissemination and application of science and technology in so far as they are represented on the internet or the World Wide Web” (see WISER project website, 2005).
Current web indicators are not without systematic problems. Webometric research can show, for ex-ample, that analyses based on commercial search engine results such as Google APIs have some limi-tations (Mayr and Tosques, 2005).2 Additionally, data from different search engines is not easily com-pared and interpreted (Bar-Ilan, 1998/9; 2005). Link analysis, intensively investigated by Mike Thelwall (Thelwall, 2004), including co-link analysis
(Katz, 2004), is one leading direction for future web indicators.
There is perhaps another direction for construct-ing reliable and comprehensive web-based indica-tors. The importance of web usage data is also becoming more accepted in the informetric commu-nity. Recent papers in a special issue on informetrics in Information Processing and Management (41(6), 2005) and a workshop at Humboldt University in Berlin3 show various new uses of this data — for example, alternative metrics of journal impact (Bol-len et al, 2005) or deep log analysis of digital jour-nals (Nicholas et al, 2005b). Modeling web usage data for evaluation purposes is quite new (Brody and Harnad, 2005; Kurtz et al, 2005; Bollen et al, 2005) and requires the appropriate environment (eg e-print archives such as <arxiv.org>). Preliminary results from this research show a positive correlation be-tween usage data and citation data.
The following section will deal with three ex-perimental indicators constructed from standard web usage log data.
Experimental usage indicators
Conventional analysis of usage data focuses on ag-gregates of use from a macro perspective. Their common performance figures of hit, view and visit are broadly accepted, but they give only a very crude and incomplete picture of the underlying access pat-tern, such as:
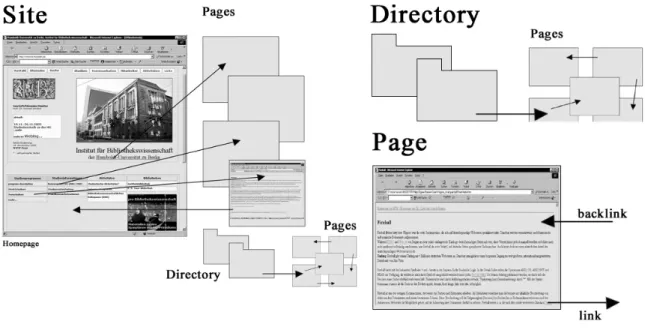
• How much traffic does an entity (site, directory, page) of a web space receive (see Figure 1)?
• Where are the most important entry pages?
• Where are the users coming from?
• How do users return?
The limitations and advantages of web usage data analysis has recently been reviewed by Jamali et al
(2005, see also Nicholas et al, 1999).
We can summarize that log files of web servers or OA repositories normally:
• are structured enough to reliable extract pattern and instances of usage;
• can be used for measuring web impact or usage impact (Brody and Harnad, 2005) of a certain entity;
• have the potential for fast indication of usage trends, including user interest and preference. Below we will propose a simple quantitative method that establishes indicators by measuring the access pattern of selected OA documents and other web entities of a web server (see Figure 1 for an illustra-tion of the distinguishable entities). The procedure was developed in 2004 and tested by an open acces-sible academic web site (Mayr, 2004a; 2004b). We will call this the Web Entry measure.
The main idea of the approach is to distinguish the access or entry pattern of a document or entity via a simple heuristic. The Web Entry measure uses a heuristic that distinguishes three access/download types: search engines, backlinks and direct access
for measuring the accessibility, interlinking and visibility ratios for certain documents. These access or entry types can be reliably identified in a log file (see also Thelwall, 2001; Mayr, 2004a; and Figure 2). The usage data in the extended log file format allows a separation of access requests into (see log file examples in Figure 2):
1. Backlink access: the usage of a hyperlink (back-link for the requested item) in another external paper or web document is documented in the us-age data with the complete URL of the referenc-ing document.
2. Search engine access: a search engine query — for example, the title or the author of a paper — leads directly to the paper in the repository and will be logged as an access via search engine. Search engine access can be tracked by typical search engine URLs in the referrer log file field. 3. Direct access: direct access can be established
through user’s bookmarks or other forms of di-rectly requesting a document. Direct access can be
tracked by the missing entry/URL (eg “-”) in the referrer log file field.
Figure 2 shows anonymous virtual users requesting different pages (bold). The users access the pages via the three proposed entry types (typical search engine, backlink and direct access pattern are marked).
The Web Entry measure proposed by the author can be implemented4 in the freely accessible envi-ronment of open access documents. The differentia-tion of the entry requests allows measuring of, for example, the intensity and broadness of external interlinking or visibility via search services. This has been successfully applied in a study analyzing the content of a large academic website in Germany (Mayr, 2004a, 2004b).
Furthermore, the Web Entry measure has the po-tential for building fast applicable indicators using these aggregates of usage, which may be a basis for various optimization or evaluation processes of a certain OA entity. Detailed usage impact and interest rates can be indicated shortly after electronic publi-cation by the following ratios:
• Web entity visibility or accessibility rates for dif-ferent navigation and document access pattern;
Figure 1. Different web entities (site, directory and page) in an open accessible web space
Figure 2. A log file sample showing the proposed access types search engine, backlink and direct access which can be differentiated by a heuristic
• Web entity interlinking rates give a global idea about the accessibility of an open accessible item by external linking/backlinking or electronic scholarly citing.
The three entry patterns (exemplified by Figure 2) can be extracted for entities — for example journals, journal volumes/issues or articles/abstracts, etc — identifiable in the usage data. The following simple pure web-based indicators can be automatically computed and used for further calculations (eg vali-dations).
1. Search engine Indicator Ise:
) l (D total Downloads ) (D access engine search by Downloads I tota se se=
2. Backlink Indicator Ibl:
) l (D total Downloads ) (D access backlink by Downloads I tota bl bl=
3. Direct access Indicator Ida:
) l (D total Downloads ) (D access direct by Downloads I tota da da=
The entity in Table 1, a single web page (article.htm in the folder irs), is downloaded 10,000 times in a certain period of time. The proposed analysis method subdivides these total downloads into 2,000 downloads via search engines (Ise = 0.2), 7,000
downloads via backlinks (Ibl = 0.7) and 1,000 downloads via direct access (Ida = 0.1). The single indicator values Ise, Ibl, Ida can vary between 0 and 1. Each indicator can be drilled down to a more de-tailed level (see two-step scenario below).
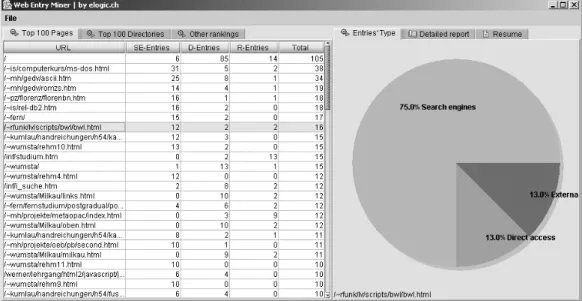
Figure 3 shows a prototypical visualization of us-age data via the proposed measure. The values of the selected page indicate a high search engine ratio (Ise of 0.75).
A next analysis step after the indicator computa-tion (Table 1 or Figure 3) could be the following two-step scenario:
• Step 1: First the usage data will be analyzed with the proposed method. As a result we have a de-tailed macro view which distinguishes and dis-plays the three usage aggregates — search engines, backlinks and direct access — for each entity in a repository represented by their indica-tor values Ise, Ibl, Ida.
• Step 2: In the second step, the data analyst wishes to study the precise composition of the indicator values for a favorite entity, for example by its search engine indicator Ise. In doing so, this starts a “drill down” to the data (the downloads via search engines Dse for the entity), which can dis-play the exact configuration of the search engine accesses/downloads recorded in the log file. For example, 75% of search engine downloads refer back to the selected page in Figure 3 and these en-tries probably go back to several search engines and various search terms. The drill-down analysis of the indicator can show all details, the search
Table 1. An example for segmented download ratios and derived indicators Ise, Ibl, Ida for an entity
Entity URL Dse (Ise) Dbl (Ibl) Dda (Ida) Dtotal
Page /irs/article.htm 2,000 (0.2) 7,000 (0.70) 1,000 (0.10) 10,000
engineswiththesinglesearchengineentryofthe websitereferenced.Inafurtherdrill-downstepthe searchtermsofanactualsearchengine,for exam-ple Google, will be shown. This is the point at whichtheadvancedmacroanalysiswouldendand a microanalysis couldbegin(seeamicro-mining methodology in Nicholas and Huntington, 2003). A drill-down scenario can also start with the back-link indicator Ibl. An analyst could be interested in theusedbacklinks/electroniccitationsofananalyzed document or entity. The distribution of backlinks can typically be viewed over time or by the intensity of the backlink use.
The following section will discuss the policy rele-vance and methodological difficulties of the pro-posed method. Furthermore we address the specific value and meaning of each indicator for evaluation of open accessible research documents.
Discussion
In accordance with the title of the paper, the pro-posed method to construct indicators for science and innovation systems out of usage data is highly ex-perimental. But this experimental status is not only a specific property of our indicators; rather the status quo of most web-based indicators in these days is far from robust, including indicators that are built on linking data. Tendencies to develop these ‘early’ approaches to larger prototyping projects5 can be observed. Usage data-based methods (including our approach) now have little policy relevance for evaluators, for several reasons.
First there are the availability and privacy issues of the data. Normally raw or filtered usage data files are not available for everybody who is interested in the usage of a webserver or document repository. In particular, the projects mentioned above (see note 5) show ideas/solutions to overcome this problem.
Second, the method described in this paper relies on the analysis of local log data, mostly from only one single webserver. Local log data is a limited data source in terms of measuring/evaluating science output and therefore has only a little relevance for evaluators. A federated approach that has its own specific obstacles is a very promising direction with higher impact for comprehensive science metrics. Evaluations of groups, institutes and so on would be better based on a federated approach. But we would like to underline that our idea (distinguishing download pattern by a specific heuristic) has the po-tential to draw a more detailed picture of the usage statistics by establishing fine-grained indicators. Possibly this can be an add-on for enhanced evalua-tion of total counts of downloads.
The third reason is the enormous amount of data and the problems in securing data quality/validity. Particularly the data quality and the validity of the constructed indicators should be mentioned here.
Usagedata,withitsabsoluteurgencyinfiltering, ex-tractingandvalidatingoftherawdata,couldbe rela-tivelyeasilybemanipulated,comparedtocitationor linkingdata.Logdataanalysistechniquesare conten-tious, vague andfulloftraps (seeegNicholasetal, 1999).Proxyservercaching,useridentificationissues and other complicated problems such as evaluating documents on distributed or mirrored systems by mergingand samplingusage dataareonlysome ex-amples of problems you have to cope with, if you wish to standardize such an evaluation method.
Let us summarize all these reasons by saying that metrics that are based on usage data need even better testing and inspection before using them for evalua-tion or other interpretaevalua-tions. Furthermore, this kind of metrics tends to be more successful in indicat-ing/monitoring research output for user purposes. Users can better decide which publications are pre-ferred by other users if download ratios are dis-played. In accepting this shift from author/citation-centered to user/download-author/citation-centered methodology, we also have a new and fast applicable basis for ranking and ordering search results or monitoring science trends with an increase in data vagueness.
The specific value and meaning of our approach lies in the detailed display of the total downloads of each single OA document or entities of items and the opportunity to dig deeper. The proposed indicators Ise, Ibl, Ida open a microscopic way to analyze aggre-gates/instances of usage. They offer, for example, the possibility of discovering hidden linking struc-tures and usage pattern of groups. Ise, the search en-gine indicator, is a first indication for a collection manager if any open accessible document is indexed and retrieved from outside of the repository. A more detailed analysis of Ise offers the possibility of learn-ing more about the accessibility of items (see the two-step scenario above). Ibl, the backlink indicator, is an immediate indication of impact of a document, because preference expressed by hyperlinks/‘e-citations’ and the usage of these links can be meas-ured. Furthermore, this indicator can show more than the absolute count of backlinks, but also the distribution of backlink usage over time. The Ibl is conceptually related to traditional citation-based in-dicators, because of the relatedness between citing and scholarly hyperlinking. It holds the greatest po-tential to build own/free forms of aggregation or
Distinguishing download pattern by a
specific heuristic has the potential to
draw a more detailed picture of the
usage statistics by establishing
fine-grained indicators
validation with traditional metrics for evaluation purposes. Ida, the direct access indicator, is a spe-cialty of our metric. It can indicate to what rate a document is downloaded directly.
Conclusions
As we can show, logging data and derived web-based indicators of open accessible scholarly web spaces is a very interesting source and also monitors real usage by real readers/users, in almost real time. Implementing widespread usage analysis and usage-based indicators in OA repositories demonstrates benefits such as fast indication of usage impact and user preference. Today we are at a level where we should consider supplementing or enhancing tradi-tional evaluation with new forms of web data. Web indicators based on usage data are a way to obtain unique information of the utility and scholarly ac-ceptance of OA research output, but these new user-oriented web indicators are still in an early experi-mental phase. The rationale of these approaches is strong but standardization of web metrics is at the beginning.
In agreement with Thelwall’s opinion that “pro-viding information that may be used to take correc-tive action in research policy” (2004: 233) is an ambitiousgoalforourweb-basedindicators,research shows this to be a worthy goal, but there is still much to be done in evaluation of OA research. In addition we need further approaches to build robust measures and metrics especially for OA publica-tions/documents. Following the thesis “science is turning to e-science” (Kretschmer and Aguillo, 2005; WISER website, 2005) we conclude that e-science will need new stable e-indicators or a combination with traditional indicators to appropri-ately take e-only research output into consideration.
Notes
1. Definition by Mike Thelwall: “Statistics about university web sites are, therefore, process indicators (Scharnhorst, 2004). These can be used to provide information to aid policy makers and managers to ensure that web sites are being used effec-tively as part of the processes of education and research” (Thelwall, 2004: 228).
2. Limitations and differences in search engine APIs data (Google APIs and Yahoo! APIs) can be tested with some live demos, available at: <http://bsd119.ib.hu-berlin.de/~ft/index_e. html>, last accessed 20 June 2006.
3. See <http://www.dini.de/veranstaltung/workshop/oaimpact/ programm.php>, last accessed 20 June 2006, for the work-shop programme and presentations.
4. The prototype Web Entry Miner (WEM) and sample log data are available at <http://www.ib.hu-berlin.de/~mayr/wem/>. 5. Projects to build indicators/metrics out of usage data: eg the
bX project of the Los Alamos National Laboratory and Ex Lib-ris or the Interoperable Repository Statistics (IRS) project by University of Southampton <http://irs.eprints.org/>, last ac-cessed 20 June 2006, presented recently (see note 3).
References
Bar-Ilan, Judit 1998/9. Search engine results over time: a case study on search engine stability. Cybermetrics, 2/3. <http:// www.cindoc.csic.es/cybermetrics/articles/v2i1p1.html>, last accessed 15 January 2006.
Bar-Ilan, Judit 2005. Comparing ranking of search results on the Web. Information Processing and Management, 41(6), 1511–1519.
Bollen, Johan, Herbert van de Sompel, J A Smith and Rick Luce 2005. Towards alternative metrics of journal impact: a com-parison of download and citation data. Information Processing and Management, 41(6), 1419–1440.
Brody, Tim and Stevan Harnad 2005. Earlier Web Usage Statis-tics as Predictors of Later Citation Impact. Technical report. <http://eprints.ecs.soton.ac.uk/10647/>, last accessed 15 January 2006.
Jamali, R. Hamid, David Nicholas and Paul Huntington 2005. The use and users of scholarly e-journals: a review of log analysis studies. Aslib Proceedings, 57(6), 554–571.
Katz, J Sylvan 2004. Co-Link Web Indicators of the European Research Area. Technical report. <http://www.sussex.ac.uk/ Users/sylvank/pubs/Co-Link.pdf>, last accessed 15 January 2006.
Kretschmer, Hildrun and Isidro Aguillo 2005. New indicators for gender studies in Web networks. Information Processing and Management, 41(6), 1481–1494.
Kurtz, J Michael, Guenther Eichhorn, Alberto Accomazzi, Carolyn Grant, Markus Demleitner, Edwin Henneken and Stephen S Murray 2005. The effect of use and access on citations. Infor-mation Processing and Management, 41(6), 1395–1402. Lawrence, Steve 2001. Online or invisible? Nature, 411(6837).
<http://citeseer.ist.psu.edu/online-nature01/>, last accessed 15 January 2006.
Mayr, Philipp 2004a. Entwicklung und Test einer logfilebasierten Metrik zur Analyse von Website Entries am Beispiel einer akademischen Universitäts-Website. Berliner Handreichungen zur Bibliothekswissenschaft und Bibliothekarsausbildung, 129. Published Master’s thesis. <http://www.ib.hu-berlin.de/ ~kumlau/handreichungen/h129/>, last accessed 15 January 2006.
Mayr, Philipp 2004b. Website entries from a web log file perspec-tive: a new log file measure. Proceedings of the AoIR-ASIST 2004, Workshop on Web Science Research Methods. <http:// cybermetrics.wlv.ac.uk/AoIRASIST/mayr.html>, last accessed 15 January 2006.
Mayr, Philipp and Fabio Tosques 2005. Google Web APIs – an instrument for webometric analyses? In Proceedings of ISSI 2005, (eds.) P Ingwersen and B Larsen, pp. 677–678. Stock-holm. <http://www.ib.hu-berlin.de/~mayr/arbeiten/ISSI2005_ Mayr_Toques.pdf>, last accessed 15 January 2006.
McVeigh, E Marie 2004. Open Access Journals in the ISI Citation Databases: Analysis of Impact Factors and Citation Patterns. A citation study from Thomson Scientific. <http:// www.thomsonscientific.com/media/presentrep/essayspdf/ openaccesscitations2.pdf>, last accessed 15 January 2006. Nicholas, David and Paul Huntington 2003. Micro-mining and
segmented log file analysis: a method for enriching the data yield from Internet log files. Journal of Information Science,
29(5), 391–404.
Nicholas, David, Paul Huntington, Nat Lievesley and Richard Withey 1999. Cracking the code: web log analysis. Online and CD-ROM Review, 23, 263–269.
Nicholas, David, Paul Huntington, Tom Dobrowolski, Ian Rolands, R Hamis Jamali and Panayiota Polydoratou, 2005a. Revisiting “obsolescence” and journal article “decay” through usage data: an analysis of digital journal use by year of publication. Infor-mation Processing and Management, 41(6), 1441–1461. Nicholas, David, Paul Huntington and Antony Watkinson 2005b.
Scholarly journal usage: the results of deep log analysis. Jour-nal of Documentation, 61(2), 248–280.
Thelwall, Mike 2001. Web log file analysis: backlinks and queries. Aslib Proceedings, 53, 217–223.
Thelwall, Mike 2004. Link Analysis: An Information Science Ap-proach. Amsterdam: Elsevier.
WISER project website 2005. <http://www.wiserweb.org>, last accessed 20 June 2006.