Performance measurement systems for virtual
enterprise integration
RICARDO CHALMETA and REYES GRANGEL
Abstract. A performance measurement system (PMS) is a
decision support system that through a set of indicators allows an analysis the current state of an enterprise and to compare it with the strategic objectives. It is therefore a fundamental tool for management control in business.
1. Introduction
Although different methodologies have been pro-posed to build a performance measurement system (PMS) at individual enterprises, they are not completely satisfactory for their application to virtual enterprises. A virtual enterprise (VE) is a temporary alliance of globally distributed independent enterprises that come together to offer a product or a service. Therefore, a VE is also an aware enterprise that should use a PMS in the kernel of its strategic management system (SMS) to achieve a high level of integration and efficiency among the different enterprises that form it.
This paper presents a proposal for a methodology to define and develop a PMS suitable to the necessities of VEs. In addition, it shows a practical case of its application to a virtual transport enterprise, indicating the activities that were carried out and the obtained results, as well as the computer infrastructure devel-oped to support the PMS.
2. Performance measurement systems
In any enterprise there are a number of targets to be achieved, which are often termed strategic objectives
and which are considered fundamental for its success and the maintenance of its competitive advantage. To monitor the degree of fulfilment of these objectives and to assist in suitable decision-making to achieve them, a PMS needs to be developed. The purpose of this system is: (1) to provide quantitative information about important aspects of the enterprise through a set of indicators; and (2) to establish the necessary action plans to reach the strategic objectives (Corbett and Claridge 2002).
The indicators measure the efficiency and effective-ness of an enterprise taking into consideration different perspectives (such as financial, productivity, customer satisfaction, quality or ability to adapt to changes), decisional level (strategic, tactical and operative) and organizational areas (store, production, purchases, administration, etc.). The choice of the set of indicators depends on each enterprise and for the correct identification it needs to define several parameters such as its name, purpose, related aims, value to be achieved in a period of time, method of calculation, unit to be used, how frequently it must be calculated, data source, compression criteria or form of presenta-tion. On the other hand, the indicators must be distinguished between cause indicators, which show what has to be done to achieve the objectives, and effect indicators, which define how to measure the effect of the cause indicators.
In the design of a PMS, one of the most difficult aspects to achieve is to get correct alignment with the enterprise strategy in order to show information about the degree of attainment of the strategic objectives. On the other hand, in subsequent phases of its deployment, this kind of tool allows users to value the importance of the information as support for the decision-making and the advisability of developing an information system within the framework of a strategic plan process.
Authors:Ricardo Chalmeta and Reyes Grangel, Grupo IRIS - Departamento de Lenguajes y Sistemas Informa´ticos, Universitat Jaume I, Campus Riu Sec s/n 12071 Castello´n, Spain. Email: [email protected]/[email protected]
INT. J. COMPUTER INTEGRATED MANUFACTURING, ?MONTH? – ?MONTH?2004,VOL. 17,NO. 0, 00–00
International Journal of Computer Integrated Manufacturing ISSN 0951-192X print/ISSN 1362-3052 online#2004 Taylor & Francis Ltd
http://www.tandf.co.uk/journals DOI: 10.1080/0951192042000213164
3. PMS for virtual enterprises
A VE is a temporary alliance of globally distributed independent enterprises that come together to share resources, skills and costs, supported by information and communication technologies (I&CT), in order to better attend market opportunities and successfully fulfil a responsible corporate strategy (Gunasekaran 1998).
As a consequence of this high level of characteriza-tion, an integrated VE is also an aware enterprise; meaning that changes in the internal or external environment should as soon as possible be reflected in the objectives and in its actions; making sure that the activities of all the components contribute to the overall objective in a coordinated way. Within this framework, a PMS is a fundamental tool for achieving a high degree of integration since it can be employed as the foundation of an integrated and iterative strategic management system, that will allow the VE to measure and assess its performance against its strategic objec-tives. At the same time, it will assist in the decision-making and the design of action plans. Figure 1 shows the position of a PMS within a virtual enterprise integration project (Chalmeta and Grangel 2003).
A PMS will enable a virtual enterprise to: . Clarify and update strategy.
. Reconsider the situation of each enterprise that forms it and of the VE as a whole.
. Communicate strategy throughout the VE. . Align enterprises, unit and individual goals with
the VE strategy.
. Link objectives to long-term targets and annual budgets.
. Conduct periodic performance reviews to learn about and improve strategy.
4. Methodology for virtual enterprise PMS development
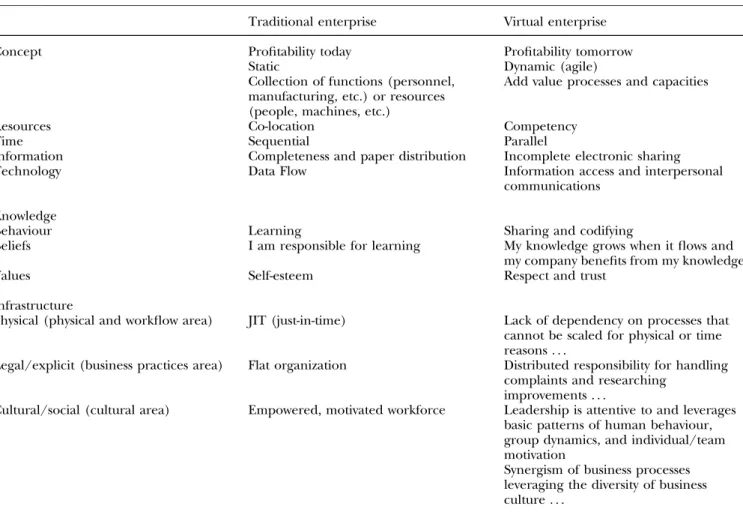
Previous research has been carried out to provide methodologies that allow managers to develop PMS in individual enterprises and to assist in the decision-making at different levels (Kaplan and Norton 2000). However, they are not completely satisfactory when it comes to meeting the peculiarities of VEs. Table 1
PMS RR.HH.
¥ Human structure: who, how, when ¥ Knowledge management ¥ Cultural change New cross -organizational & internal processes map IMPLEMENTATION OF THE VIRTUAL ENTERPRISE Implantation of improvements Insurance (ISO 9000) Continuous improvement REDESIGN OF CROSS
ORGANIZATIONAL & INTERNAL BUSINESS PROCESSES
Modelling and Analysis
Diagnostic and Proposals of Improvements
AS-IS TO-BE INFORMATION SYSTEM Strategic Tactic Operative ... ... ...
Information Technologies Manual ... ... Strategic information system E.I.S. Work flow
Information system for the daily activities Decision support system
Internal business process Cross organizational Business process VIRTUAL ENTERPRISE CONCEPTUAL ASPECTS ¥ Partners transactions ¥ VE strategy ¥ VE objectives INDIVIDUAL ENTERPRISES CONCEPTUAL ASPECTS ¥ Strategy ¥ Objectives PMS PMS ¥ ¥
¥ Information Technologies Manual
E.I.S. ¥ ¥ ¥ ¥ ¥ ¥ ¥
¥ Information Technologies Manual
¥ ¥ ¥ ¥ ¥ ¥ ¥ ¥ ¥ ¥
¥ Information TechnologiesInformation TechnologiesInformation TechnologiesInformation TechnologiesInformation TechnologiesInformation technologies ManualManualManualManualManualManual ¥ ¥ ¥ ¥ ¥ ¥ ¥ ¥ ¥ ¥ ¥ ¥ ¥ ¥ ¥ Figure 1. ????.
12
shows some of the differences between a single and a virtual enterprise.
To solve the problem of developing a PMS for VEs we need to adopt a wider view that considers their special features, such as the assessment of co-ordination mechanisms or the relations between staff from different enterprises.
The methodology proposed in this paper for VE PMS development considers the above VE aspects. It is the result of the work carried out by the IRIS group from Universitat Jaume I in Castello´n, Spain. The methodology is organized as a sequence of hierarchical deployment. The first step begins at the strategic level, when the managers of the different partners design the VE as a whole. Then, they go through an iterative cycle that contains the following activities (see figure 2):
. To define virtual enterprise strategic objectives. . To translate virtual enterprise strategic objectives
to action plans.
. To select strategic cause-effect indicators and to establish the relations among them.
The next step consists in turning the organization’s high level strategic objectives and measures into low level objectives and measures that identify the perfor-mance and the degree of integration achieved in the VE, take different perspectives, decision levels and organizational areas into consideration. The identifica-tion and organizaidentifica-tion of the objectives and measures depends on each type of virtual enterprise, but the following aspects must be analysed and assessed:
. Mechanisms for organization and coordination of all the enterprises involved in the virtual enter-prise, in order to: (1) develop a specific action plans and joint activities; and (2) identify the organizational changes that facilitate the enter-prises joint operation and the transference of knowledge among them.
. Working practices in the critical inter-organiza-tional business processes.
. Technological infrastructure that allows the auto-mation of the inforauto-mation flow of the inter-organizational business processes.
Table 1. Some differences between a single and a virtual enterprise (adapted from Burn 2000).
Traditional enterprise Virtual enterprise
Concept Profitability today Profitability tomorrow
Static Dynamic (agile)
Collection of functions (personnel, manufacturing, etc.) or resources (people, machines, etc.)
Add value processes and capacities
Resources Co-location Competency
Time Sequential Parallel
Information Completeness and paper distribution Incomplete electronic sharing
Technology Data Flow Information access and interpersonal
communications Knowledge
Behaviour Learning Sharing and codifying
Beliefs I am responsible for learning My knowledge grows when it flows and
my company benefits from my knowledge
Values Self-esteem Respect and trust
Infrastructure
Physical (physical and workflow area) JIT (just-in-time) Lack of dependency on processes that cannot be scaled for physical or time reasons . . .
Legal/explicit (business practices area) Flat organization Distributed responsibility for handling complaints and researching
improvements . . .
Cultural/social (cultural area) Empowered, motivated workforce Leadership is attentive to and leverages basic patterns of human behaviour, group dynamics, and individual/team motivation
Synergism of business processes leveraging the diversity of business culture . . .
2
. Communication techniques to reduce the dif-ferences that exist among the different enter-prises.
. Relationships between people from different enterprises, to share information, exchange tech-nology and take part in group work together. Once the objectives and indicators to manage the virtual enterprise are defined, the previous steps have to be applied to each enterprise that make it up. The objectives and indicators to be defined depend on each type of enterprise, but they must be consistent with the ones previously established for the VE management. Therefore, the PMS will give managers a way of ensuring that all levels of the VE understand the long-term strategy and that everything (individual enter-prises, departments and local objectives) are aligned with it.
The last point as regards the methodology is to update through reviews the strategy or business processes of the virtual enterprise and the individual enterprises. Therefore, the PMS must not just be considered as a way of obtaining a set of indicators but instead as a mechanism to improve the efficiency and competitiveness of the virtual enterprise.
Five techniques are used in the methodology to develop a PMS: ABC (activity based costing); Hoshin
Kanri; benchmarking; European Quality Model; and simulation.
. ABC: analysis of the factors that are the causes of costs in the different activities and processes. . Hoshin Kanri: deployment of a quality strategy for
the VE and for each individual enterprise. This tool tries to align the quality strategy with operative plans and tactics.
. Benchmarking: through the analysis of competi-tors’ behaviour and performance, specific areas for improvement can be identified.
. European Quality Model: this establishes prac-tical guidelines to obtain a Total Quality System, through the compliment from ISO 9000 stan-dard.
. Simulation: this is a tool used to identify the relationships between objectives and indicators that are based only on subjective. The feedback about indicators information and its relations to the strategic objectives must be stored in a database that constitutes the historical data source to establish simulation and validation about previous relations.
Once the PMS has been designed, there is a need to build a computer infrastructure that supports the
Define virtual enterprise mission and
values
Identify and define virtual enterprise strategic objectives
Select cause indicators corporation Establish cause-effect relationships. Translate strategy to enterprises, departments, processes and activities Select cause indicators for enterprises, departments, processes and activities Select effect indicators corporation Select effect indicators for enterprises, departments, processes and activities Strategic feedback (reviews). Set goals (short-term). Action plans Quality indicators Budget BENCHMARKING Database SIMULATION Validate indicators Strategic problems ABC EUROPEAN QUALITY MODEL Figure 2. ????.
1 2
processes that are carried out for the establishment and running of the system. This infrastructure must allow the system, first, to collect and integrate the scattered information in the various databases and others sources from each individual enterprise in a data warehouse. The data warehouse structure must be optimized for the subsequent consultation and analysis of the data. The data warehouse can be analysed from three perspectives (Jarke and Vassiliou 1997):
. Conceptual perspective: represents the usefulness of the data warehouse to impose an overall business perspective, a conceptual enterprise model, on the information resources and analysis of the tasks of an organization.
. Logical perspective: conceives a data warehouse from the viewpoint of the actual data models involved, while considering the wrapping of heterogeneously represented data sources, and the integration of data from multiple sources into particular views.
. Physical perspective: interprets the data ware-house architecture as a network of data stores, data transformers, and communication channels, aiming at the quality factors of reliability and performance in the presence of very large amounts of slowly changing data.
The steps, which should be carried out to create a data warehouse following a top-down design are (Inmon 1996):
(1) Data extraction (once the potential structured and unstructured data sources have been identified and selected).
(2) Data transformation (once the quality has been checked and the data cleaned).
(3) Data migration.
(4) Data and metadata loading in the enterprise warehouse and centralized metadata repository (once the links between origin and destination have been set). These first four steps must be carried out by using the extraction transforma-tion migratransforma-tion and loading tools (ETML). (5) Creation of data marts, (a set of data
ware-houses that represents different views of the enterprise), from data warehouse and meta-data.
In addition, other previous technical activities have to be carried out, such as: integrating the servers, storage, and customer tools; designing the warehouse schema and views; defining the physical warehouse
organization, data placement, partitioning, and access methods; connecting the sources using gateways, ODBC drivers, or other wrappers, etc. (Chaudhuri and Dayal 1997).
Second, to calculate and present indicators using on-line analytical processing (OLAP) tools. Once the data has been integrated in the data warehouse, it is then possible to calculate and analyse the VE indicators. OLAP tools are used for that. They are a kind of software technology that allows quick access into the strategic information, due to using multidimensional views of added data to carry out many important analysis that are difficult or impossible to express in SQL using tabular structures. OLAP and data ware-houses are complementary. A data warehouse stores and manages data. OLAP transforms data from the data warehouse into strategic information that ranges from basic navigation and browsing, to calculations and more serious analyses such a time series and complex modelling (OLAP Council 1997).
Three categories of OLAP architectures can be identified, depending on the paradigm that they use for the physical storage of the data (Dinteret al. 1999):
(1) MOLAP (Multidimensional OLAP): these sys-tems have a multidimensional database manage-m e n t s y s t e manage-m ( M D B M S ) d e s i g n e d f o r multidimensional query processing. They are not commercially implemented by means of a uniform and commonly accepted technology. However, due to the great amount of data that must be handled in the PMS (many cells from the multidimensional cube will be empty), these systems are very useful. In one way, they use techniques for optimum data storage, the majority based on two levels of data structures, while in another, they efficiently manage the multi-user access to writing and reading. (2) ROLAP (Relational OLAP): this provides
multi-dimensional user views of data, which still resides in a relational database management system (RDBMS). The ROLAP engine usually translates relational schema into a multidimen-sional schema, and the majority of systems require star or snowflake schemas. From a technical point of view, putting the ROLAP engine into operation is the critical point of this kind of systems. The multidimensional schema (the equivalent to the entity/relation model in the relational database) is made up of fact tables and several dimension tables linked with each of the fact tables.
(3) HOLAP (Hybrid OLAP): this is the integration of MOLAP and ROLAP, in order to take Measurement systems for virtual enterprise integration
advantages of both of them and avoid their inconveniences.
Third, to obtain the necessary data at the right time. A vast amount of information is handled inside the virtual enterprise and it will increase due to the quick advance of new computer technologies. However, the problem with the exchange of information needed to build a PMS it is not the handling of large amounts of information, but rather the control of certain char-acteristics of that information, such as the variability in data format, the data validity, their exchange and ways of sharing them, etc. All these factors are especially important in the integration of the VE information system and they are solved by the two technologies mentioned above.
5. Case study: PMS for virtual transport enterprises
5.1.Virtual transport enterprises
In the global market environment, most transport enterprises do not have the financial and structural capability to afford the cost of operating direct routes with different points of origin and destination. There-fore, in order to satisfy the customer requirements, local transport enterprises must work together through the establishment of co-operative agreements to set up what we call virtual transport enterprises (VTE).
A VTE should be capable of taking full responsibility for a door-to-door transport service on behalf of its customers, and should be capable of defining an optimal solution, taking advantage of the availability of different types of transport and finding true added value for transport services.
5.2.Application of the methodology
Below, we show the results of a contract research study, which was conducted by the IRIS group from Universitat Jaume I in Castello´n. The purpose of this study was to apply the methodology described above in the development of a PMS for CAVE Logı´stica. CAVE Logı´stica is a VTE made up of group of more than 50 Spanish individual transport enterprises, of small and medium size, that exchange information and goods among themselves and with enterprises from other countries.
The services it offers can be summed up as follows: (1) pickup at sender’s location, conventional or express transport, and delivery to any part of Spain, of fractioned or complete loads; and (2) goods depot
and storage. The company also offers its customers the possibility of international transport and delivery, thanks to agreements reached with logistics enterprises in other countries. As regards the resources at its disposal, the CAVE Group has 1105 employees, its premises cover a total surface area of 105 000 m2, it covers over 350 delivery routes per day and has a fleet of 875 vehicles.
In addition, an enterprise called Central was set up to manage and organize this virtual enterprise, as well as to develop the computer infrastructure. Some of the tasks it is responsible for include logistics management, quality control, national and international sales, ac-counting and technical consultation.
The project for obtaining a PMS for CAVE Logı´stica was structured in three phases, which are divided into different activities, as shown in figure 3. The starting point was to establish the VE master lines, beginning with the definition of mission, vision and values. Next, they identified the markets and customers segments in which the organization competes taking different criteria into consideration such as the geographical zone to which the goods are destined, the type of clients, the type of goods to be transported (bulky, difficult to handle, stored on pallets), etc.
The following task was to define the VE strategy, considering this phase as an opportunity to improve. To do it, it was necessary to: (1) analyse the strategic problems; (2) define the main deficiencies regarding the formulation of the virtual enterprise’s strategy, and propose improvements that determine the right me-chanism for a correct and co-ordinated strategic planning of the virtual enterprise and the different individual enterprises; and (3) establish the strategic objectives of the VE. Table 2 shows examples of the results obtained from these activities at phase 1.
Once the strategic objectives had been defined, following the Hoshin Kanri model, it was necessary to determine: (1) the different action plans to solve the strategic problems that were detected and how to achieve the objectives set; and (2) the cause and effect indicators that allowed it to measure the attainment of the objectives set for the VTE. Those indicators were linked by relationship of cause and effect, which, in some cases, made it necessary to use simulation techniques.
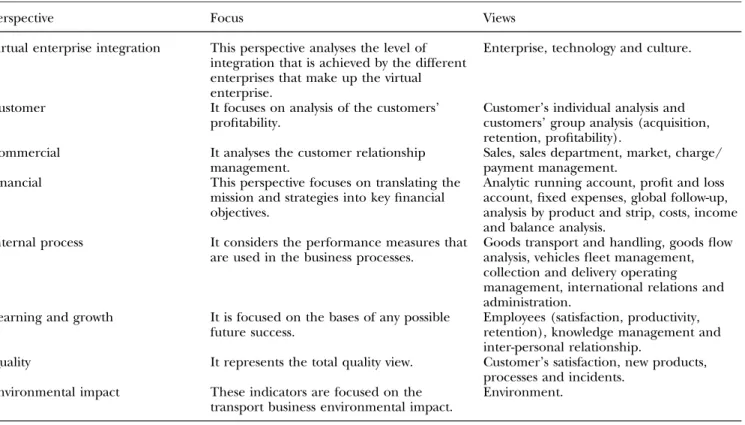
The objectives, the action plans and the indicators that would allow evaluation of the degree of fulfilment were organized in eight different perspectives (virtual enterprise integration, customer, commercial, financial, internal process, learning and growth, quality and environmental impact), which at the same time were broken down into views (table 3). Each view could be analysed considering different decisional levels and
organizational areas. Table 4, shows an example of the relationship among objectives, action plans, cause indicators, and effect indicators for the customer’s satisfaction view of the quality perspective, at the operative and tactical level, and at the traffic and sales organizational areas.
The PMS employed to evaluate the VTE perfor-mance as a whole was applied to each individual transport enterprise (phase 2). The procedure was similar to the one that was carried out to obtain the PMS for the VE. The VE objectives were taken as principal reference points together with the
peculia-Define CAVE mission Define CAVE mission
segments
Identify markets and customer segments
Identify strategic problems Identify strategic problems
Detect deficienciesand propose improvements
Define virtual enterprise strategic objectives Define virtual enterprise
strategic objectives
Determine actions plans for the virtual enterprise Determine actions plans for
the virtual enterprise
Establish indicators of de virtual enterprise Establish indicators of de virtual enterprise BENCHMARKING BENCHMARKING
Determine criteria for goal-settings Define strategic objectives for
each individual enterprise
Identify actions plans for each individual enterprise
Establish strategic indicators for each individual enterprise Deploy each individual enterprise
strategic indicators in indicators for areas and processes
Consolidate the virtual enterprise indicators
system Deploy each individual enterprise
strategic indicators in indicators for people and equipment
Validation of the virtual enterprise indicators
system
Determine criteria for goal-settings Determine criteria for
goal setting
Define strategic objectives for each individual enterprise Define strategic objectives for
each individual enterprise
Identify actions plans for each individual enterprise Identify actions plans for each
individual enterprise
Establish strategic indicators for each individual enterprise
Establish strategic indicators for each individual enterprise Deploy each individual enterprise
strategic indicators in indicators for areas and processes Deploy each individual enterprise
strategic indicators in indicators for areas and processes
Consolidate the virtual enterprise indicators
system Consolidate the virtual
enterprise indicators system Deploy each individual enterprise
strategic indicators in indicators for people and equipment Deploy each individual enterprise
strategic indicators in indicators for people and equipment
Validation of the virtual enterprise indicators
system Validation of the virtual
enterprise indicators system Validation for each individual
enterprise indicators system Revisions
Deployment and follow-up of the virtual enterprise and each individual enterprise indicators
system
Validation for each individual enterprise indicators system
Revisions
Deployment and follow-up of the virtual enterprise and each individual enterprise indicators
system
Validation for each individual enterprise indicators system Validation for each individual enterprise indicators system
Revisions Revisions
Deployment and follow-up of the virtual enterprise and each individual enterprise indicators
system
Deployment and follow-up of the virtual enterprise and each individual enterprise indicators
system Phase 1 Phase 3 Phase 2 Figure 3. ????.
2
1
Table 2. Examples of results of the application of the methodology phase 1 to the CAVE Logı´stica organization. Strategic problems . Deficiencies in the quality of service.
. Criteria diversities and ways of work at the individual enterprises in both the treatment of the goods and the treatment of information.
. Lack of cost control, both fix an variable.
. Lack of a true corporate image at the organization. . Insufficient technological infrastructure.
Main deficiencies and proposal of improvement
Deficiency Proposed improvement
The virtual enterprise strategic objectives just set an example to follow by all the individual enterprises, without having a clear commitment to comply them.
Creation of a committee that determines the strategic objectives to follow by the different independent enterprises.
Establishment of goals by the zone manager of the different individual enterprises, using very subjective criteria.
Deployment of a unique goal setting system from the information given by the following tools:
. Competitor enterprises evolution (benchmarking). . Future PMS indicators.
The strategic revision by the virtual enterprise is currently limited to obtain information from the different individual enterprises. As a result, the flow of information only has one direction.
Periodic meetings between central executives with the individual enterprises managers to revise the strategic objectives by means of the information given by the future PMS and its co-ordination with the virtual transport enterprise objectives. So the flow of information will be in both directions.
Every enterprise measures customer’s satisfaction in a different way.
Deployment of a system to measure the customer’s satisfaction using the indicators to define in the PMS.
Virtual Transport Enterprise strategic objectives
Two aspects are specially important:
(1) Customer’s satisfaction, for which it must take as reference the added value that the transport service offer them. That value includes three points: The relationship with the customer, the image that is offered by the enterprise, and the service attributes (functionality, quality, price and time).
(2) The processes that the organization needs to promote to improve the customer’s satisfaction. These processes are classified in three groups. Innovation Processes, to identify the needs of current and future customers; Operative Processes, such as collection, collection handling, transport, intermediate handling, delivery handling, goods delivery and documentation; and after-sales service processes, such as incident treatment, customer services, etc.
2
8 R. Chalm eta and R. Grange lrities of each enterprise such as its culture, sizes, customer segment they work with, etc. Therefore each enterprise had to revise its mission, vision, strategy and strategic objectives; to identify its action plans; and to establish the cause and effect indicators, but always in line with those defined for the VE.
The indicators of each individual transport enter-prise are the data that allow us to calculate the VE indicators. Thus, the system of indicators from each enterprise had to be similar and consistent with the ones designed for the VE. Therefore, the same structure, units, calculation procedures, etc. were used in order to make comparisons. Some of the criteria considered to group the indicators of the individual enterprises, were the geographical zone, the enterprise size, the type of transported goods, the type of customer they target at, the amount of business done, the strategic objectives to be achieved, the similar working ways, and the market share.
The final phase of the PMS development was its validation and deployment (phase 3). The validation considered the way of obtaining the information (methodology used to acquire it and information sources), its introduction in the system, the periodi-city, and the users to whom it is directed. On the other hand, deployment was carried out progressively,
first at some pilot enterprises, so as to be able to detect possible initial deficiencies and then, once it was validated and revised, at the rest of the enterprises.
Within the deployment phase, and in order to get the maximum benefit from the PMS, it was necessary to introduce benchmarking techniques in the individual enterprises and in the management of the VE. Thus, the enterprises would have some reference values to set forecasts or objectives for the indicators in order to compare whether the real enterprise data correspond to those initially planned. The viewpoints considered within benchmarking were:
. Internal: establishing comparisons among the individual transport enterprises at the depart-ment and process level.
. Competitive: analysing the ways principal compe-titors work.
. Out of the sector: identifying better work practice, taking as a reference all sorts of enterprises. Reference enterprises, competitors’ most outstanding activities, indicators to chose for comparison, bench-marking users and application areas were defined for each one of the benchmarking points of view.
Table 3. Perspectives and views of the objectives, actions plans and indicators.
Perspective Focus Views
Virtual enterprise integration This perspective analyses the level of integration that is achieved by the different enterprises that make up the virtual enterprise.
Enterprise, technology and culture.
Customer It focuses on analysis of the customers’
profitability.
Customer’s individual analysis and customers’ group analysis (acquisition, retention, profitability).
Commercial It analyses the customer relationship
management.
Sales, sales department, market, charge/ payment management.
Financial This perspective focuses on translating the
mission and strategies into key financial objectives.
Analytic running account, profit and loss account, fixed expenses, global follow-up, analysis by product and strip, costs, income and balance analysis.
Internal process It considers the performance measures that are used in the business processes.
Goods transport and handling, goods flow analysis, vehicles fleet management, collection and delivery operating management, international relations and administration.
Learning and growth It is focused on the bases of any possible future success.
Employees (satisfaction, productivity, retention), knowledge management and inter-personal relationship.
Quality It represents the total quality view. Customer’s satisfaction, new products,
processes and incidents. Environmental impact These indicators are focused on the
transport business environmental impact.
Environment.
2
5.3.Computer infrastructure
As it has been said above a PMS for VE becomes operative, it needs a computer infrastructure that allows it to automatically integrate the information from the different enterprises that form it.
From a physical point of view, the developed computer infrastructure for CAVE Logı´stica is sup-ported by an extranet that links Central with each of the individual transport enterprises that make up the VE and with one another. This extranet is just the result of the connection of the intranet of each of the individual enterprises with Central, which then allows external access after self-identification. Its purpose is the creation of a high quality information exchange network by means of a fast, efficient and secure system. This solution was evaluated as being less costly and simpler than contracting the services of an added value network.
From a logical point of view, the computer infra-structure adopts a pyramidal infra-structure (see figure 4). The bases of the pyramid are: (1) the structured data that are in the RDBMS that supports the enterprise ERP, in the RDBMS of the application of customer relationship management (CRM), and in the databases and spreadsheet that the executives have developed to cover their specific needs; (2) the non-structured data from e-mails and letters; and (3) the information of each individual enterprise concerning PMS (strategic objectives, action plans, etc.). This data is computerized in order to obtain a data warehouse, in which only the information that is important and significant for the PMS is stored.
The process that was followed to obtain the data warehouse, using OLE DB techniques, included: the identification of the data sources (structured and non-structured data and PMS data), the extraction and assessment of their quality (through validation techni-ques, cleaning, and tidying), the creation of the data warehouse structures, and the achievement of the connection process and data feedback between the databases.
With regard to the data warehouse, the PMS software allows the calculation of the indicators, carries out a multidimensional comparative analysis using the OLAP tools and assesses the level of fulfilment of the objectives. Thus, complex queries can be carried out in a fast and simple way even non-technical personnel. For example, the sales by customer can be analysed simultaneously, taking its geographical location area and type of goods to be transported into consideration.
The PMS software offers detailed graphic reports with all the cause and effect indicators that are
Table 4. Relationship among objectives, action plans and indicators for the customer’s satisfaction view of the quality perspective. Objective Action plans Cause indicators Effect indicators To improve the quality of the service offered to the customer. . To analyse and improve the process of transporting goods. . Development of a computer tool for the truck fleet organization. . Compliance with service period, origin/ destination. . Correct documentation of goods. . Correct transport of goods. . Delivery dates not complied with. . Service average time. . Goods delivered with incidents. . Goods delivered without incidents. . Total goods awaiting delivery. . Delivery average time of the goods with incidents. . Economic sanctions. To improve customer’s satisfaction . To expand the Computer System functionality to control the state of the orders. . Employees training in marketing techniques. . Punctual and reliable information about the physical/geographical position of the goods. . Improvement of personnel’s treatment of the customer (telephonist salesman, distributor, executives). . Good use of the information given by the customer, especially as regards to priority goods. . Customer complaints. . Incidents by customer and expedition. . Number of incidents by expedition. . Number of customer queries about the state of the orders.
contained within the PMS and allows them to be grouped according to the perspectives, decisional levels and organizational areas that were previously defined. The application has been tested to:
. Supply information for each of the users. . Show the level of improvement for each of the
indicators as regards the goals set for the users. . Calculate the trends followed by the indicators. . Generate simplified but significant reports. . Test the temporal accuracy of the information. When the enterprises have calculated their indicators, the information is sent to Central through the extranet that links them. These indicators, together with the structured and non-structured data and the PMS information that Central has, are turned into the data that serve to calculate the virtual enterprise indicators with the Central PMS software, once they have been incorporated into the data warehouse of Central.
5.4.Lessons learned
The main difficulties in applying the methodology developed by the IRIS Group in the virtual enter-prise, CAVE, arose during the implementation of the first and second phase. It is important to bear in mind that the virtual transport enterprise CAVE is made up of a set of transport enterprises each of which has its own size, structure and organization. Although their alliance is based on common goals, the way each enterprise is organized and how it aims to reach those goals is different. Consequently, in the first phase, it was difficult to reach an agreement about the posture to be adopted by all the members of CAVE because, although CAVE was set up with the clear objective of offering its customers the best service, it was quite difficult to turn the strategic objectives of the VE into what would become the action plans and indicators that would allow a control over whether or not those aims had been accom-plished.
Figure 4. ????.
12
Once the indicators of the VE had been agreed on, the second difficulty come about when each of the enterprises involved had to carry out the second phase. In the enterprises that had already implemented a PMS there was some resistance to change, as it was necessary to swap the indicators that had been used up till then for others that allowed a certain degree of consistence with the new indicators that had been defined for the VE. In enterprises that did not use any kind of indicator, however, the company culture had to be changed so that its employees could recognize the value of using them and could work in the desired manner. After all the work that was carried out, the enterprises had a very positive appraisal of the effort that had been made, above all when the first results began to come in and they were able to evaluate the indicators obtained both on an individual level and for the VE. Implement-ing a computer infrastructure which, among other things, allowed the indicators to be submitted to an OLAP analysis was one of the points that contributed to the enterprises’ satisfaction and to the fact that the results obtained were really of value to the VE. Moreover, this common infrastructure and the set of indicators that were defined for the virtual enterprise played an important role in its success, since in this way it became an entity in its own right and was able to control its working and the level of results. Thus, one of the main changes carried out in each of the individual enterprises that went to make up CAVE was a change in their company culture.
Another benefit that was obtained by implementing the PMS is that it improved the level of integration in the VTE, better decisions were made and their competitivity was increased. Thus, the following quanti-tative results were obtained: lead time reduction, 30%; cost reduction, 25%; productivity increase, 30%; human satisfaction, 20%; new customers, 80%; no quality cost reduction, 20%.
6. Conclusion
A PMS is a type of decision support system that provides a set of important indicators to assess the enterprise state. There are in the literature different methodologies to develop a PMS, but they are all focused on the problems of individual enterprises; so they do not take into consideration the peculiarities of the virtual enterprises, such as the assessment of the co-ordination mechanism among the enterprises, the efficiency of the inter-organizational processes or the relationships among the personnel from different enterprises.
This paper has introduced a proposal to develop a PMS for a virtual enterprise, together with a case study.
The PMS resulting from the proposed analysis is not only considered as a way of obtaining a set of indicators, but also as a mechanism to improve the efficiency and competitiveness of the VE by adapting it to the market evolution. Thus, the application of the proposed methodology allows managers to establish a continuous improvement procedure that links the strategic objec-tives with the operating procedures of each of the individual enterprises.
To make it operational, a PMS for the virtual enterprise needs a suitable computer infrastructure that allows it to integrate and process, in an automatic way, the information from the different enterprises that make it up. Within this infrastructure, different technologies must be combined in order to: (1) extract the data from different sources and assess their quality; (2) create data warehouse structures; (3) carry out comparative multidimensional analysis; and (4) estab-lish a process for the connection and feedback of data between the data warehouse of the different enter-prises.
Acknowledgements
The VITI project was founded by CICYT DPI2003-02515 and Bancaja.
References
BURN, J. M. and ASH, C., 2000,Managing Knowledge for Strategic
Advantage in the Virtual Organization (Edith Cowan
Uni-versity).
CHALMETA, R. and GRANGEL, R., 2003, ARDIN extension for
virtual enterprise integration.Journal of Systems and Software, 67,141–152.
CHAUDHURI, S. and DAYAL, U., 1997, An overview of data
warehousing and OLAP technology.SIGMOD Record,26(1), 65–74.
CORBETT, L. M. and CLARIDGE, G. S., 2002, Key manufacturing
capability elements and business performance.International Journal of Production Research,40(1), 109–131.
DINTER, B., SAPIA, C., BLASCHKA, M. and HO¨ FLING, D. G., 1999, OLAP market and research: initiating the cooperation. Journal of Computer Science and Information Management,2(3). GUNASEKARAN, A., 1998, Agile manufacturing: enablers and an
implementation framework. International Journal of Produc-tion Research,36(5), 1223–1247.
INMON, W. H., 1996, Building the Data Warehouse(New York:
John Wiley & Sons).
JARKE, M. and VASSILIOU, Y., 1997, Data warehouse quality: a
review of the DWQ project. Proceedings 2nd Conference on
Information Quality, Cambridge, MA.
KAPLAN, R. S. and NORTON, D. P., 2000,Cuadro de mando integral
(The Balanced Scorecard)(Barcelona: Gestio´n).
OLAP COUNCIL, 1997,OLAP and OLAP Server Definitions(OLAP
Council).
3
4
5
3
International Journal of
Computer Integrated
Manufacturing
Typeset by Elite Typesetting for
TCIM
Manuscript No.
Author
Editor
Master
Publisher
QUERIES:
to be answered by AUTHOR
AUTHOR:
The following queries have arisen during the editing of your manuscript.
Please answer the queries by marking the requisite corrections at the appropriate positions
in the text.
QUERY NO. QUERY DETAILS QUERY ANSWERED
www.elitetypesetting.com T Y PE SE T TING TECHNI QU ES L TD
100497
1 Please supply captions for the four figures
2 No electronic copy supplied for tables and figures
3 Place of publication?
4 Page range please?