Structure-Based Drug Design
Application and Limitations of X-ray Crystallographic
Data in Structure-Based Ligand and Drug Design
Andrew M. Davis,* Simon J. Teague, and Gerard J. Kleywegt
Angewandte
Chemie
Keywords:
drug design · protein models · protein structures · X-ray crystallography
1.
Introduction
The use of protein structure information in drug discovery is often termed structure-based design, and it encompasses a number of technologies (Table 1). Although many pharma-ceutical companies invested heavily in structure-based design in the 1980s, by the 1990s it appeared pass , as the industry focused upon the new great hope for drug discovery—modern high-throughput screening (HTS) of compounds produced by combinatorial chemistry.
Presently, however, structure-based design is undergoing a renaissance. This renewed interest has a number of drivers. Advances in molecular biology have made possible the reliable production of homogeneous, natural or modified proteins suitable for rapid, iterative crystallographic and NMR studies of ligand–protein complexes. Mutagenesis of these cloned and expressed proteins allows direct probing of
ligand–receptor interactions.[28]A better understanding of the
energetics of ligand–receptor interactions has been derived from a combination of mutagenesis with classical
physical-organic chemistry investigations,[29]X-ray crystallography,[13]
and thermodynamic measurements.[30] The hardware and
software available to computational chemists has improved dramatically and so has the quality and speed of ligand docking algorithms. This has taken the subjectivity out of the placement of virtual structures into a protein's active site. It has also opened up the possibility of using structural information in lead generation. Virtual screening of large collections of compounds, or even larger virtual libraries, can
be undertaken almost routinely with tools like DOCK,[6]
GOLD,[8]FLEX-X,[7]and SLIDE.[23]Likewise, the prediction
of physical properties from structures has improved greatly. Currently much emphasis is being placed upon computationally filtering by physical properties to remove nondruglike
com-pounds[31,32]in order to frontload HTS or to guide library design.
The revolution in computer technology is showing no signs of slowing down, with current Linux farms allowing many hundreds of parallel calculations to be made in
acceptable timescales. By means of Seti technology[33]over
PC networks, researchers at the University of Oxford are using 1.2 million household PCs to screen 3.2 billion virtual structures in 13 protein active sites in a search for novel
anticancer agents.[34]Another important driver is the
increas-ingly high cost and competitiveness of drug discovery and development. This requires the process to be not only faster,
but also smarter.[35]Although HTS is useful in the hunt for
novel leads, screening of small subsets chosen by virtual screening can be very useful when the structure of the protein is available. This is especially true when other factors preclude HTS of the entire company file. The possibilities for successful structure-based design have never been greater.
[*] Dr. A. M. Davis, Dr. S. J. Teague AstraZeneca R&D Charnwood Bakewell Road, Loughborough
Leicestershire LE11 5RH (United Kingdom) Fax: (+44) 150-964-5576
E-mail: [email protected] Dr. G. J. Kleywegt
Department of Cell and Molecular Biology Uppsala University, Biomedical Centre Box 596, SE-75124 Uppsala (Sweden)
S
tructure-based design usually focuses upon the optimization of
ligand affinity. However, successful drug design also requires the
optimization of many other properties. The primary source of
struc-tural information for protein–ligand complexes is X-ray
crystallog-raphy. The uncertainties introduced during the derivation of an atomic
model from the experimentally observed electron density data are not
always appreciated. Uncertainties in the atomic model can have
significant consequences when this model is subsequently used as the
basis of manual design, docking, scoring, and virtual screening efforts.
Docking and scoring algorithms are currently imperfect. A good
correlation between observed and calculated binding affinities is
usually only observed only when very large ranges of affinity are
considered. Errors in the correlation often exceed the range of
affin-ities commonly encountered during lead optimization. Some
structure-based design approaches now involve screening libraries by using
technologies based on NMR spectroscopy and X-ray crystallography
to discover small polar templates, which are used for further
opti-mization. Such compounds are defined as leadlike and are also sought
by more traditional high-throughput screening technologies.
Structure-based design and HTS technologies show important complementarity
and a degree of convergence.
From the Contents
1.Introduction 2719
2.Structure-Based Design of
Ligands and Drugs 2720
3.Limitations in the Use of X-ray
Data 2723
4.PDB Files Used in Docking and
Scoring Studies 2728
5.Assessing the Validity of
Structure Models 2729
6.Automated Docking and
Scoring 2730
7.Convergence of Screening and Structure-Based Design 2732
Structure-based design and the technologies listed in Table 1 are an extremely active area of research and have
been extensively and frequently reviewed.[36–40] However,
these new technologies may not suffice, since their successful application still has some severe limitations. The aim of structure-based design is the optimization of ligand potency, which is usually measured in a simple in vitro competitive
inhibition or binding assay. How-ever, the aim of all pharmaceutical research projects is the discovery of a candidate drug. Here, we highlight the distinction between ligand design and drug design, and illustrate the difference with case histories from studies on
HIV-pro-tease, neuraminidase, carbonic
anhydrase, and renin inhibitors. In most cases the protein structure used in the structure-based design process has been determined by X-ray crystallography rather than NMR spectroscopy. The latter technique is limited by constraints on the molecular size of the protein and the requirement for multiple isotopic labeling. Since all the tech-nologies listed in Table 1 depend upon protein structural informa-tion, we highlight some of the pitfalls and limitations in protein structure determination by X-ray
crystallographic methods that
might otherwise mislead the
unwary user. Addressing these ambiguities may lead to further opportunities, which we highlight in this review.
2.
Structure-Based Design of
Ligands and Drugs
Structure-based design is often
loosely termed structure-based
drug design or rational drug
design. Usually the processes described could be termed more accurately structure-based ligand design, since the objective is to optimize the potency of a ligand in a simple in vitro assay. Drug design requires optimization of many other properties including dissolution, absorption, metabolic stability, plasma protein binding, distribution, elimination, toxicological profile, cost of synthesis, and pharmaceutical
Simon Teague, born in 1959 in Worcester (UK), gained his PhD at the University of Nottingham in the group of Professor G. Pattenden. He carried out postdoctoral work with Professor A. I. Meyers at Colorado State University (USA). He is now a Princi-ple Scientist at AstraZeneca R&D Charn-wood (UK). His research interests are lead generation methodologies and the study of drug–receptor interactions.
Andy Davis, born in 1961 in Wells, Somerset (UK), gained his BSc degree from Imperial College, London, and his PhD at the Univer-sity of Huddersfield with Professor M. I. Page for studies on the kinetics and mecha-nism of rearrangements of penicillins. He is now Associate Director of Physical Chemistry at AstraZeneca R&D Charnwood. His inter-ests are the energetics of ligand–receptor interactions, QSAR methods, and the coop-erative application of physical-organic and computational chemistry to drug discovery.
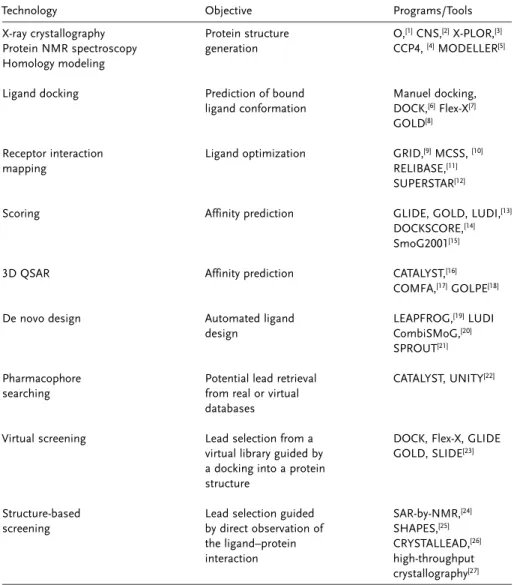
Table 1: A selection of current structure-based design technologies.
Technology Objective Programs/Tools X-ray crystallography Protein structure O,[1]CNS,[2]X-PLOR,[3]
Protein NMR spectroscopy generation CCP4,[4]MODELLER[5]
Homology modeling
Ligand docking Prediction of bound Manuel docking, ligand conformation DOCK,[6]Flex-X[7]
GOLD[8]
Receptor interaction Ligand optimization GRID,[9]MCSS,[10]
mapping RELIBASE,[11]
SUPERSTAR[12]
Scoring Affinity prediction GLIDE, GOLD, LUDI,[13]
DOCKSCORE,[14]
SmoG2001[15]
3D QSAR Affinity prediction CATALYST,[16]
COMFA,[17]GOLPE[18]
De novo design Automated ligand LEAPFROG,[19]LUDI
design CombiSMoG,[20]
SPROUT[21]
Pharmacophore Potential lead retrieval CATALYST, UNITY[22]
searching from real or virtual databases
Virtual screening Lead selection from a DOCK, Flex-X, GLIDE virtual library guided by GOLD, SLIDE[23]
a docking into a protein structure
Structure-based Lead selection guided SAR-by-NMR,[24]
screening by direct observation of SHAPES,[25]
the ligand–protein CRYSTALLEAD,[26]
interaction high-throughput crystallography[27]
properties. Structure-based design has already contrib-uted to the discovery of a number of very important drugs such as the peptidomimetic HIV-protease
inhib-itors nelfinavir (1), saquinavir (2), ritonavir (3),
indina-vir (4), amprenavir (5), and lopinavir (6, Scheme 1).
Peptidomimetic HIV-protease inhibitors are
already in clinical use. Although these drugs are successful commercially and clinically, they have dis-tinct therapeutic limitations, and the search for more effective inhibitors continues. Poor bioavailability has been reported for saquinavir, and variable bioavail-ability for a number of members of this class of agents. They also suffer from moderate to high clearance, nonlinear phamacokinetics, and very significant inter-actions with other drugs. In addition they are substrates for p-glycoprotein efflux proteins. These effects are very significant clinically since the drugs may be excluded from certain organs, which provides the virus with a safe
haven[41, 42]from which it may reemerge. The market for
HIV proteases may well accept improved inhibitors with more favorable absorption, distribution, metabo-lism, and elimination (ADME) properties. Agents with improved properties sometimes displace first genera-tion drugs, as was the case for the antihypertensive calcium channel antagonist amlodipine, which largely replaced nifedipine.
The HIV-protease inhibitor DMP323 (7, IC50=
0.031 nm) was discovered by structure-based design
(Scheme 2) and progressed into clinical development. Its development illustrates a number of important and
recurring themes[43, 44]in the progress from a ligand to an
effective drug. The clinical trials of7were terminated
due to poor bioavailability caused by low solubility and metabolic instability associated with the benzyl alcohol groups. An excellent ligand proved to be a suboptimal drug. A second clinical candidate entered development, DMP450
(8), which displayed improved affinity along with better
solubility and good bioavailability in humans. In phase II DMP450 was found to have only modest potency in patients. Dupont–Merck reentered the discovery phase of the project, again utilizing a structure-based approach, but this time including a potency assay in whole plasma. This aimed to address the deficiency of DMP450, which was perceived to be its high plasma protein binding. Plasma protein binding affects all drugs in vivo and largely depends upon lipophilicity
and charge. It modulates the concentration of the drug in free plasma, which drives efficacy. Dupont–Merck's latest clinical
candidates are DMP 850 (9) and DMP851 (10, Scheme 2),
both of which have improved potency in whole blood , as well as increased solubility and bioavailability. The second and third phases of the program were focused upon incorporating druglike properties whilst maintaining ligand potency.
Similar problems were also encountered with Pharmacia–
Upjohn's pyrone sulfonamide inhibitors of HIV protease.[45]
Broad screening of a “diverse” subset identified warfarin as an interesting but weak inhibitor. Similarity searching iden-tified a related compound, phenprocoumon, as a potential
Gerard J. Kleywegt obtained a degree in chemistry from the University of Leiden (The Netherlands) in 1986 and his doctorate from the University of Utrecht in 1991. After a short time with a commercial software company, he moved to Sweden to join Alwyn Jones's protein crystallography labora-tory in Uppsala. He is currently working as an independent investigator at Uppsala Uni-versity, and has been the coordinator of the Swedish Structural Biology Network (SBNet) since its inception in 1994. In 2001 he was awarded a research fellowship by the Royal Swedish Academy of Sciences.
Scheme 1.The peptidomimetic HIV-protease inhibitors nelfinavir (1), saquinavir (2), ritonavir (3), indinavir (4), amprenavir (5), and lopinavir (6).
Scheme 2. The HIV-protease inhibitors DMP323 (7), DMP450 (8), DMP850 (9), and DMP851 (10).
lead. The use of X-ray structural information led to
PNU-103017 (11, Scheme 3), which although a potent HIV-protease
inhibitor with excellent phamacokinetics, failed to demon-strate sufficient cellular activity due to its high plasma protein binding. Again, optimization aimed at reducing plasma protein binding and increasing potency resulted in an
improved clinical candidate, tipranavir (12, Scheme 3).
A second case study is provided by the search for neuraminidase inhibitors. Neuraminidase has been an impor-tant target for antiinfluenza therapy for many years. Mark von Itzstein and his group at Monash University used the program GRID in an attempt to identify binding hotspots in
the active site of neuraminidase to guide compound design.[46]
GRID suggested replacement of the 4-hydroxy group in13by
a basic moiety (Scheme 4). Replacement of the hydroxy by the basic guanidinyl group resulted in a 5000-fold increase in
affinity. This compound, zanamivir (14), was subsequently
developed by GlaxoSmithKline and marketed as the first neuraminidase-based antiinfluenza drug, Relenza.
Zanamivir is a very polar molecule and is dosed topically
to the lung by means of dry-powder inhalation.[47]However,
Gilead Pharmaceuticals were able to obtain sufficient potency without incorporation of either the strongly basic guanidine group or the polar glycerol side chain by
replace-ment of the glycerol chain with a 1-ethylpropoxy group.[48]
This group participates in favorable hydrophobic contacts and induces movements in protein side chains, which result in the formation of an additional salt bridge between Glu 276 and Arg 244. This design process resulted in oseltamivir
carbox-ylate (15), a compound with more moderate polarity and
charge. The zwitterionic parent is unsuitable as an oral drug, but the ethyl ester prodrug allows the compound to be absorbed orally. Oseltamivir is marketed by Hoffman–La Roche as Tamiflu. This was the first oral antiinfluenza drug, and in the first six weeks of sales in the USA Tamiflu took
40 % of the neuraminidase inhibitor market from Relenza.[49]
More balanced polarity, charge, and lipophilicity in Tamiflu resulted in a more acceptable physical property profile and considerable commercial success.
The search for renin inhibitors affords a third case study of the importance of considering ADME properties and the difference between ligands and drugs. Many of the world's pharmaceutical companies have attempted to discover renin inhibitors. The structure of murine renin became available in
1984[50]and that of the human renin in 1989.[51]Before 1989,
structure-based design programs utilized homology models of renin based on the aspartyl peptidases endothiapepsin, penicillopepsin, and rhizopuspepsin. With the availability of high-resolution X-ray structures to guide compound design, it might have been expected that by now this target would have yielded a drug. But all these renin programs failed to discover low-molecular-weight agents. Potent ligands were developed
but not drugs.[52] Further development of the compounds
found was discontinued owing to variable bioavailability and/ or excessive production costs. Availability of detailed struc-tural information had not aided the rational design of potent inhibitors with an acceptable pharmacokinetic profile. How-ever, the pharmaceutical industry has not given up on this target. Recently, researchers at Roche have described
com-pound 16,[53] a renin inhibitor in the nm-range, which was
developed from the HTS hit 17(26mm, Scheme 5). With a
molecular weight of 550 Da compound 16 is one of the
smallest, most druglike ligands to have been discovered and is furthest from the peptidic ligands of the 1990s. Both the lead
and the potent ligand designed from it induce major conformational changes in the renin active site. Interestingly, these changes had not been observed previously, during a decade of X-ray crystallographic study, with peptidic ligands. These observations represent a new starting point for drug design programs. This is clearly not the end of the renin story, and it will be fascinating to see how modern discovery paradigms deal with this old target.
Structure-based design also contributed to the discovery of the carbonic anhydrase II (CA-II) inhibitor dorzolamide
(18, Scheme 6), the first topical treatment for glaucoma.[54, 55]
Based on structural information, the methyl group was introduced into the thienothiopyran ring system, which stabilizes the alkylamino substituent in what would otherwise be the less favorable pseudo-axial conformation. The 4-alkylamino substituent induces a conformational change in the catalytically important residue His 64 causing it to occupy a position that is not observed for ligands bearing an N
Scheme 3. The HIV-protease inhibitors PNU-103017 (11) and tiprana-vir (12).
Scheme 4.Neuraminidase inhibitors.
substituent smaller than ethyl. Introduction and optimization of the alkylamino substituent also enabled the manipulation of lipophilicity and solubility, which are critical factors for ocular penetration and formulation of a topical agent. Oral
sulfonamide diuretics such as acetazolamide (19, Scheme 6)
were used to treat glaucoma some forty years before the
introduction of the topical agent dorzolamide.[56]Inhibition of
carbonic anhydrase systemically has a myriad of consequen-ces, and this limits the utility of oral, nonselective inhibitors. A nonselective agent must be present at very high concentra-tions in the blood in order to saturate carbonic anhydrase I, which is expressed at high levels in red blood cells. Only then can an efficacious level of the free drug be achieved, which results in inhibition of CA-II in the eye. With dorzolamide, because of the high local concentrations that can be achieved by topical treatment, and its selectivity for CA-II, an effica-cious local concentration can be achieved at a 200-fold lower plasma concentration than would be required from an oral dose of acetazolamide. Carbonic anhydrase binding to red blood cells and its selectivity for CA-II totally dominates the
pharmacokinetics of dorzolamide; itst1/2 for elimination is
approximately 120 days.
As might be anticipated, for topical agents the differences between a ligand and a drug are somewhat less. The pharmacodymanic and pharmacokinetic properties of dorzol-amide are totally dominated by its affinity and selectivity for CA-II. In this sense, its properties as a ligand for its receptor have largely determined its success as a drug. This is not typical of drug discovery programs, however, since they are more frequently aimed at therapy through oral administra-tion. More recently, structure-based design has been employed in the discovery of several agents that are now nearing market. For instance inhibitors of human nonpancre-atic secretory phospholipase A2 (hnps-PLA2) have been
obtained starting from the screening hit 20 (Scheme 7).
Large movements of side chains were necessary to accom-modate these inhibitors, and the movements would have been
difficult to predict from the native structure.[57]The structures
of a sequence of increasingly potent inhibitors such as 21
complexed with hnps-PLA2 were determined by X-ray analysis, and overall a 1000-fold improvement in potency
in vitro was obtained. The study has resulted in LY315920 (22,
Scheme 7), which is undergoing phase II clinical evaluation in
inflammatory disease.[58] It will be interesting to see if this
ligand proves to be an effective drug.
These examples illustrate the distinction between ligands and drugs. As these areas are relatively mature, the successes and difficulties can be viewed in the context of the whole journey from the initial concept to a drug in the clinic. The HIV protease, neuraminidase, and renin case studies are instructive when viewed in the light of the current under-standing of druglike properties. The use of protein structural information in ligand optimization often leads to the main-tenance and incorporation of polar interactions while the lipophilic contacts are increased in order to increase potency. However, the combination of these two strategies may not result in compounds with good druglike properties. The use of protein structural information in conjunction with in vitro potency determination may tempt medicinal chemists into designing ligands that are not drugs. High potency is not necessarily the most important requirement for a drug. The importance of ADME properties as well as potency is now recognized in most drug discovery programs. In order to be effective, the concentration of free drug must be maintained at a level at which the binding site on the target protein is significantly occupied throughout the dosing interval. This is a function of dose, clearance, plasma protein binding, intrinsic potency, volume of distribution, and dosing interval. Further-more, an acceptable margin is required between the max-imum concentration achieved at a therapeutic dose and the concentration that produces toxic side effects. The drug's pharmacodynamics and pharmacokinetics must be such that it meets these requirements at the desired dosing frequency.
Limiting the size, charge, and lipophilicity of a ligand in order to fulfill ADME requirements can limit the number of interactions made between the ligand and the residues composing the binding pocket. This limits the affinity that can be derived from interactions at the ligand–protein interface. This problem can be particularly acute where the ligand occupies a large binding site and mimics a large natural substrate, as is the case with many peptidases. The problem can sometimes be solved by using small ligands, which induce structural changes in the protein to fit the ligand. Greater affinity is obtained from a small ligand when it intercepts or induces a conformation of the protein, which produces a complex of lower total free energy. This is often the result of the ligand making favorable hydrophobic interactions with residues made available as a consequence of inherent conformational mobility of the protein.
3.
Limitations in the Use of X-ray Data
A number of common and implicit assumptions are made by chemists who use protein structural data during structure-based design. These need to be high-lighted, since they are often overlooked or even forgotten. First, we briefly define basic crystallography
Scheme 6.Compounds for the treatment of glaucoma.
terms, which aid in the interpretation of X-ray crystal structures. Then we discuss possible pitfalls and caveats in the structure determination, which are important for users of such structures.
3.1.Basic Crystallography Terms
In a crystallographic (X-ray diffraction) experiment, the raw data consists of the positions and intensities of the reflections as measured in the diffraction pattern of the crystal. From these intensities, the structure-factor amplitudes can be calculated (roughly as the square root of the intensities). Once the phases of the structure factors are also known (i.e., once the “phase problem” has been solved), Fourier transformation of the structure factors provides a map, which is a three-dimensional matrix of numbers that
represent the local electron density.[59]Where there are many
electrons (and, hence, heavier atoms) the density is higher than in places where (on average) there are few electrons. It is now the task of the crystallographer to interpret the electron
density in terms of a discrete atomic model.[60]This is typically
an iterative process, in which the crystallographer (or in favorable cases even a computer program) builds a part of the model and then refines this. The refinement program will make small changes to the model by adjusting parameters such as the atomic coordinates, which improve the ability of the model to explain the experimental data. Simultaneously, geometric and other restraints and constraints are enforced onto the model to ensure that it is chemically reasonable. With an improved model, new maps can be calculated that may reveal further details, for example, previously missing or uninterpretable density for loops, ligand, solvent molecules, etc. The crystallographer can then add these. Simultaneously, the crystallographer should be on the lookout for possible
errors in the current model and correct them if possible.[61]
Besides coordinates, atoms in the model typically have a “temperature factor” (also known as B factors or atomic displacement parameters) to model the effects of static and dynamic disorder in the crystal. Except at high resolution
(typically, better than ~1.5 M), where there are sufficient
reflections to warrant refinement of anisotropic temperature factors (requiring six parameters per atom), temperature factors are usually constrained to be isotropic (requiring only one parameter per atom). The isotropic temperature factor of an atom is related to the atom's mean-square displacement. In most cases temperature factors provide a useful relative indication of the reliability of different parts of the model. If they are high, for example, for a lysine side chain, this usually means that little or no electron density was observed for the atoms in that side chain, and that the coordinates are therefore less reliable.
Figure 1 shows the atomic coordinate records of a crystallographically determined structure stored in the
Pro-tein Data Bank (PDB).[62] Figure 1 a gives an example of
crucial information in the REMARK records of PDB entries. Inspection of these notes and of a validation report (e.g., the WHAT IF report on the PDBREPORT web site or the
PROCHECK report on the PDBsum web site) is highly recommended. In this case, the structure of crambin has been determined (PDB entry 1EJG). Crambin exists in two isoforms that differ in two residues (either Pro 22/Leu 25 or Ser 22/Ile 25), and both forms were present in the crystal. The two sequence heterogeneities have been modeled as alter-native conformations for residues 22 and 25, but due to format restrictions, only one sequence is recorded in the sequence records.
Figure 1 b shows a fragment of a PDB file from the same entry. The basic information about the atoms in the model is listed on “cards” (records, lines). These begin with ATOM for protein or nucleic acid components or HETATM for entities that are ligands, ions, metals, and solvent molecules. The second item on each line is simply a sequential index number of that atom. In the first line atom 136 is the amide nitrogen atom (N) of the valine (VAL) residue A8. “A” is the chain name, “8” the residue number. The “A” before the residue symbol “VAL” signifies that this atom is statically disordered. This means that this atom is observed in more than one location in the electron density, and the various instances are labeled “A”, “B”, “C”, etc. Indeed, the third line in the figure contains the alternative location “B” of this atom. The three real numbers that follow the residue number—“6.382, 2.222,
13.070”—are the Cartesian coordinates (x, y, and z) of the
atom in orthogonal M. The fourth number is the occupancy of the position. This is a number between zero and one, which indicates the fraction of the amide nitrogen atom of valine A8 that occurs in this location. Here, the first conformation has been given an occupancy is 0.55, and line 3 shows that the alternative conformation B accounts for the remaining 0.45. Note that quite a few programs that read and process PDB files ignore alternative conformations completely. When the occupancy of ligands and solvent molecules is refined or set to a number less than one, this implies that they occupy the position in only a fraction of the molecules in the crystal, or for only a fraction of the time, or a combination of both. The fifth number, 1.92 in line 1, is the value of the isotropic temperature factor (B factor). Line 2 reveals that this atom has been modeled anisotropically, (this involves six parame-ters per atom which are listed on the ANISOU card), but the isotropic equivalent value is always listed as the fifth real number of the ATOM (or HETATM) card. At the end of each card the atomic symbol of the chemical element of the atom is listed, since this cannot always be deduced unambiguously from the atom's name.
An important parameter in crystallographic studies is the resolution of the data, which is expressed in M, where lower numbers signify higher resolution. The higher the resolution, the more experimental data, and the more reliable (in terms of accuracy and precision) one may expect the resulting
model to be. At high resolution (<1.5 M) the model is
probably more than 95 % a consequence of the observed
data.[63]However, at lower resolution (>2.5 M), the modeling
of details in protein structures is much more subjective than is
widely appreciated.[64]This can be understood by calculating
typical data-to-parameter ratios, that is, the ratio of the number of experimental observations and the number of adjustable parameters (atomic coordinates, parameters
asso-ciated with the temperature factors, and occupancies amongst others) in the model. For an average protein structure at a resolution of 2 M, this ratio is slightly greater than two, but at
~2.7 M it becomes less than unity. Whereas gross errors in the
structure are unlikely to persist to the publication stage if the
resolution is high, once the resolution becomes >2 M, the
balance shifts. Some published protein models appear to have been more determined by the crystallographer's imagination
than by any experimental data.[63]In fact, in the 1980s the first
reports of some of the “hottest” protein crystal structures, some of which were also prime drug targets, contained
extremely serious errors.[65] Examples included HIV-1
pro-tease, photoactive yellow protein, the small subunit of
RuBisCO, d-Ala-d-Ala peptidase, ferredoxin,
metallothio-nein, gene V binding protein, and the GTP-binding domain of Ha-ras p21.
Recently, the structure of a complex between botulinum neurotoxin type B protease and the inhibitor BABIM was
published,[66]and the structure and experimental data were
deposited in the PDB (entry 1FQH). However, subsequent critical analysis of the electron-density maps revealed that these did not support the placement of the inhibitor as stated in the earlier paper, and the structural conclusions based on it
were withdrawn by the authors.[67]
Another trap to be aware of (and one that many crystallographers have fallen into) is the derivation of “high-resolution information” from low-resolution models. For instance, in a typical 3-M structure the uncertainty in the position of the individual atoms can easily be 0.5 M or more. Nevertheless, many such models have been described where hydrogen-bonding distances are listed with a precision (note: not accuracy!) of 0.01 M (probably because the program that generated these distances used that particular precision) and
solvent-accessible surface areas with a precision of 1 M2.
The ability of the model to explain the experimental data
is usually assessed by means of the (conventional) R-value,
which is defined in Equation (1).
R¼ XkFobsjscalejFcalcdk
= XjFobsj
ð1Þ
Here, Fobsd are the experimental structure-factor
ampli-tudes, Fcalcd are the structure-factor amplitudes calculated
from the model, and the sums extend over all observed reflections. However, when more and more parameters are
introduced into the model, theR-value can be made almost
arbitrarily small (this is called “over-fitting the data”). In 1992
BrRnger[68] introduced the concept of cross-validation in
Figure 1. a) An example of crucial information presented on REMARK records in PDB entries. b) Fragment of a PDB file from the same entry. The basic information about the atoms in the model is listed on “cards” (records, lines). For a complete description please refer to the text.
crystallographic refinement, and with it the free R-value
(Rfree), whose definition is identical to that of the
conven-tionalR-value, except that the freeR-value is calculated for a
small subset of reflections that is never used in the refinement
of the model. The freeR-value therefore measures how well
the model predicts experimental observations that are not
used to fit the model. Until a few years ago a conventionalR
-value below 0.25 was generally considered a sign that a model was essentially correct. While this is probably true at high resolution, it was subsequently shown for several intentionally mistraced models that these could be refined to deceptively
low conventionalR-values.[65, 69]BrRnger suggests a threshold
value of 0.40 for the freeR-value, that is, models with freeR
-values greater than 0.40 should be treated with caution.[70, 71]
Since the difference between the conventional and free R
-value is partly a measure of the extent to which the model overfits the data (i.e., some aspects of the model improve the
conventional but not the freeR-value and are therefore likely
to fit noise rather than signal in the data), this difference (Rfree
R) should be small for the final model, ideally<0.05.
3.2.Uncertainty in the Identity or Location of Protein or Ligand Atoms
It is often forgotten that an X-ray crystal structure is one crystallographer's subjective interpretation of an observed electron-density map expressed in terms of an atomic model. This structure is treated by chemists undertaking structure-based design as if it were at perfect resolution, independent of the resolution at which the structure was actually determined and ignoring the interpolations, assumptions, biases, and sometimes mistakes incorporated by the crystallographer.
Uncertainties can involve the identity of important atoms like those in the binding pocket. For instance at a resolution
typical for macromolecules (~2 M) the relative positions of
thedN anddO atoms of asparagine andgN andgO atoms of
glutamine side chains cannot usually be determined directly from the electron density since they are isoelectronic. The decision as to which density feature should be assigned to N and O should be based on inspection of the local hydrogen-bonding networks. However, these decisions may have to be made before solvent molecules have been added to the model and hence be based on incomplete hydrogen-bonding net-works. Moreover, in low-resolution structures many of the solvent entities are not resolved in the electron density and can therefore not be modeled, thereby further complicating the analysis. A careful crystallographer will verify the assign-ment in the final model, but in general the users of the model should treat the final assignment with caution. This is also borne out by large-scale analysis of the hydrogen-bonding patterns involving histidine, glutamine, and asparagine
resi-dues with the program WHAT IF,[72] as listed on the
PDBREPORT web site.[73] This analysis suggests that as
many as one in six of all histidine, asparagine, and glutamine residues in the PDB may have been modeled in a “flipped” orientation.
Uncertainties can also occur at the level of whole residues. This is the case for flexible residues, which often diffract so
weakly that no clear electron density is observed for them. This is quite common for the side chains of surface residues, but may also be found in some active sites, particularly with the flexible side chains of lysine and glutamate. Analysis of
real-space density fits[74] shows that most poorly defined
residues are, in order of improving average fit to the density,
Lys < Glu < Arg, Gln < Asp, Asn. The crystallographer
knows they are present from the amino-acid sequence, and so they are incorporated into the structure in a conformation commonly observed for that residue in databases of high-resolution structures. The final conformation of the side chain, as viewed by the chemist, can be the product of intelligent guesswork and the van der Waals term in the refinement program's force field, rather than experimentally observed electron density. It is also quite common for whole sections of the protein to give little or no observable electron density. Sometimes these parts are mobile loops and these can have great functional significance also, by virtue of this
greater mobility.[75] In other cases, entire domains may be
invisible in the electron-density maps.
Similar ambiguities apply when the bound ligand is considered. For instance, the position of pyridine nitrogen atom cannot usually be determined from the electron density alone. This fact will introduce uncertainty into many crystal structures containing a molecule with an asymmetrically substituted pyridine. For instance, during the study of
benzo[b]thiophene inhibitors of thrombin, compound 23
was complexed and a structure built based on the measured
electron density. The C3 pyridyl ring was oriented arbitrarily so that the nitrogen atom resides in the more hydrophilic of the two possible environments. This is a reasonable assump-tion, but not the result of direct experimental observation and so is still uncertain.
An example of how ambiguous X-ray crystallographic data can be when the exact chemical composition of a ligand or residue is not known was encountered
recently. The exact identity of the twenty-second genetically encoded amino acid
pyrol-lolysine24,[76]present inMethanosarcina
bar-keri monomethylamine methyltransferase
(MtmB), is still unknown even though a 1.55-M resolution structure of the protein is available. The X substituent is a methyl, ammonium, or hydroxy group.
On the other hand, sometimes (careful) crystallography can reveal cases of mistaken
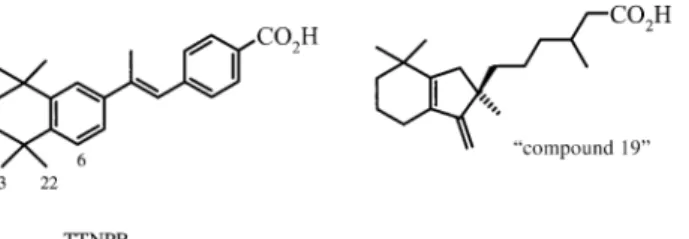
identity. For example, when the structure of cellular retinoic-acid-binding protein type 2 (CRABP2) in complex with a synthetic retinoid was solved, it was assumed that the ligand
was TTNPB (Scheme 8).[77]The ligand was built and fitted to
the density, but the maps stubbornly suggested that there was something wrong. The density failed to cover the whole ligand, and features in the map suggested that there ought to
be a carbon-like atom at a distance of ~1.5 M from C6, and
that atoms C22 and C23 should be removed from the model. After double-checking the identity of the ligand with the chemists, the crystallographers found that the ligand that was actually complexed to the protein was “compound 19” (Scheme 8). The structure of this ligand made perfect sense in terms of the density (Figure 2), and the refinement of the structure could be completed successfully. However, had the resolution been 3 M instead of 2.2 M, the error might well have gone undetected.
Since the presence of hydrogen atoms is inferred rather than observed, the tautomeric state of histidine or of bound ligands containing tautomeric groups cannot be determined directly. The latter problem is rather common in studies involving acid isosteres. Similarly, the state of ionization of the ligand or protein cannot be observed. It is usually assumed that the charged state of the protein is known. However, the
pKavalues of common acidic or basic side chains can differ
drastically from their normal values as measured in water, when they are located in the microenvironment of a protein
active site.[78]Even when the protonation states of key
active-site residues and the ligand are known, these may change upon complexation. Enthalpies of complexation measured by isothermal titration calorimetry, in aqueous buffers with different enthalpies of ionization, established that the Roche
thrombin inhibitor napsagatran (25, Scheme 9) binds to
thrombin incorporating an additional proton.[79]An inhibitor
with a similar structure, CRC220 (26), from Behring binds to
thrombin without an additional proton. This difference in ionization, upon binding to the protein, was supported by different orientations of the ligands when the structures of the complexes with thrombin were determined by X-ray crystal-lography.
3.3.Effect of Crystallization Conditions
The conditions required to crystallize a protein or to optimize diffraction may not be the same as those employed in the biological assay. This may affect the reliability of rationalization and prediction of structure–activity relations (SAR) from sequential protein–ligand complexes. The influ-ence of crystallization conditions is often unknown or not considered, but numerous examples highlight its importance. An unusual cubic form of trypsin was observed when it was
complexed with compound27at pH 7.[80]The same ligand–
protein complex crystallized at pH 8 shows a different ligand
conformation, active-site conformation, and crystal morphol-ogy. Normally the pH during protein crystallization has no effect upon the formation of various crystal forms, but in the
case of27the pH affects the protonation state of the ligand
and thereby alters its binding mode, which in turn precludes the normally observed packing of the protein.
The terminal methylpiperazine ring of Abbott inhibitor
A-70450 (28) was found to exist in a chair conformation in the
crystal structure of secreted aspartic protease 2X crystallized
at pH 4.5.[81]But in a subsequent study the methylpiperazine
group was observed to assume a boat conformation when the
complex was crystallized at pH 6.5.[82]
Scheme 8. Postulated and actual CRABP2 ligand. Scheme 9. Thrombin inhibitors napsagatran (25) and CRC220 (26).
Figure 2. Electron density for and structure of “compound 19” in com-plex with CRABP2.
The recently identified genetically encoded amino acid pyrrolysine adopts two conformations in MtmB. The occu-pancies of the two conformations depend upon whether the precipitating salt was sodium chloride or ammonium
sul-fate.[76]When ammonium sulfate is used as the precipitating
agent, additional density adjacent to C2 of the ring suggests the addition of ammonia from the buffer to the imine of pyrrolysine. The change in occupancy of the two conforma-tions appears to be controlled by new hydrogen bonds formed between this nitrogen atom and Glu259 and Gln333.
Two crystal forms of human pancreatica-amylase were
also observed at different pH values. The flexible loop, which
is typical of mammaliana-amylases, was shown to exist in two
conformations, which suggests that loop closure is pH
sensitive.[83]Likewise, pH-sensitive changes in conformation
have been observed for glycinamide ribonucleotide
trans-formylase,[84] Aspergillus pectin lyase A,[85] glutathione
syn-thetase,[86] influenza matrix protein M1[87] and
ribonucle-ase A.[88]
3.4.Identification and Location of Water Molecules
Identification of water molecules in the electron-density maps can be a problem. Water, sodium ion, and ammonium ion—common constituents in crystallization media—cannot always be distinguished based on their density alone, because they are isoelectronic. The local environment must be taken into account in order to decide how a solvent feature in the electron-density map is best interpreted. Such issues are easily missed, especially by less experienced crystallographers.
The location of water molecules can also be problematic. Unless the resolution is high, the presence or absence of water molecules cannot be determined with certainty, and it becomes a subjective matter whether a feature in the density should be ignored as noise or modeled as a water molecule. However, uncritical addition of solvent molecules (each of
which introduces four adjustable parameters, x, y, and z
coordinates and an isotropic temperature factor, into the model) provides the crystallographer with an excellent means of absorbing problems in both the experimental data and the
atomic model.[63, 69]Addition of water molecules is then simply
used to artificially reduce the differences between observed and calculated structure-factor amplitudes.
When crystallographers determine the same structure at similar resolution, their water structures are bound to reveal many discrepancies. For example, the structure of
transform-ing growth factor-b2 was determined by two independent
laboratories at similar resolutions, 1.8 M (1TGI) and 1.95 M
(1TFG).[89] There are 58 water molecules in 1TGI with an
average temperature factor of 31.8 M2and 84 water molecules
in 1TFG with an average temperature factor of 43.3 M2. In
1TFG the 54 water molecules common also to 1TGI have
much lower temperature factors (average 34 M2) than the
30 extra water molecules (average 60 M2), which suggests that
the latter have a much lower level of reliability. The structure
of human interleukin 1b was determined independently in
four different laboratories at similar resolution.[90]The four
models contained between 83 and 168 water molecules, but a
mere 29 of these were in common to all four models. Interestingly, although all 29 belong to the first layer of solvation, not all of them are buried. In a final example the structure of poplar leaf plastocyanin was subjected to two separate refinements by independent laboratories who used
the same set of synchrotron X-ray data at 1.6 M.[91]The two
groups used two different refinement protocols and agreed not to communicate until each was convinced that their refinement calculations were complete. The structures con-tained 171 and 189 water molecules, respectively, but only 159 water molecules were common to both structures within 1 M. While it can be a matter of subjectivity to decide whether the electron density supports the presence of a water molecule at a particular location, a water molecule that does not form a single hydrogen bond to any other atom is almost certainly an artefact. Statistics from the protein
verification tool WHAT IF,[72] found at the PDBREPORT
web site[73]identify 99 793 water molecules in 10 857 structures
deposited in the PDB that have no hydrogen bonds to any other atom in the structure (September 2002).
It may simply be worth remembering that at the resolution usually encountered in structures in pharmaceut-ical discovery projects, the electron density for water mole-cules that are not well ordered is often difficult to distinguish from noise. The importance of water in binding energetics and kinetics should not be overlooked (although it sometimes is). Water is the “third party” in the ligand–receptor
interac-tion.[92]Depending on the hydrogen-bonding environment of
influential water molecules, it may be energetically favorable for a ligand to displace the water molecule, form a hydrogen bond to it, or not to interact with it. With uncertainties over which water molecules are displaced, and which are not displaced from the active site upon ligand binding, water molecules are often completely removed in virtual screening campaigns. This oversimplification may affect the accuracy of docking and scoring.
4.
PDB Files Used in Docking and Scoring Studies
An important criterion in the choice of protein–ligand complexes used to validate docking and scoring programs is the resolution of the structure. But even at high resolution the ligand may still not be well defined, as recently highlighted by
BostrSm.[93] The structure in PDB entry 1PME was
deter-mined to a resolution of 2.0 M, however the planar meth-anesulfonyl group present in the ligand is chemically unlikely. Similarly, the 3-phenylpropylamine ligand in structure 1TNK, which was determined to a resolution of 1.8 M, contains a tetrahedral aromatic carbon atom bound to the propylamine chain. Visual inspection would reject these structures, so it is surprising that 1TNK also features in the validation set for Flex-X. One lesson is that whereas high-quality dictionaries of acceptable bond lengths, angles, and torsions are available for amino and nucleic acids in model refinement, the same is not true for complexed ligands. This is because of the huge diversity of small molecules compared to amino and nucleic acids. The Hetero-Compound Information Centre, Uppsala,
commonly used crystallographic protein modeling software (CNS, X-PLOR, TNT, and O) as an aid to
crystallogra-phers.[95] A similar service is provided by the PRODRG
server.[96]Also accessible through the HIC-Up site is a basic
validation tool, HETZE, which checks the PDB file of a ligand for acceptable ranges of bond lengths, angles, and torsions.
Sometimes complexes are selected as docking targets, even though the experimental evidence is not sufficiently strong for an unequivocal decision on the ligand orientation. For instance, the position of the carboxylate group of oleic acid in a mutant rat intestinal fatty acid binding protein (IFABP) was ambiguous when the electron density was
examined.[97] Indeed, the crystallographers report three
positions for the carboxylate group in the deposited PDB
file (1ICN), with occupancies of approximately 0.3 for each.
Surprisingly, this complex, despite its uncertain structure, was selected as a validation structure when Flex-X was tested with
the DOCKSCORE scoring function[14]and GOLD. In
hind-sight then, it may not be surprising that Flex-X and GOLD failed to reproduce any of the observed conformations of oleic acid. Flex-X calculated that the highest scoring
con-formation for oleic acid is rotated 1808 in the active site
relative to the orientation reported in the PDB file. It was
suggested that the original crystallographic assignment for the position of oleic acid was incorrect and that the orientation predicted by Flex-X was in better agreement with the electron density. However, limited rerefinement of the model from which the carboxylate groups were removed, against the original experimental data, but with current methodology reveals no clear density for the carboxylate group at either end of the ligand (Figure 3 a–c). Normally, in this family of proteins, two arginine residues are involved in binding the carboxylate group of the ligand. Wild-type IFABP is already the odd one out in the family, since one of the arginine residues is involved in a salt bridge with an aspartate residue. In the present structure the remaining arginine was mutated to glutamine, and therefore it seems unlikely that there is any driving force to cajole the carboxylate group of the fatty acid into entering the interior cavity of the protein. Instead, it seems more likely that the carboxylate group sticks out into the solvent. Such a binding mode has been observed in the
crystal structure of another fatty-acid-binding protein.[98]
Moreover, subsequent NMR experiments by Jackoby et al.
on the mutant complex[99]showed that the carboxylate group
of the ligand is exposed to solvent.
Recently, the Cambridge Crystallographic Data Centre and Astex Technology Ltd have produced a “clean” list of protein–ligand complexes for validating docking and scoring
algorithmns.[100] All entries in the “clean” list have been
checked manually to exclude protein–ligand complexes that contain factual or structural errors in the PDB file, unlikely ligand conformations, and severe protein–ligand clashes, as well as those complexes in which the crystallographically related protein chains influence the binding geometry.
5.
Assessing the Validity of Structure Models
In view of the uncertainties concerning the validity of X-ray structures deposited in the PDB, about which even experts disagree, the average user does well to proceed with caution. The degree of confidence in the position of a particular atom or residue can be assessed by using the temperature factors, occupancies, and occasionally remarks, all of which are deposited with the atomic coordinates. If the structure factors are also deposited, electron-density maps can be calculated and superimposed on the structure. Examination of the structure together with the electron-density map is highly
recommended.[101]This enables users of the refined model to
assess the quality of the fit of the model to the density (data). Issues that can be addressed include the overall reliability of the model, together with the position, orientation, conforma-tion, and geometry of specific residues and ligands. This level of detailed visualization is generally only available in special-ist crystallographic modeling tools such as O, but the program DEEP VIEW, which is freely available on the internet allows full visualization of PDB files together with electron-density
maps.[102]It is not always possible to inspect the density, since
this requires that the structure factor data have been deposited with the PDB by the crystallographer. Although most journals now have strict deposition policies, a recent
Figure 3. a) Oleic acid complexed to an IFABP mutant after limited refinement (data not shown). Although some extraneous electron den-sity (blue mesh) is visible, it is neither possible nor sensible to assign it to the ligand's carboxylate moiety. b) Electron density near the oppo-site end of the ligand. It is clear that there is no density to support either the presence of the carboxylate group or any contacts with main-chain amides. This view is from outside the protein into the ligand-binding cavity. c) Electron density at the other end of the ligand model shows that the ligand points into the solvent. Most likely the carboxylate group is located here, but due to disorder there is no density for it.
survey found that for only ~30 % of all crystal structures in the PDB could electron-density maps be
calculated.[103] Interestingly, it
appears that more structure fac-tors are deposited for structures with low than for those with high
freeR-values. This curious
obser-vation suggests that the worse the model is, the less likely it is that the crystallographer will deposit the experimental data that the structure is supposed to explain. Jones and co-workers have devel-oped the Uppsala Electron
Den-sity Server[104]to facilitate
objec-tive assessment of the quality of the fit of the model to the electron density of any PDB entry for which structure factors are avail-able.[74]
Before expending considerable resources on the exploi-tation of a protein–ligand structure, medicinal chemists and protein modelers would do well to assess the overall reliability of the model. An introductory tutorial for nonexperts is
available on the internet.[63, 105] Subsequently, researchers
should assess the reliability of any crucial residues, water molecules, and bound ligands, either by interacting directly with the crystallographer who determined the structure or by reading the literature. Scrutiny of the REMARK records in the PDB entry and inspection of the temperature factors and occupancies is recommended. Treating a PDB entry as a simple array of atom coordinates at perfect resolution is a gross oversimplification and can easily lead to false assump-tions concerning the model.
Two examples, from many which might be chosen, illustrate the point. Two molecules of 1-deoxynojirimycin were observed bound in the active site of glucoamylase from
Aspergillus awamori varX100 in a structure determined at
2.4-M resolution.[106]One of the ligands shows strong electron
density, whereas the second molecule appears to occupy the second binding site only partially. The authors comment that the “secondary binding site for 1-deoxynorjirimycin should be regarded with caution and may not reflect the true binding of the substrate to the second subsite”. With such uncertainty a medicinal chemist might expect that the second site would be left empty in the deposited coordinate file. In fact, the PDB entry contains both 1-deoxynojirimycin molecules, albeit that the second one is flagged in a way that makes perfect sense to crystallographers, but which inexpert users of the structure files are almost bound to overlook. The choice of whether to include partially occupied binding sites or multiple side chain conformations is largely arbitrary. For instance, disorder was observed for both the nitrite ligand and an active site
asparagine residue in the mutant Asp98Asn form of
Alcali-genes faecalis S-6 nitrite reductase,[107] in a structure
deter-mined at 2.0-M resolution (Figure 4). Although the electron density clearly shows two binding conformations for Asn98, this time only one conformation is reported in the PDB entry.
Confidence in a model can be gained when multiple, independently determined protein–ligand complexes are available, at very good resolution, and when the electron-density maps are inspected closely. Important factors can then be assessed such as the position of influential water
mole-cules,[108]the degree of flexibility in residues neighboring the
active site, and assumptions that may influence the success of structure-based design and docking studies.
Assumptions crystallographers make in modeling the electron density may appear minor when one considers the correctness of an entire ligand–protein structure. However, these assumptions can have a profound effect when the structure is used subsequently as the basis for a structure-based design project. While some of these problems are
minimized at high resolution (<1.5 M), many structure-based
design projects routinely rely on protein structures deter-mined at significantly lower resolutions than this. The structure generated from the electron density may be good. In any one target or ligand series, protein flexibility may be unimportant. It is possible that sensible decisions about influential water molecules can be made. The binding site may be wholly contained within a single copy of the protein and therefore little influenced by other copies of the protein in the unit cell. Therefore there may be many situations in which current manual design and docking and scoring programs have utility. However, great care should be exercised and assumptions in the structure should be assessed continuously.
6.
Automated Docking and Scoring
Successful structure-based design requires accurate and reliable docking algorithms and the ability to predict the affinity of the docked ligand for the target structure. Many of
the standard packages have been reviewed recently
(Table 1).[39] The most widely used programs at present are
probably DOCK, Flex-X, and GOLD. GOLD is arguably the most rigorously validated docking algorithm presently
avail-Figure 4.Active sites of the oxidized and reduced forms of a nitrite reductase. The electron density associated with Asn98 (brown mesh) is only partly filled, consistent with multiple conformations for this residue. Similarly the poor fit around the bound nitrite group indicates disorder (repro-duced from ref. [107] with permission).
able. It utilizes an algorithm that allows full ligand flexibility during docking, while protein flexibility is limited to very small movements in the protein active site, for instance rotation of OH groups to allow for optimal H-bonding. The GOLD web site includes some examples of successful docking, including that of a peptide ligand into actinidin and of GMP into ribonuclease T1. Its web site also provides access to overlays of all the docked ligands from the validation set with the deposited conformation taken from
the PDB file.[109]Indeed one of its most attractive features is
the rigorous and self-critical validation of the program. The GOLD validation methodology is typical of docking and scoring evaluations. It is based on redocking calculations where the ligand is docked back into its own receptor pocket. This is not representative of the actual design process, however, where a single or at best a small number of protein structures are utilized to dock many ligands. The test is also somewhat artificial in that the protein conformation is predetermined, the approximate binding site indicated, and various assumptions made concerning the ionization state of individual residues. A recent survey of the success of redocking using the PROLEADS program has succinctly highlighted the deficiency of redocking as an objective way of
assessing a new docking algorithm.[110]Six or more protein–
ligand complexes were taken for a single target. Although PROLEADS was successful 76 % of the time at redocking individual ligands into their own active sites, it was successful only 45 % of the time in docking another ligand from the set to that same active site. Small, apparently insignificant, changes in the protein structure around the ligands are enough to adversely affect the chances of successful docking. The study was carried out for ligands of the proteins thrombin, thermolysin, and neuraminidase.
Successful ligand design also requires accurate scoring of a molecule's potency. Scoring allows the ranking of multiple docked conformations and/or the prediction of binding energy. Scoring of docked conformations is recognized as a major weakness in current algorithms. While it would be anticipated that scoring functions do rather well at predicting the potency of complexes that were used in the derivation/ training set for that scoring function, the most objective assessment of performance is how well they predict new complexes. Three commonly used scoring methods are master equations, knowledge-based functions, and trainable func-tions.
Approaches based on master equations are implemented in a number of leading algorithms, of which the LUDI scoring function was the first and most widely imitated. The total binding energy is partitioned into contributions from hydro-phobic, hydrogen-bonding, and charge interactions, correc-tions for suboptimal hydrogen-bond geometry, and the energetic cost of the degrees of freedom for bond rotation lost upon binding. The coefficients of the LUDI master equation SCORE1 were determined initially by regression analysis of the interactions observed by X-ray structure determination of 45 ligand–protein complexes together with the affinities of each ligand for its cognate receptor. These are in good agreement with independent assessments of the contributions to binding obtained from thermodynamic
measurements. For instance, the contribution of hydrophobic
interactions is scored at 0.17 kJA2mol1, which is in good
agreement with estimates of 0.12 kJA2mol1 from
solvent-partitioning measurements and detailed SAR studies.[111, 112]
The contributions of hydrogen bonds are scored at
4.7 kJ mol1 per hydrogen bond. This value is also in
reasonable agreement with estimates of up to 6.3 kJ mol1
derived from detailed study of tyrosyl t-RNA synthase, a
value of 2–6 kJ mol1 from physical-organic studies on
vancomycin,[113] and SAR studies on sugars binding to
glycogen phosphorylase.[114]
Knowledge-based approaches (SmoG,[15]
DRUG-SCORE,[14]and PMF[115]) are currently receiving considerable
interest. Knowledge-based potentials are derived from eval-uations of close contacts between atoms in a large selection of protein–ligand complexes by means of statistical mechanics. Binding energy is represented as the sum of free energies of interatomic ligand–protein contacts, which are calculated from their frequencies of occurrence in the complexes. The knowledge-based approach implemented in SmoG2001 gave a root-mean-square error (RMSE) of 1.69 log units in pre-dicting the potency of a test set of 77 complexes. The authors compared SmoG2001 with SCORE1 (LUDI) by using the same test set and found that SCORE1 (LUDI) gave an RMSE of 3.47 log units, which suggests that SmoG2001 is a considerable improvement upon SCORE1 in prediction.
One drawback of master-equation or knowledge-based approaches is that the relative contribution of different types of interactions to ligand affinity may change between families of active sites, because of differences in hydration or polarity
within the active site.[116] However, the scoring function for
VALIDATE can be trained on the series of interest in
contrast to a generic scoring function.[117]A large number of
ligand–protein complexes, covering a sufficient range of potencies, are required, since the approach is based on QSAR methods. Physicochemical descriptors are calculated for the ligand and the ligand–protein complex and are correlated against affinity in order to generate empirical predictive models. Thus, VALIDATE was trained by using 39 HIV-protease inhibitor complexes having a potency range of
pKi=6.4–11.4.[118]This HIV-protease VALIDATE model was
then used to predict the binding constants of 363 HIV-protease inhibitors reported in the literature. Actual versus predicted affinities for the validation set are given in Figure 5. The current performance of scoring functions such as LUDI, SmoG2001, and VALIDATE in predicting potency is usually insufficient to be useful in optimizing leads. Here the
aim is usually to convert a lead having 1–10mmactivity into a
potential development candidate having 1–10 nm activity.
This 100- to 1000-fold increase in potency appears to be within the random error of these scoring functions. However, this is not universally the case. One successful example where scoring was applied in lead optimization was in the design of
peptidic HIV-protease inhibitors at Merck.[119] The scoring
was calculated based on consideration of the electrostatic and steric interaction energies after energy minimization of the
docked ligand (22) in the protein active site. Although the
absolute prediction of potency depended upon which protein structure was used for the dockings, the correlation between
predicted potency and actual potency was remarkably good, as were predictions on novel compounds, which were subsequently synthesized.
A further major assumption underlying the use of docking and scoring programs is that the receptor is not flexible, or at least that receptor flexibility is an infrequent occurrence. This assumption has been questioned recently, and a number of examples of induced fit and protein flexibility have been
reviewed.[120]Indeed, induced fit appears common for
drug-like compounds rather than being an infrequent
occur-rence.[121]The incorporation of protein flexibility into
auto-mated docking and scoring algorithms is presently an important focus. Several approaches are being taken to try to address this problem, with various degrees of rigor. These include the use of a “soft” scoring function, which allows some overlap between the ligand and the protein, protein-ensemble approaches in which the protein is represented as a composite of a number of different conformations, and constrained molecular dynamics simulations in explicit
water.[122–124]
It is sometimes possible to overcome the uncertainties in the scoring functions by using them to design combinatorial arrays of putative ligands rather than individual compounds. For instance, Multiple Copy Simultaneous Search (MCSS) was used to identify subsites within the picornaviral capsid
ligand-binding site.[125] This information was applied to the
design of targeted libraries and hits obtained. Interestingly, because of induced fit, the position of one of the ligands was reproduced only when protein side chains were allowed to move. The authors comment that the advantage of libraries over individual compounds is that the scoring function for selecting ligands need not be highly accurate. The scoring function is required only to have enough information to guide and focus libraries. Even though small changes in protein structure do occur upon ligand binding, a combinatorial approach ensured that the appropriate ligands were synthe-sized anyway. Combinatorial chemistry and structure-based design were combined to provide a useful tool.
7.
Convergence of Screening and Structure-Based
Design
Many drug discovery programs demonstrate an important complementarity between HTS and structure-based design. HTS often yields many weak leads, and chemists make intuitive decisions about which leads to follow. Structural studies can dramatically influence the priority placed upon a particular hit.
Obtaining structural information on chemically diverse leads can reveal hitherto unsuspected mobility in active-site residues. These observations can provide new insights and opportunities for optimization. Combinatorial chemistry can be used to probe areas of the binding pocket in the search for new interactions. For instance, MMP3 inhibitors have been
developed[126] by replacement of the N-methylacetamido
group in29by phenyl (Scheme 10). This unexpected
replace-ment was discovered by applying combinatorial chemistry and subsequently explained by X-ray crystallography. Struc-tural information on the induced binding site prompted further rounds of design and evaluation, leading to
replace-ment of thep-methoxyphenyl group by pyridyl (30).
The design criteria for an ideal HTS compound library have been shifting from mere diversity towards “druglike”
properties and even further towards “leadlike” libraries[127, 128]
and compound collections. The lead optimization process tends to result in compounds with increased molecular weight
and complexity,[129]and this has resulted in an intense search
for methods to identify small leadlike templates. NMR spectroscopy and X-ray crystallography may be superior to HTS for identifying small ligands since low-molecular-weight ligands may not contain enough functionality to demonstrate significant inhibition at the concentrations typically used in
HTS. The VERTEX SHAPES,[25] Fesik's SAR-by-NMR,[24]
and high-throughput crystallography approaches,[26, 27] are
being utilized increasingly to find small binding motifs with
activities in the mm-tomm-range that can be effective starting
points. This strategy also allows for the rapid design of new hybrid structures. Surprising observations are often made concerning binding orientations of ligands and the mobility of binding site residues.
The additivity of substrate fragments in an enzyme–ligand binding site was demonstrated with thymidylate synthase complexed with fragments of deoxyuridine monophosphate,
31–35 (Scheme 11).[130] The complexes show considerable
fidelity of binding orientation, which suggests a modular approach to ligand design by utilizing small molecular fragments. The advantage of NMR spectroscopic and crys-tallographic techniques is that fragments which bind in the
Figure 5. A plot of observed pKivalues versus values predicted by
IDATE II for a test set of HIV-protease inhibitors not used to train VAL-IDATE II. The line of unity is displayed. The box indicates the 1000-fold potency range in which lead-optimization projects typically operate (reproduced from ref. [118] with permission).