Sudan Engineering Society Journal, September 2008, Volume 54 No.51 1
MAINTENANCE IMPROVEMENT USING
COMPUTERIZED MAINTENANCE MANAGEMENT
SYSTEM
Sayed Haroun¹and Elamin Elhussein²
¹Engineering Department, Sudan Currency Printing Press, Khartoum, Sudan
²Karary University, P.O. Box 12304, Khartoum, Sudan,
[email protected]Sudan.
Received Feb. 2008, accepted after revision May. 2008
ﺺَـﻠـْﺨَﺘــْﺴـُﻣ ﺔﻠﻤﻌﻠﻟ نادﻮﺴﻟا ﻊﺑﺎﻄﻣ ﺔآﺮﺷ ﺮﺒﺘﻌﺗ ﺮﺒآأ ﻦﻣ ﻟا ﻄﻤ ﺎ ﻊﺑ نادﻮﺴﻟا ﻰﻓ ، ﻤﻟا ﺔﻋﺎﺒﻄﻟا لﺎﻤﻋﺄﺑ مﻮﻘﺗ ﺚﻴﺣ ﺆ ﺔﻨﻣ ﺔﻳرﺎﺠﺘﻟاو . ًﺎﺳﺎﺳأ ﺪﻤﺘﻌﺗو ﺔﻳﺪﻴﻠﻘﺗ ﺔﻘﻳﺮﻄﺑ ﺔآﺮﺸﻟا ﻩﺬﻬﺑ ﺔﻧﺎﻴﺼﻟا لﺎﻤﻋأ راﺪﺗ ﺮﻳرﺎﻘﺘﻟا مﺎﻈﻧ ﻰﻠﻋ . ﺘﻧو ﻴ ﻚﻟﺬﻟ ﺔﺠ ﻚﻟﺬآو تﺎﻨﻴآﺎﻤﻟا لﺎﻄﻋأ ﺔﺠﻟﺎﻌﻣ ﻰﻓ ﺮﻴﺧﺄﺗ ثﺪﺤﻳ ﻰﻓ ﺔﺑﻮﻌﺻ كﺎﻨه تﺎﻴﻠﻤﻋ ﻞﻴﻠﺤﺗ تﺎﻣﻮﻠﻌﻤﻟا و ا تاراﺮﻘﻟا ذﺎﺨﺗ ﺮﻤﺘﺴﻤﻟا ﺮﻳﻮﻄﺘﻟاﺔﻴﻠﻤﻋ ﻰﻠﻋمﺎﻈﻨﻟا اﺬهﺪﻋﺎﺴﻳﻻﻚﻟﺬآو ﺔﺤﻴﺤﺼﻟا . مﺎﻈﻧ ﻖﻴﺒﻄﺗو ﻢﻴﻤﺼﺗ ﻢﺗ ﺔﻠﻜﺸﻤﻟا ﻩﺬه ﻞﺤﻟو إ لﺎﻤﻌﺘﺳﻻ ﺔﻓﺎﺿﻻﺎﺑ ﻰﻠﻋﺎﻔﺗ مﺎﻈﻧ ﻮهو بﻮﺳﺎﺤﻟﺎﺑ ﺔﻧﺎﻴﺼﻟا ةراد ﺔﻧﺎﻴﺼﻟا ﻞآﺎﺸﻣ ﻞﺤﻟ ﺔﺜﻳﺪﺤﻟا تﺎﻧﺎﻘﺘﻟاو قﺮﻄﻟا . ﺘﻧ اﺮﺷﺆﻣ ﺖﻨﺴﺤﺗ ﻚﻟﺬﻟ ﺔﺠﻴ ﻷا سﺎﻴﻗ ت ﺔﻧﺎﻴﺼﻟا لﺎﻤﻋﻷ ءاد و ﺔﻇﻮﺤﻠﻣةرﻮﺼﺑﺔﻧﺎﻴﺼﻟا لﺎﻤﻋأﻰﻠﻋفﺮﺼﻟاﺾﻔﺨﻧا . ABSTRACT
Sudan Currency Printing Press is a large and strategic company; it works in the field of security and commercial printing. The maintenance is managed and operated traditionally and depends mainly on reporting system. As a result there are delays and difficulties in tracing work orders and decision making. Also the system offers little chance for improvement.
To solve this problem a locally designed computerized maintenance management system (CMMS) is applied together with modern maintenance techniques. As a result key performance indicators (KPI) are enhanced and reductions in maintenance costs are achieved.
Keywords: CMMS, KPI, Machines, maintenance, management, production.
1. INTRODUCTION
For a company to have a good CMMS it must have a good MMS (maintenance management system). In this research modern methods and techniques for maintenance management were selected and applied with a CMMS as a platform for data analysis. Maintenance can be defined as these activities required for keeping a facility in as-built condition so that it continues to give its required benefit or the original productive capacity. The job of the maintenance
function in industry is to ensure that the production plant and equipment should be available for production at scheduled hours with minimum waste and cost, and to secure the safety of man and machine. [1].
2. Analysis of Strength Weakness Opportunities and Threads (SWOT)
a. Strength
The company has positive response to technical changes; old machines were replaced by hi-tech ones; which have
Sudan Engineering Society Journal, September 2008, Volume 54 No.51 less down time, high speed, and high
product quality. Also the company offers training chances on those machines for engineers and technicians.
b. Weakness
Weakness is due to lack of qualified local agents; who can supply urgent spare parts and offer technical support when required.
c. Opportunities
Print turnover closely linked to Gross domestic product (GDP), in Sudan growing steadily during the recent years [2].
d. Threads
There are shortages in the educated and skilled labors as there are no institutes for printing studies.
3. CURRENT STATE
In Sudan Currency Printing Press there are more than three hundred and fifty machines. At present the maintenance of these machines is managed by gathering the information as documents in a computer and on papers; it is found difficult to depend on paperwork to make good tracing of work orders, execute an efficient active and proactive maintenance. Also it is a very difficult job to turn this information into a useful data for analysis to improve down time, lower maintenance costs and increase asset life.
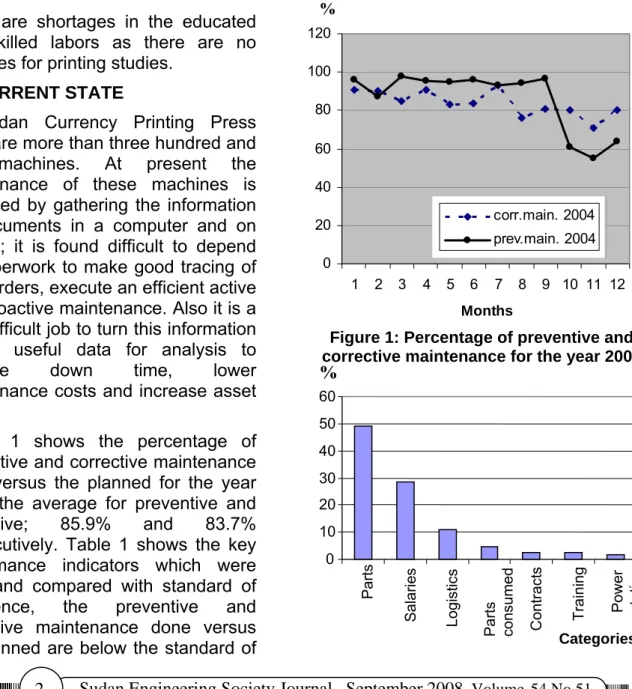
Figure 1 shows the percentage of preventive and corrective maintenance done versus the planned for the year 2004, the average for preventive and corrective; 85.9% and 83.7% consecutively. Table 1 shows the key performance indicators which were used and compared with standard of excellence, the preventive and corrective maintenance done versus the planned are below the standard of
excellence as well as turnover of spare parts, also the key performance indicators used are not enough to give the true picture of the maintenance performance, so more performance indicators have to be used and much effort need to be spent for the preventive and corrective maintenance. Also analysis of failures
has to be intensified to narrow the gap between the actual performance attained and the standard of excellence.
Optimization of the cost of maintenance is very important, Figure 2 shows the budget for year 2004, from the figure its found that 51% of
0 20 40 60 80 100 120 1 2 3 4 5 6 7 8 9 10 11 12 Months %
Figure 1: Percentage of preventive and corrective maintenance for the year 2004
corr.main. 2004 prev.main. 2004 Parts Salaries Logi stics Contract s Traini ng 0 10 20 30 40 50 60 Parts con sum ed Power stat ion Categories % 2
Sudan Engineering Society Journal, September 2008, Volume 54 No.51 3
Figure 2: Budget for the year 2004
Table 1: Key performance indicators for the year 2004
S.N. Performance indicator Achieved
Indicators
Standard of Excellence[3]
1 Preventive maintenance done versus planned 85.9% 100%
2 Reactive maintenance done versus planned 83.75% 100%
3 Ratio of maintenance cost to total added value 8.5% 5 to 15%
4 Turnover for spare parts 3.3% 50%
the budget was spend on purchasing spare parts which is very high and require attention, this causes unnecessary accumulation of spare parts in the stores and loss of money, it needs to be optimized. However ratio of maintenance cost to total added value is within the range.
4. SUGGESTED SOLUTION 4.1 Roadmap
For improving the maintenance work a road map has been suggested which consist of the following three concepts; 1. Workable solutions were selected from the modern maintenance methods and techniques and applied for improving the maintenance performance namely; Conditioned based monitoring maintenance, Total productive maintenance; Reliability centered maintenance, and Total quality management.
2. Any measurable and benchmarked factor can be improved; so more measuring performance indicators were used in this research to measure the maintenance performance, and then benchmarked to compare between the internal performance and the external standards of excellence, for continuous improvement and to achieve international standards. Measuring performance indicators
used are; Availability of machines, Reliability, Maintainability…
3. The benefits of computerization has become available to many areas of the industry, one of them is the
Computerized Maintenance Management System (CMMS); which
is a complete information management system used for maintenance management; here a CMMS was developed and designed according to the requirement of the company. It enables the user to automate work orders, schedule preventive tasks and trace work orders, spare parts and employees. Also it is a powerful tool for data analysis and calculation of performance indicators.
4.2 Modern methods and techniques
A computerized maintenance manage-ment system is not a goal by itself, but it is rather a powerful tool for the analysis of data. So applying modern strategies and techniques in maintenance management with CMMS will help in cutting corners and getting correct information of maintenance problems and simplify data analysis. 4.3 Maintenance methods
Methods applied for maintenance are preventive, corrective and condition based monitoring. The last one is very effective for the optimization of the
Sudan Engineering Society Journal, September 2008, Volume 54 No.51 preventive and corrective
maintenance; because in Condition based monitoring (CBM) the maintenance decisions taken based on the current condition of the equipment, thus avoiding unnecessary maintenance, and maintenance activities performed only when needed to avoid failures. CBM relies on condition monitoring techniques such as oil analysis, vibration analysis and photo thermal imaging, human senses and other diagnostic techniques for taking maintenance decisions.
4.4 Maintenance techniques
In the sector of industry there are several techniques used to enhance maintenance performance; the objective is to achieve continuous improvement; here are some techniques selected and applied in this research:
a. Reliability centered maintenance (RCM).
RCM is a process used to analyze faults on equipment to find ways to prevent them by applying proactive and reactive maintenance or changing the design of equipment.
According to the RCM a list of all physical assets owned by the company was prepared and stored in the CMMS, and then high and low priority machines were classified to the CMMS, the high priority machines affect production or cause hazards for man or machine, are sixty machines, and given high priority in maintenance. Measuring performance indicators for these machines or any other machine can be obtained automatically for any period of time by the CMMS. Then analysis can be made for machines which have low performance.
b. Total productive Maintenance The goal of the TPM is to markedly increase production; this can be
achieved by increasing employee morale, job satisfaction, and creating sense of ownership, changing the work place and equipment performance, use of small groups for identifying the cause of failures in equipment to do modifications. In TPM more empowerment given to the employees for example operators not only limit themselves to the operation of the machine, they clean, inspect lubricate, also they are responsible for the quality of the products. This technique for operator involving maintenance and use of small groups for identifying the cause of failures were applied and they were found very useful.
c. Total Quality Management (TQM) Total Quality Management (TQM) is a way of planning, organizing and understanding each activity or process and of removing all the wasted effort, energy and material that is routinely wasted in organizations. The organization has to focus on prevention of problems. The company implemented this technique in 2005; it is very useful technique especially in the documentation of the procedures of maintenance work.
d. Computerized Maintenance Management system (CMMS)
A Computerized maintenance management system (CMMS) is a software package, designed to manage maintenance of machines, systems, plants, business buildings. CMMS software enables the user to automate work orders, schedule preventive tasks and track work orders, spare parts and employees. It is a powerful tool for data collection, analysis and decision making.
To have a successful CMMS the following has been done; a CMMS designed according to the requirement
Sudan Engineering Society Journal, September 2008, Volume 54 No.51 5 of the company; the system
database has the following information;
1. All assets in the company and their specifications, locations and their criticalities.
2. Human resources in engineering department, their titles and addresses.
3. The system is able to do the following; scheduling of preventive maintenance. Availability of work orders for corrective and condition based monitoring.
4. Capturing of work performed on assets; type of maintenance, description of the work, spare parts consumed, downtime, employee who did it.
5. It calculates many key performance indicators like; availability, reliability, percentage of preventive maintenance done,…
6. Provide summery reports for all work done on assets.
Figure 3: shows flow of information in the CMMS software package.
5. RESULTS AND ANALYSIS
Figure 4 Shows downtime for 28 key machines for year 2006, according to Pareto analysis 80% of the benefits are often realized by addressing 20% of the problems. In Figure 4 there are two machines having long downtime, reasons; for machine No.1 the response for technical support was not quick. Machine No.2 was old, later replaced by a new one. Machine number 4 and 5 there was a delay in the delivery of spare parts from the suppliers. After two years of implementation of Reliability centered maintenance, Total productive
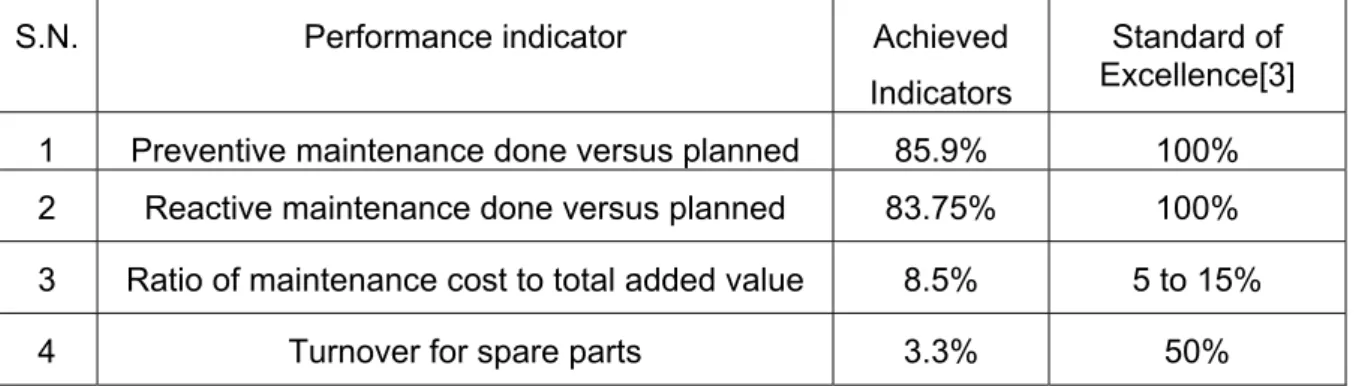
maintenance, Total quality management and the CMMS and by using more KPIs the following enhancement were achieved for the sixty key machines. Figure 5 shows the percentage of corrective maintenance done versus planned; the average in year 2004 was 83.75% in year 2005 and 2006 was improved to 95.5% and 96.3% consecutively.
In Figure 6 the average value for the availability in the years 2006 and 2007 improved to 94.9% and 95.5% consecutively. History Reports Preventive maintenance Inspective maintenance Corrective maintenance M/C Consumed spare parts Employees Work orders
Figure 3: Flow of information in the CMMS
Figure 4: Downtime for 28 key machines for the year 2006
0 200 400 600 800 1000 1200 1400 1600 1 3 5 7 9 11 13 15 17 19 21 23 25 27 Machines Hours
Sudan Engineering Society Journal, September 2008, Volume 54 No.51 Mathematically, the AF of a signal s(t)
Figure 7: Maintainability
In Figure 7 the average value for the maintainability in year the 2005 was 20 H/B, in 2006 and 2007 reduced to 10 and 9.6 H/B.
In Figure 8 the average value for reliability in the year 2005 was 329 H/B in the years 2006 and 2007 has been improved to 998 and 907 H/B.
Figure 9 shows the budgets for the year 2004 compared to the years 2005 and 2006; it is noticed that the first three columns represent spare parts purchased which the costly item, it has been reduced every year, in the year 2005 reduced by 55% in the year 2005 reduced by 39.5%, and the Key performance indicators has been improved in the same years.
0 20 40 60 80 100 120 1 2 3 4 5 6 7 8 9 10 11 12 Months Year 2004 Year 2005 Year 2006
Figure 5: Percentage of corrective maintenance done versus planned,
the years 2004, 2005, 2006
%
0 2 4 6 8 10 12 14 16 18 1 2 3 4 5 6 7 8 9 10 11 12 Months 75 80 85 90 95 100 1 2 3 4 5 6 7 8 9 10 11 12 Months Figure 6: Availability Year 2006 Year 2007 0 200 400 600 800 1000 1200 1400 1600 1 2 3 4 5 6 7 8 9 10 11 12 Months H o u r/ B reakd o w n Year 2006 Year 2007 Figure 8: Reliability Year 2006 Year 2007 H ou r/ Br eak dow nFigure 9: Budget for the years 2004, 2005, 2006 0 10 20 30 40 50 60 year 2004 year 2005 year 2006 % Powe r station Maintenance contr acts Parts consumed Training Logistics Salaries Parts purchased Categories 60 50 40 30 20 10 0 year 2004 year 2005 year 2006
%
6Sudan Engineering Society Journal, September 2008, Volume 54 No.51 7 the other categories in the budget
have been increased slightly like the salaries and the whole budget for the same years has been reduced; in the year 2005 reduced by 11.5% and in the year 2006 reduced by 12.9%.
After the implementation of three years for the above mention methods and techniques the following was achieved;
• Availability during the last three years not less 94%.
• Reliability enhanced by 300%.
• Maintainability enhanced by 50%. Purchasing of spare parts reduced by 55% in year 2005 and in year 2006 reduced by 39.4%.
• One of the main pillars for increasing profit is availability of the machines; gross profit increased every year compared to the year before; in year 2005; increased by 41%, in 2006 increased by 30 %.
• The CMMS now running with the server, it needs to be changed to web-based to be more stable and can be accessed from any internet connection.
• Turnover for spare parts is very low in spite that spare parts purchased reduced every year.
• The cost of the research compared to the savings and profit gained is less than 1%.
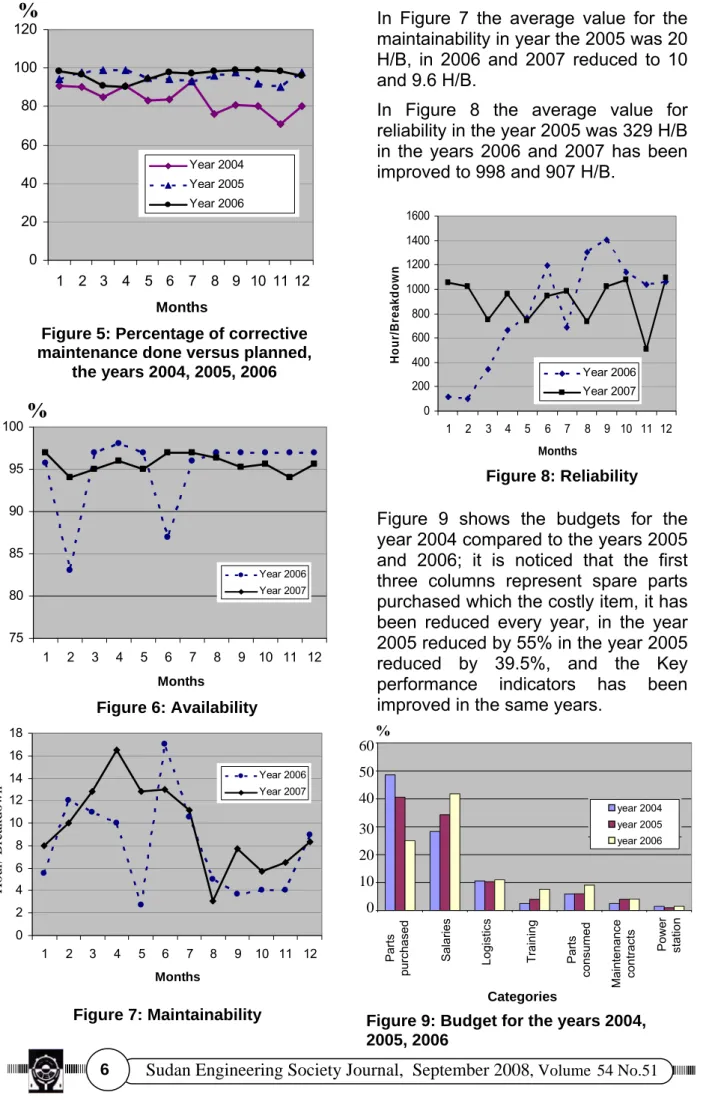
Table 2 shows the key performance indicators for year 2004,05,06,07 for comparison.
6. CONCLUSION
In this research a Computerized Maintenance Management system (CMMS) together with new maintenance techniques were implemented to improve key performance indicators like availability reliability and maintainability and to optimize maintenance costs.
The CMMS proved to be an essential tool for maintenance management; it is used in many enterprises in the industrial countries. The research based on the fact that any factor which can be measured and benchmarked with standard of excellence can be improved. The key performance indicators were carefully selected to reflect the true picture of maintenance performance.
From the results obtained the CMMS facilitated data collection, data analysis and decision making. The key performance indicators were improved as well as savings in the cost of maintenance, also the profitability of the company increased due to the increase in production. The cost of the research compared to the savings and profit gained is less than 1%. Continuous improvement for the work is achieved.
Table 2: Key performance indicators for the 60 key machines
Performance indicator 2004 2005 2006 2007 Standard Of excellence[3]
1 Availability - 94 % 94.9 95.7 100
2 Reliability - 329 H/B 998 H/B 907
3 Maintainability - 20 H/B 10.4H/B 9.6
4 Preventive maintenance done 85.9 91.1% 87% 93.3 100 5 Reactive maintenance done 83.75 96.5% 93.5% 96.4 100
6 Turnover for spare parts 3.3 2.7 4 50%
7 Maintenance cost to total added value
Sudan Engineering Society Journal, September 2008, Volume 54 No.51 The turnover for the spare parts still
is low. Spare parts in the stores need to be revised and that which their machines were sold or not needed, the company has to get rid of them.
Now the system runs with the server, it needs to be changed to web based, to be more stable, fast and can be accessed from any internet connection.
References
1. Mohamed Ben Daya, Salih O. Duffuoa, Maintenance Modeling and Optimization, Kluwer Academic, Norwell, 2000.
2. John Dixon Campbell, Uptime strategies for excellence in maintenance management, Production press, New York, 1995.
3. Lionel Laroche, Managing Cultural Diversity in technical professionals, Elsevier Science, Burlington, 2003.
4. Lindley R. Higgins, R. Keith
Mobley, Maintenance engineering Handbook, 6th
edition, Butterworth, London, 1983.
5. Gopala Krishnan P., Banerje A.K., Maintenance and spare parts management, Prentice Hall of India, New Delhi, 2002.
6 . ج ﺪﻟﺎﻧور . ﺔﻤﺟﺮﺗنﺎﻤﺗﻮآ ﻞﺒﻠﺑلدﺎﻋ ، ةرادا ﺔﻠﻣﺎﺸﻟاﺔﻴﺳﺪﻨﻬﻟاةدﻮﺠﻟا ، ﺔﻴﻤﻳدﺎآﻷاﺔﺒﺘﻜﻤﻟا ، ةﺮهﺎﻘﻟا ، 1994 . 7 . ﺖﻗﻮﻟاةرادا ، ﻦﻣﻒﺳﻮﻳﻦﻳﺪﻟاﺦﻴﺷ ﷲا ، ﻊﺑﺎﻄﻣ دﻮﺴﻟا ا ﺔﻠﻤﻌﻠﻟن ، مﻮﻃﺮﺨﻟا ، 2004 .
8. Recent economic indicators website:
http://www.dfat.gov.au/geo/fs/sud a.pdf