Physiol. Meas. 17 (1996) 121–146. Printed in the UK
TOPICAL REVIEW
X-ray microtomography of bones and teeth
Graham Roy Davis†and Ferranti S L Wong‡†Department of Biophysics in Relation to Dentistry, Faculty of Dentistry, St Bartholomew’s and The Royal London School of Medicine and Dentistry, Queen Mary and Westfield College, Turner Street, London E1 2AD, UK
‡ Department of Paediatric Dentistry, St Bartholomew’s and The Royal London School of Medicine and Dentistry, Queen Mary and Westfield College, Turner Street, London E1 2AD, UK
Received 22 November 1994, in final form 19 April 1996
Abstract. X-ray microtomography is a miniaturized version of computerized axial tomography with a resolution of the order of micrometres. In the biomedical field it is particularly useful in the study of hard tissue because of its ability to accurately measure the linear attenuation coefficient. From this, the mineral concentration can be computed, which is one measure of bone quality. Using microtomography it is also possible to form three-dimensional images of bone from which structural parameters can be derived which could not be measured using conventional histomorphometry. Various types of microtomography scanner have been used, including simple translate–rotate systems which are capable of measuring x-ray attenuation at multiple energies simultaneously, and ‘cone-beam’ systems which can acquire the necessary data for three-dimensional reconstructions in a relatively short time. Both laboratory x-ray sources and synchrotrons have been used in the study of hard tissue using microtomography. Most studies of bone have been concerned primarily with either the mineral concentration in cortical bone or the structure in cancellous bone. The mineral concentration in teeth has also been studied, in particular the loss of mineral in enamel during in vitro demineralization and the gain during subsequent remineralization. Although there are currently relatively few centres carrying out this work, interest in the technique is rapidly growing and it is likely to find a useful place both in research and ultimately in clinical practice.
Keywords: cancellous bone structure, microtomography, 3D visualization, biological mineral concentration, osteoporosis
Contents
1 Introduction 122
2 Comparison with other microscopy techniques 124
2.1 Optical microscopy 124
2.2 X-ray microradiography 124
2.3 Backscattered electron imaging 125
3 Three-dimensional quantification 125
4 Apparatus 127
4.1 Single-detector systems 129
4.2 Linear-array systems 132
4.3 Area-array systems 132
4.4 Factors affecting resolution 132
5 Sample preparation 133
6 Application of x-ray microtomography to study biological hard tissues 135
6.1 Cortical bone 136
6.2 Cancellous bone 137
6.3 Teeth 139
6.4 Multiple-energy microtomography 142
7 Conclusion and future work 142
Appendix. Interpretation of the linear attenuation coefficient in hard tissue 143
1. Introduction
The discovery of x-rays, 100 years ago, led to a revolution in diagnostic medicine, making it possible to see inside the body non-invasively. The interpretation of x-ray images is, however, not necessarily a simple process. Each point on the x-ray image is a function of the attenuation coefficients of all the features through which the x-ray beam passes. The resultant mapping of a three-dimensional object onto a two-dimensional image can be compared with superimposing all the floor plans of a complex multi-storey building on top of one another. Not only does the loss of depth information make it impossible to determine the precise location of a feature, it also makes it impossible to quantitatively determine its attenuation coefficient. It is also difficult to distinguish between different types of tissue with similar attenuation coefficients. Using film it is possible to resolve differences in contrast of 2% and above (Swindell and Webb 1988). This does not, however, mean that features with a 2% difference in absorption can be detected as this will depend on the size of the feature compared with the surrounding mass. For relatively small objects a much higher differential in absorption is needed for it to be visible on the x-ray image. Highly x-ray absorbing media can be added to enhance the contrast of certain features, for example blood, and a qualitative idea of depth can be obtained by the use of stereoscopic image pairs. However, a radiologist can only derive useful diagnostic information from a conventional x-ray image using a priori knowledge of anatomy and the normal appearance of the particular view under investigation.
The invention of x-ray computed axial tomography (Hounsfield 1973, Cormack 1963) brought about a further significant step forward in diagnostic medicine since it allowed images of internal features to be made based directly on their x-ray attenuation coefficients. As the attenuation coefficient of a particular feature is an inherent property and does not depend on its position or size, unlike the intensity in conventional x-ray images, quantitative classification is possible. Tomography produces a two-dimensional map of x-ray absorption
X-ray microtomography of bones and teeth 123
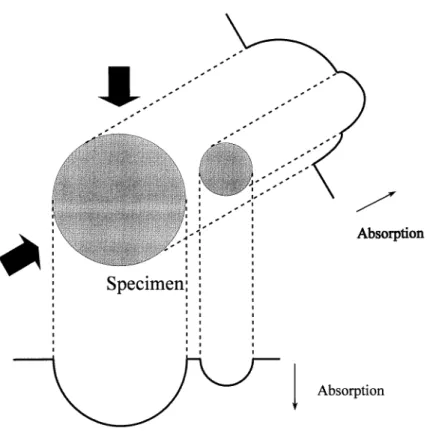
Figure 1. X-ray absorption projections through a slice of a specimen. This diagram shows
two x-ray absorption projections, taken at different angles, through a slice of a simple specimen consisting of two cylinders. In a typical microtomography scan, several hundred such projections would be taken in order to reconstruct an x-ray absorption map of the slice.
in a two-dimensional slice of the subject, thus there is no compression of three-dimensional data into a two-dimensional plane (except that due to the finite slice thickness). This is achieved by taking a series of x-ray projections through the slice at various angles around an axis perpendicular to the slice (see figure 1). From this set of projections, the x-ray absorption map is computed. By taking a number of slices, a three-dimensional map is produced.
Since their original introduction in the early 1970s the design of CAT scanners has improved in terms of accuracy, resolution and scanning speed (Kak and Slaney 1988). In medical tomography it is possible to obtain a resolution of a fraction of a millimetre, but whatever technological advances are made in detector design, it will not be possible to improve resolution much further than this because of x-ray dosage limitations. To be able to distinguish adjacent features, the image noise (appearing as graininess) must be kept down at an acceptable level. The noise is inversely proportional to the product of the pixel step size and the square of the number of photons detected (Chesler et al 1977, Davis 1994). Thus when the pixel size is halved, the number of photons must be quadrupled to give the same signal to noise ratio. Furthermore, since the x-ray beam width is halved, the exposure (measured in terms of x-rays absorbed per unit volume) must be increased by a further factor of two, and again by two if the depth is also halved. Thus to improve the resolution by a factor of two the exposure must be increased by a factor of 16, with a 10 000-fold
increase in exposure required for only a tenfold improvement in resolution.
Ten years after the invention of the CT scanner, in 1982, Elliott and Dover developed the first x-ray microtomography (XMT) apparatus and produced an image of a hard-tissue specimen, in this case the shell of biomphalaria glabrata (snail), with a resolution of 12µm. The system used was a scaled down version of the conventional medical scanner and could be used for the study of specimens measuring as little as 1 mm across. In the period following, this and various other XMT systems have been developed which will be discussed later. With XMT, the same increase in exposure as mentioned above applies to keep the noise to the same level; however, since the specimen size is smaller, lower x-ray energies are used and the measured attenuation coefficients are higher. Thus the signal (attenuation coefficient) to noise ratio, a measure of image quality, can be maintained with a 1000-fold increase in exposure for a tenfold improvement in resolution. Current technology limits the use of XMT mainly to small, inanimate specimens, although Kinney et al (1995) recently demonstrated the use of in vivo XMT for studying changes in bone associated with ovariectomy in rats. In this paper we shall be concerned only with its use on extracted teeth and bone biopsies, the latter application being of potential use in clinical diagnosis. Images of rat bones are also included to illustrate other capabilities of the technique.
Although, for the reason given above, XMT cannot be considered a truly non-invasive technique (in so far as it can only be used on biopsy specimens) it is a non-destructive technique. Thus XMT can be performed on biopsies taken for other investigations without damaging them or removing any material (on a molecular scale some x-ray induced damage will occur but this is unlikely to be extensive enough to affect subsequent test results). XMT opens two new avenues for investigation not possible (or at least very difficult) with other techniques: the measurement and mapping of local bone density (or more precisely, bone mineral concentration) on a microscopic scale and the quantification of three-dimensional structure within bone. Because relatively few centres are involved in this work, the clinical usefulness of these investigations has yet to be thoroughly explored, but preliminary findings will be given here.
In this paper we shall present, first of all, a discussion of conventional techniques for the investigation of hard tissue, including optical microscopy and contact microradiography. Immediately following this is a section which explains the means by which three-dimensional images can be processed and structural measurements made. Section 4, on apparatus, shows the various types of XMT equipment in use and describes the advantage of each system. Following this is a section on sample preparation and then a look at results of x-ray microtomographic studies of hard tissue to date. Finally there is a conclusion and discussion of likely future developments in this area. The appendix gives details of assumptions made in interpreting the x-ray linear attenuation coefficient in hard tissue.
2. Comparison with other microscopy techniques
Microscopy technique is a vast subject and it is not the intention of this paper to discuss all aspects of this in detail. We confine our discussion mainly to techniques that are commonly used, and some that have been recently developed, for investigating biological hard tissues.
2.1. Optical microscopy
In conventional histomorphometry using optical microscopy, the specimen is usually decalcified and cut into thin sections. The sections are then stained with appropriate dye to reveal the organic structures. To see the calcified tissues, the undecalcified specimen
X-ray microtomography of bones and teeth 125
has to be sawn into sections which are ground down to a thickness of about 80–100 µm so that transmitted light can penetrate the section. For tissues that are highly mineralized (e.g. enamel and dentine), it is very difficult to grind ultra-thin sections without fracturing them. A lateral spatial resolution of about 0.3 µm can be achieved (Engelke et al 1993) so that fine structures in bone such as canaliculi, lacunae and bone cells can be visualized. However, this technique lacks the ability to accurately assess the degree of mineralization.
2.2. X-ray microradiography
In x-ray contact microradiography of thin sections (50–100µm in depth) with photographic film (or plate), the lateral resolution depends on the grain size of the film, with 1µm being readily obtainable and 0.1µm feasible (Stuart 1980). The resolution of hard-tissue features will be poorer than this due to overlap within the section thickness. From the contrast in the grey levels, young and old bone tissues can be distinguished due to the difference in their mineral concentration (Jowsey 1960). With a suitable calibration standard (e.g. an aluminium step wedge), the optical density of the radiograph can be converted to mineral concentration. An advance on this technique is x-ray scanning microradiography (SMR; Anderson and Elliott 1993), where a 10µm x-ray beam is used and the photographic film is replaced by a solid-state detector. The advantages of SMR over conventional contact microradiography are the following: (i) effectively monochromatic radiation can be used; (ii) the problem of non-linear response and saturation in the photographic medium as well as inhomogeneity in both this and the x-ray beam is avoided and (iii) the facilitation of ‘real time’ experiments, for example, demineralization and remineralization of dental tissues (Gao
et al 1991). However, both these methods require physical sectioning of the specimen,
so some structures between sections will be lost (sectioning may be impossible in some circumstances, for example, when there is a soft lesion in hard tissue). Furthermore, the accuracy in determining the linear attenuation coefficient depends on the section being absolutely plano-parallel with an accurately known thickness or at least known thickness at the point of measurement (Sissons et al 1960).
2.3. Backscattered electron imaging
Compared to light microscopy and microradiography, atomic-number-contrast backscattered electron (BSE) imaging is virtually free of projection effect errors resulting from the superimposition of multiple tissues due to section thickness (Bachus and Bloebaum 1992). The resolution of BSE imaging depends on the penetration of electrons into the specimen, which is approximately 5 µm (for an electron beam of 20–30 keV) in bone (Bachus and Bloebaum 1992). The interpretation of the grey level in BSE images has been a topic of discussion. In theory, the grey level is directly related to the mean atomic number of the tissue. In practice, because the mean atomic number is related to the fractional volume concentration of mineral in biological hard tissue, which in turn is related to density (Skedros et al 1993a, b), BSE can be used to assess the microscopic differences in tissue mineralization (Reid and Boyde 1987). Since the introduction of BSE microscopy to investigate biological tissues (Boyde and Jones 1983a, b), appropriate standards have been sought to cover the grey-level range of mineralized tissues so that an absolute value of mineral concentration can be determined. XMT has been used to calibrate the grey level in BSE (Boyde et al 1990). After obtaining a BSE image of a transverse cross section of a rat femur, a tomographic image of the same section was obtained. A calibration curve was derived by comparing histograms of the grey level in the BSE image and the linear
attenuation coefficient in the tomographic image. Recently, novel aromatic dimethacrylate esters have been found to be suitable standard compounds for BSE studies of mineralized tissues (Boyde et al 1995).
In XMT, although the resolution is not as high as in microradiography (at present, the highest spatial resolution we have seen reported is 4 µm: Bowen et al 1986), it has the following advantages: (i) it is a non-destructive technique, therefore, no tissue is lost due to sectioning; (ii) accurate linear attenuation coefficients of mineralized tissues can be determined with monochromatic radiation; (iii) three-dimensional rendering and quantification is possible and (iv) real time monitoring of structural and compositional changes can be carried out, for example, the effect of mechanical loading or dynamic chemical processes.
3. Three-dimensional quantification
Although essentially a two-dimensional technique, conventional optical histomorphometry can be used to measure three-dimensional parameters (Revell 1983). For example, the area fraction of bone in a slice is equivalent to the volume fraction, provided that the section is representative of the whole volume. Similarly, perimeters in a two-dimensional slice are related to surface areas in three dimensions. However, two-dimensional techniques cannot be used to measure connectivity or even to measure basic trabecular dimensions, since this will depend on the orientation of the section with respect to the bone surface.
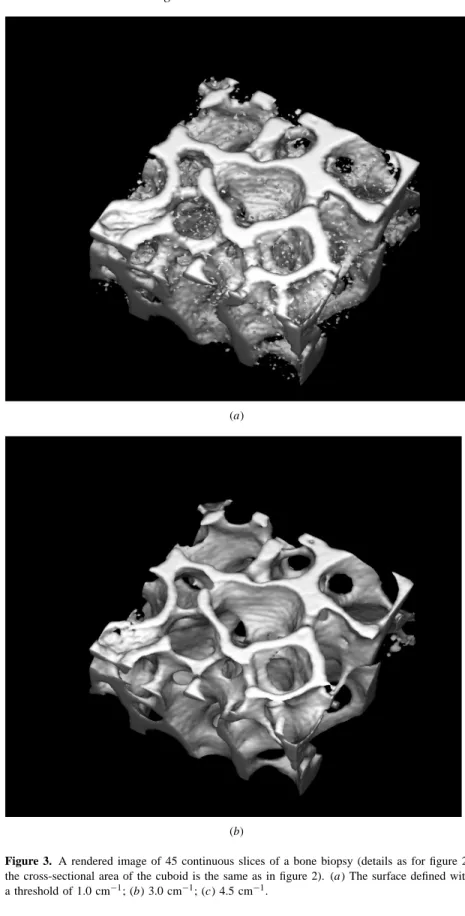
Before any measurement of three-dimensional structure can be made from microtomographic data, it is first necessary to determine the bone surface, that is, the boundary between bone and non-bone. Because of the limited spatial resolution of the tomographic images, the edges of bone do not appear sharp but are graduated. The simplest method of defining the edge is to set a threshold halfway between the attenuation coefficient, or density, of bone and non-bone. All pixels above this threshold are considered to be bone and all below are non-bone. This gives a good approximation to the true bone to non-bone interface when there is a substantial volume of bone adjacent to a large space, but in cases where the trabecular thickness approaches the resolution of the scanner this threshold is too high. In such cases, the gradients on opposite sides overlap in the centre so that the true attenuation coefficient is never reached. The result of using the halfway threshold, mentioned above, is that such trabeculae will appear much thinner, or absent altogether. Variations in mineral concentration of the trabeculae will also affect this thresholding method. The effect of varying this threshold is illustrated in figures 2 and 3. Figure 2 shows a magnified portion of one of 45 reconstructed slices of a human femoral head bone biopsy (Anderson et al 1994), scanned at the London Hospital Medical College (LHMC, now St Bartholomew’s and The Royal London School of Medicine and Dentistry; see subsection 4.1 for a description of the system). The spatial resolution is 44 µm and the energy 22.105 keV (Ag Kα). The graininess of the image indicates that the photon counting statistics are relatively poor (only approximately 1500 photons were counted to make each attenuation measurement). Figure 3 shows the result of thresholding the reconstructed data-set and rendering the resultant surface. When the threshold is set too low (1.0 cm−1, figure 3(a)) the trabeculae appear wider and there is some erroneous inclusion of noise peaks in the image background. When it is set too high (4.5 cm−1, figure 3(c)) the trabeculae appear too thin and appear to break up. With the threshold set to 3.00 cm−1 (figure 3(b)), the representation of the trabeculae appears to be good but, as mentioned above, the ideal threshold will depend on their geometry, which is variable throughout the volume. Note that although the original image in figure 2 appears blurred (due to a resolution of 44µm),
X-ray microtomography of bones and teeth 127
Figure 2. A magnified portion of a tomographic image of a bone biopsy from the femoral
head of a 62 year old man (death unrelated to bone condition). The x-ray energy was 22.1 keV (Ag Kα) and the step size was 44µm. Each of 251 projections was made up of 128 equispaced attenuation measurements made by taking the time to count 1500 photons. The bar length is 1 mm.
the thresholding and rendering process gives an impression of sharpness (figure 3) which may be misleading.
An alternative method of thresholding is suggested by Kuhn et al (1990b). They suggested that because of the variation in geometry and density within a bone cube, and also the variation in mineral concentration of the trabeculae, a uniform threshold for the entire image to demarcate the border between bone and non-bone was inappropriate. Instead, they described a variable-threshold algorithm which ‘reflects the density variations in a local neighbourhood of pixels about the point of interest’. They evaluated this technique by comparing the microtomographic images with histological sections of the specimen. They concluded that although the general structural pattern seemed to be insensitive to changes in the parameters of thresholding, the thickness and continuity of trabeculae were affected. With their optimized thresholding procedure, the XMT measurements of bone volume fraction (Pp) were not significantly different from those measured from the histological sections.
Once the bone to non-bone interface has been established it is then possible to measure the bone volume fraction and surface area directly and also to compute more complex structural parameters. Feldkamp et al (1989) computed the Euler number (a topological measurement of network connectivity, equal to the number of nodes minus the number
(a)
(b)
Figure 3. A rendered image of 45 continuous slices of a bone biopsy (details as for figure 2;
the cross-sectional area of the cuboid is the same as in figure 2). (a) The surface defined with a threshold of 1.0 cm−1; (b) 3.0 cm−1; (c) 4.5 cm−1.
X-ray microtomography of bones and teeth 129
(c)
Figure 3. (Continued)
of branches) in cancellous bone. They also demonstrated that, since the two-dimensional histomorphologic parameters of cancellous bone could be measured in each of the three orthogonal planes, it is possible to study structural anisotropy (a measure of the degree and direction of preferred orientation in a structure).
4. Apparatus
Apart from the scale, XMT systems differ from medical CT scanners in one fundamental way: instead of the x-ray source (and sometimes detector array) moving around the subject, it is the specimen which moves whilst the x-ray source and detector are stationary. XMT scanners can be divided into three categories, those with single detectors, those with linear detector arrays and those with area detector arrays. In each of these categories either a conventional x-ray source or a synchrotron can be used. In general, better images are produced by systems which use synchrotron radiation (Kinney and Nichols 1992). The x-radiation produced by a synchrotron is much more intense, allowing the use of dual-crystal monochromators to provide an intense monochromatic x-ray beam, enabling absolute linear attenuation coefficients to be measured. Furthermore, since the projections are parallel, accurate three-dimensional absorption maps can be reconstructed using a simple parallel projection algorithm. Tuning the monochromator to different energies enables a degree of compositional mapping to be performed. A second double-crystal monochromator, placed between the specimen and the detector, can be used to eliminate scatter (Kinney et al 1989). By using asymmetrically cut crystals, the x-ray projection can be magnified before detection.
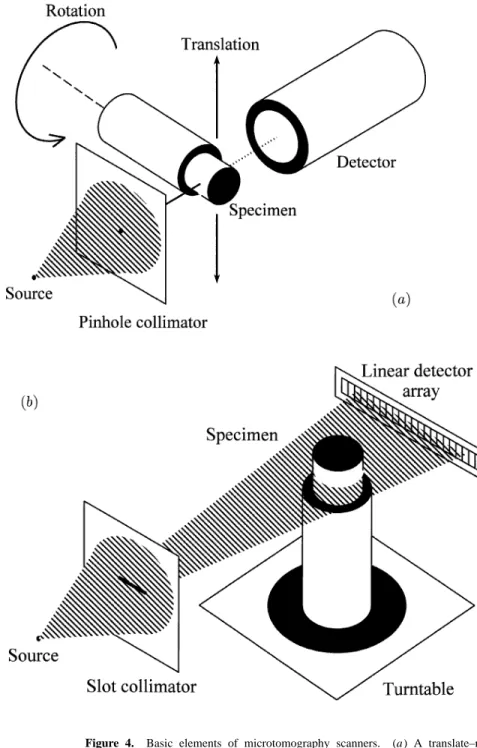
Figure 4. Basic elements of microtomography scanners. (a) A translate–rotate or ‘first-generation’ scanner. It uses a single source with a pinhole collimator creating a narrow x-ray beam. The specimen is moved (translated) through this beam and the absorption measured using a single detector. This process is repeated to obtain each projection, with the specimen being rotated by a small amount between projections. (b) A linear detector array (fan-beam) system having a slot collimator and a linear detector array. In this type of system all the samples for a single projection are recorded simultaneously thus greatly speeding up data acquisition. (c) An area detector array (cone-beam) system where a complete two-dimensional projection is recorded at each angular increment. These projections (each one a conventional x-ray view) can be used to construct a three-dimensional x-ray absorption map of the specimen.
X-ray microtomography of bones and teeth 131
Figure 4. (Continued)
The only real drawback with synchrotron systems is the limited availability of the source and high ‘beam time’ cost, so they are unlikely to be of use in routine clinical diagnosis.
The three types of scanner are described as follows.
4.1. Single-detector systems
As in Hounsfield’s original design (Hounsfield 1973), the simplest XMT arrangement consists of an x-ray source, a pinhole collimator and a single detector. This type of system is now referred to as a first-generation system. Elliott and Dover (1982) used the same principle with a 15 µm diameter x-ray beam, mounting the specimen on a stage which moves it through the beam (that is, translates it) and also rotates it axially (see figure 4(a)). The specimen can also be moved along the rotation axis to produce multiple slices. After each translation, the specimen is rotated by a small amount and another projection recorded, and so on, until a complete set of projections, taken around either 180 or 360◦, is recorded (180◦ is sufficient for image reconstruction but 360◦ allows the centre of rotation to be determined more accurately from the projections). The projections are then ‘reconstructed’ to form the tomographic image. Typically 251 projections, each of 128 samples, are taken in around 12 h, the exact time depending on the statistical accuracy required. For each sample the time is measured to count a fixed number of photons within a defined energy band. Image reconstruction takes 20 s on a personal computer with a 486-66 DX processor (5 s with a 133 MHz Pentium processor), using an in-house implementation of the Ramachandran– Lakshminarayanan (1971) filtered backprojection algorithm (see Elliott et al 1994 for a
recent description of the LHMC system).
Although this is the simplest type of XMT scanner, it has one main advantage over detector array types, that energy discriminating detection can easily be used so that the attenuation coefficient can effectively be measured using monochromatic radiation, even with an x-ray tube source. This means that, when the composition is known (at least of the main absorbing components), the mass attenuation coefficient can be calculated accurately from published photon interaction cross-section data and compared with measured values of the linear attenuation coefficient to determine the mass density. It is also possible to collect data at different energies simultaneously. When such information is processed, it is often possible to make some distinction between variations in density (or concentration) and chemical composition (an example of this, where the absorption of potassium iodide into a piece of deer antler is observed, is described in subsection 6.4). Another advantage of highly collimated single-beam systems is the lack of blurring effects caused by scattering.
The disadvantage with this type of system is the data acquisition time. The time taken to acquire data for a single slice can be between 2 h and 2 d depending on the spatial resolution and statistical accuracy required. The data for multiple slices for three-dimensional reconstruction can take weeks or even months to acquire.
4.2. Linear-array systems
As with medical CT scanners, faster data collection is achieved by using a linear detector array to collect one whole projection at a time (Seguin et al 1985, see figure 4(b)). This system used a conventional x-ray source and a diode array detector, but more recent systems tend to use charge coupled detectors (CCDs; see Allinson 1994). Such CT scanners are identical in principle to the third-generation medical CAT scanners except that, as mentioned previously, the specimen rather than the x-ray system moves. In these types of system, the x-rays fan out from the source to each detector element, giving rise to the name ‘fanbeam-projection’. Data collection can be orders of magnitude faster but the simple method of energy discrimination with laboratory x-ray sources is lost. Since area CCD arrays are now readily available, there is no overall cost or practical advantage in using a linear array over an area array and thus these systems have largely been superseded by area-array configurations.
4.3. Area-array systems
When a two-dimensional detector array is used, the rays form a cone and the resultant set of projections can be used to reconstruct a three-dimensional image of the specimen (Feldkamp
et al 1984; see figure 4(c)). Each projection is essentially a conventional x-ray view of the
specimen. Conventional x-ray systems which use non-distorting electronic detection can be made to produce tomographic images with the addition of a computer controlled turntable and the appropriate reconstruction software (see, for example, Burch and Lawrence 1992). It should be noted, however, that ‘cone-beam’ backprojection reconstruction algorithms are only approximations and do not give accurate quantitative results, with errors increasing with increasing distance from the central plane (Kak and Slaney 1988). The physical construction of XMT systems means that the cone angle is likely to be small and we would expect the error in the measured attenuation coefficient to be less than 1% from the discussion of Kak and Slaney (1988). However, the geometry of trabecular bone is extremely complex compared with the phantom object described by Kak and Slaney (1988) and it is therefore necessary to carry out further experimental work to determine the accuracy
X-ray microtomography of bones and teeth 133
of this approach.
The cone-beam configuration saves considerable data collection time, although the limiting factor may be computational time since a vast number of data are collected and the algorithm for cone-beam reconstruction is more complex than for fan beams. A further problem with cone-beam systems is the effect of scattered x-rays. With single-beam or fan-beam systems most of the scattered x-ray photons will miss the detector, but in cone-fan-beam projections a much higher proportion will be detected. This proportion can be reduced by increasing the distance between the specimen and the detector provided the x-ray source spot size is small in comparison with the detector resolution, so as not to degrade the resolution (see below). The proportion of scattered to absorbed x-rays increases with increasing energy and so this effect will be much less significant at energies of around 20 keV and below.
4.4. Factors affecting resolution
The spatial resolution of the final image depends both on the resolution of the detector and on the x-ray source spot size (assuming a laboratory x-ray source). If the spot size is large with respect to the detector resolution, the specimen must be placed near the detector in order to obtain the sharpest image. With CCDs having pixel sizes down to around 10µm, the limiting factor is usually the scintillator, which is coupled to the CCD using either a lens system or a fibre-optic face-plate (reducing fibre-optic tapers are not suitable for tomographic imaging because of geometric distortion). Light output from the scintillator can be increased using a microchannel image intensifier. The thickness of the scintillator is a compromise between making it thick enough to absorb a good proportion of the x-ray photons and making it thin enough to reduce light scatter and give good resolution. Typically, detector resolutions of around 50 µm can be achieved. Although CCDs are sensitive to x-rays directly, they have a low absorption probability for photon energies above 10 keV. Furthermore, the exposure levels required for XMT can cause damage to the device, although recent studies suggest that for energies below 60 keV this latter problem may not be too serious (Allinson 1994).
When the source spot size is smaller than the detector resolution it is better to put the specimen near to the source, giving geometrical magnification of the image. The limit of this magnification will be determined by the specimen size, detector size and physical construction of the system. The axis on which the specimen turns must have significantly less ‘wobble’ than the source–detector resolution if the image is not to be degraded by this. Overall, a 1µm resolution should be achievable. When a synchrotron source is used, the x-ray beam is parallel and thus the positioning of the specimen with respect to the detector does not have the same effect on resolution and is determined by other practical considerations.
In the latest fourth-generation medical CT scanners a fixed ring of detectors is used with only the x-ray source moving, such that the vertex of each fan projection is at the detector, rather than at the source. This overcomes the problem of different detection characteristics in individual detector elements, which can lead to ‘ring’ artifacts in the reconstructed image. Unfortunately it is physically not possible to make a microscopic version of this type of system. A fourth-generation XMT scanner (Davis and Elliott 1996), giving the same advantages as the fourth generation medical scanners but using the principle of time delay integration (TDI) in the CCD camera, has recently been built at the LHMC. This can currently scan specimens of up to 4 cm diameter, with a resolution of approximately 40µm.
(a)
(b)
Figure 5. A reconstructed section of a femur from a 9 week old rat at a distance 13.8 mm
from the distal metaphysis. (a) A grey-scale image; (b) the linear attenuation coefficient is represented in a pseudo-colour scale. This scale (cm−1) is the same as that in figures 6 and 8 and gives the linear attenuation coefficients for Ag Kα(22.1 keV) radiation. The small circle beside the femur is the cross section of a 0.5 mm diameter aluminum wire (Puratronicr, Johnson Matthey Plc, UK) for calibration purposes. The scale bar is 1 mm. The mineral concentration distribution of the cortical bone in this figure is presented in figure 7.
X-ray microtomography of bones and teeth 135
Figure 6. An XMT section of a hypoplastic incisor from a child who was born prematurely with
low birth weight. The same pseudo-colour scale as in figure 5 is used to represent the linear attenuation coefficients. The image shows the regional differences in mineral concentrations. The enamel in the approximal region has higher mineral concentration than the buccal and lingual enamel (see also figure 1 of Fearne et al 1994).
5. Sample preparation
Because XMT is a non-destructive technique, it generally requires very little specimen preparation as long as the size of the specimen is less than the total scanning distance and the structures of the sample do not alter due to drying. For example, in the investigation of the mineral concentration of the cortical bone of a rat femur (figure 5) and a hypoplastic tooth (figure 6), the specimens were only air dried before they were attached to the axial spindle of the kinematic stage. However, for cancellous bone, where the dimension changes in drying, and for large samples where the size has to be reduced within the scanning range of the equipment, an embedding medium such as polymethylmethacrylate (PMMA) is often needed. This process may cause peripheral distortion if the embedding medium has a significantly different hardness to the specimen. However, we have found that with cancellous bone biopsies, the bone trephine causes considerable peripheral distortion, so that only the inner region of the biopsy is of any significant value. Therefore, with the first-generation XMT equipment used at LHMC, that has a limited scanning range of approximately 6 mm, turning an 8 mm trephined bone biopsy into a 6 mm cylinder (after embedding) removes only material which is unsuitable for structural analysis (because the specimen is embedded, the turning process itself causes only minimal damage).
Although preventing distortion due to drying, embedding the specimen has the disadvantage that it makes it impossible to perform subsequent mechanical testing. As an alternative to embedding, the specimen can be kept in a humid atmosphere during scanning. Further studies at LHMC will be carried out in a controlled atmosphere.
When it is impossible, or undesirable, to reduce the specimen size, another approach to reducing data collection or reconstruction time is to use a ‘region of interest’ method (see
Figure 7. Mineral concentration distributions of cortical XMT slices at various distances from
the distal metaphysis of the same rat femur as in figure 5. Each symbol corresponds to the measured proportions of bone volume having the same mineral concentration. The figure shows a gradual increase in mineral concentrations in slices further away from the distal metaphysis. It also shows that the mineral distribution in each slice is asymetrical, with the long tail at lower mineral concentrations (see also figure 3 of Wong et al 1995a).
for example Reimers et al 1989). In this case, we define a region of interest within the specimen, for example, the interior of a bone biopsy. When a first-generation scanner is used (figure 4(a)) the attenuation of rays passing outside this region is recorded with lower statistical accuracy, thus reducing the data collection time. If reconstruction time needs to be reduced, the sample spacing can be increased outside the region of interest.
6. Application of x-ray microtomography to study biological hard tissues
This section presents previous XMT studies of biological hard tissues based on various research groups, rather than a chronological sequence. Particular emphasis will be placed on quantitative interpretation of XMT images to understand biological and pathological phenomena.
These studies can be divided broadly into studies of cortical and cancellous bone and of teeth. For cortical bone and for teeth, the emphasis is on the degree of mineralization. In cancellous bone, the emphasis is mainly on the morphological measurements of trabeculae and their three-dimensional structural arrangement, which are needed as a basis for the understanding of the mechanical properties.
X-ray microtomography of bones and teeth 137
6.1. Cortical bone
The LHMC group have used a single-detector system (see subsection 4.1) to determine mineral concentrations. Unless otherwise specified, this used a laboratory x-ray source and a beam collimated with a 10 µm aperture. Early results (Elliott and Dover 1984, 1985) reported 12.5 cm−1(Mo Kα, 17.43 keV photons; uncorrected for system dead-time; NaI(Tl) scintillation counter) as the mean linear attenuation coefficient for a piece of human cortical femoral bone. Bowen et al (1986) used the same equipment to study the same sample, but with a 4µm aperture and a synchrotron source. This study was primarily a demonstration of the technique and no new quantitative analysis of the specimen was given. Rat rib yielded a mean linear attenuation coefficient of 16 cm−1 (Mo Kα, 17.43 keV; NaI(Tl) scintillation counter) after correction for amplifier dead-time (Elliott et al 1988). In later studies, the low-energy-resolution (∼40% full width at half maximum, FWHM) NaI(Tl) scintillation counter was replaced by a higher-resolution solid-state detector (HPGE or Si(Li); ∼ 2% FWHM), yielding mineral concentrations with better precision. Two rat femora were studied (Mechanic et al 1990) in a multidisciplinary investigation on the effect on mineralization of weightlessness during space flight. In a synchronous control rat femur, the mean linear attenuation coefficient per transverse slice of the femoral cortex increased disto-proximally from 6.76 to 7.20 cm−1 (Ag Kαradiation, 22.105 keV), whereas in a space flight rat femur it went from 6.46 to 7.63 cm−1. A similar gradient has been found by Wong et al (1995a) in another five rat femora, establishing its general occurrence. Figure 7 is a plot of the mineral concentration distributions in one rat femur, clearly showing the shift to higher mineral concentrations in slices further away from the distal growth plate. The linear attenuation coefficients for bone can be converted to mineral concentrations assuming that the bone comprises protein and pure hydroxyapatite (Ca10(PO4)6(OH)2; density, 3.16 g cm−3) and using calculated mass attenuation coefficients (see the appendix). On this basis, Wong et al (1995a) found the mean mineral concentration per transverse section to range from 1.33 to 1.47 g cm−3(calibrated with a pure Al wire adjacent to the femur). These authors attributed the gradient of increasing mineral concentration disto-proximally to the increase in maturity of populations of elementary volumes of bone (EVBs). An EVB is a volume of bone that is composed of mineral, collagen fibres and other organic components, cells, small blood vessels and water; in an XMT image, a voxel can be regarded as an EVB.
It should be noted that the linear attenuation coefficients quoted in the above studies are the mean taken over an area of observation within the slice; the standard errors associated with these measurements (or values derived from them) were not reported. This is probably because the number of degrees of freedom associated with the mean is difficult to determine. It is less than the number of voxels in the calculation, since the values of linear attenuation coefficient in adjacent voxels are correlated. The degree of correlation is influenced by many factors including the number of projections, the filter function used in the reconstruction and the shape of the area of observation. The distribution of the linear attenuation coefficient depends not only on the biological variation within the specimen but also on the resolution of the system as well as the photon statistics. The latter component can be calculated (Davis 1994) so that its contribution to the observed distribution can be estimated.
Other groups who have reported studies on cortical bone are those in Brookhaven National Laboratory (Yasumura et al 1993) and those in the Hamburg synchrotron radiation laboratory HASYLAB at DESY (Engelke et al 1993). Both used a synchrotron source, which, as previously discussed, is ideal for measuring the linear attenuation coefficient accurately. However, both groups seem to concentrate only on the relative regional differences in grey levels in the images; neither reported quantitative measurement of the
linear attenuation coefficient in bone. In the XMT images of the rat mid-diaphyseal sections studied by Yasumura et al (1993), we observe the endosteal half having lower attenuation coefficients (darker grey levels) than the periosteal half (brighter grey levels). In the previously described study of the mineral concentration in rat femora by Wong et al (1995a), the linear attenuation coefficient appears to be quite uniform across the slice (figure 5) and we cannot observe any radial gradient. The mean linear attenuation coefficients for the outer and inner half of the slice are 7.05 and 7.02 cm−1 (Ag Kα, 22.105 keV) respectively. In the study by Engelke et al (1993), the emphasis was on the comparison between XMT, microradiography and histological stained section; little analysis was carried out on their XMT images of a rabbit tibia and of a human hand bone. Nevertheless, in their XMT image showing the cortex of the rabbit tibia, the linear attenuation coefficient across the slice appears to be uniform, in agreement with the finding of Wong et al (1995a). Factors that influence the measured linear attenuation coefficient in bone and the assumptions made in converting this to mineral concentration are discussed in the appendix.
6.2. Cancellous bone
The group from the University of Michigan using a system developed at the Ford Motor Company Research Laboratories (Dearborn, MI) seems to be the most active in using XMT to investigate cancellous bone (all studies cited in this section were undertaken using this system, except where otherwise stated). Their equipment comprises a laboratory x-ray source and an area-array detector system (see subsection 4.3). The reported resolution was 30–60µm.
6.2.1. Morphological parameters. Using a guinea pig model of osteoarthritis (i.e. the experimental animals underwent a gluteal myectomy operation), Layton et al (1988) and Dedrick et al (1991) compared the XMT images of the femoral heads from the experimental and control animals. The former work, where the animals were sacrificed 2 weeks after the operation, showed that subchondral trabecular thickness, relative trabecular density and bone fraction were all increased, but trabecular separation was decreased in experimental animals. In the latter report, the authors found the decrease in trabecular separation only in the experimental animals sacrificed 8 and 32 weeks post-operatively, whereas at 16 and 24 weeks, it was slightly increased. In a canine model of osteoarthritis, where the dog had its anterior cruciate ligament transected in one leg, Dedrick et al (1993) showed a reduction of subchondral trabecular density in the operated knee compared to the contra-lateral control knee. In these XMT studies, because the whole volume of bone was digitized, the morphological parameters (e.g. mean trabecular thickness and trabecular density) could be calculated in three dimensions instead of only two, which is the normal restriction in conventional histological studies. Furthermore, slices could be reconstructed in different orientations and the trabeculae visualized in any of the three orthogonal planes. This allowed a better impression of the three-dimensional structures of the cancellous bone to be inferred.
6.2.2. Structural analysis. To analyse three-dimensional structures, Feldkamp et al (1989) developed a method to measure the anisotropy and the connectivity of cancellous bones (see section 3). They found, from examining samples of 8 mm cubes of human bones, that the bone in the central region of the proximal femur was fairly isotropic, but in the distal femur, iliac crest and vertebral bodies the bone was highly anisotropic. Comparing left and right paired distal femora in dogs, Kuhn et al (1990a) found that the contralateral
X-ray microtomography of bones and teeth 139
difference in the degree of anisotropy could be as much as 4%. As discussed before, three-dimensional quantification depends on the determination of bone and non-bone voxels, which in turn depends on the thresholding parameters. Kuhn et al (1990b) found that the trabecular plate density (PL), calculated from XMT images using a local density dependent thresholding algorithm (see section 3), deviated from that measured from histological sections by approximately 14%, inferring a discrepancy in the mean trabecular thickness of about 19 µm. Consequently, although the isotropic parameter is insensitive to this discrepancy, the connectivity will be affected and therefore such results should be interpreted cautiously.
6.2.3. Mechanical testing. Because of the non-destructive nature of XMT, Goulet et al (1994) were able to take microtomographic scans (at 50µm resolution) of cubes of human cancellous bone before subjecting these specimens to mechanical testing. Their regression analysis results showed that morphological and structural measures accounted for 68–90% of the variance in estimating the modulus of elasticity and ultimate strength of the bone. These relationships between the structural and mechanical properties varied according to the biopsy site and from donor to donor. This indicates that the properties of individual trabeculae (probably relating to their mineral concentration) may be as important as their total amount and organization in predicting the mechanical properties of cancellous bone.
Other groups which have demonstrated the use of XMT to examine cancellous bone three dimensionally are Bonse et al (1994) at a resolution of 8 µm and Anderson et al (1994) at a resolution of 44 µm. This latter work was an investigation of a bone biopsy from a human femoral head, as described in section 3 and illustrated in figures 2 and 3.
Recently, Kinney et al (1995) carried out an in vivo XMT study of the effect of ovariectomy on the cancellous bones from rats’ tibia. Female Sprague–Dawley rats (6 months old) were anaesthetized during the XMT scans, which took about 30 min/animal (the total x-ray exposure time was less than 2.5 min). They claimed that each animal received less than 90 rad of radiation and believed that this dosage should not cause any significant effect on the trabecular growth. The rats were scanned twice with a 5 week interval. Their results show that the ovariectomized rats had lost approximately 65% of their trabecular bone volume as compared to an insignificant change in the control rats. The bone loss was attributed to a reduction in connectivity and the number of trabecular elements, but not in thinning of the trabeculae. These rats also lost the platelike trabecular structures. This study has shown sequential changes in trabecular bone structures can be followed in vivo, thus it will allow better design in studies of osteoporosis and in the effectiveness of therapy in treating this disease.
6.3. Teeth
The LHMC group appears to be the only one that has made extensive use of XMT in the study of teeth. Elliott et al (1989) first reported the measured linear attenuation coefficient (in a human premolar) of enamel to be 13.4 cm−1, and that of dentine to range from 6.5 to 7.4 cm−1 (Ag Kα, 22.105 keV). Using an XMT image of a mouse mandible, Wong
et al (1991) showed that the relationship between the molar and the developing incisor
of the mouse could be visualized non-destructively. Assuming the mineral to be pure hydroxyapatite (see the appendix), the mineral concentrations for the dentine of the molar, dentine of the incisor, enamel of the molar and enamel of the mouse incisor were 1.62, 1.46, 2.65 and 2.65 g cm−3 respectively. The three-dimensional mineral distribution of a lower rat incisor was investigated by Wong et al (1995b, c). They found that there is a mineral
(a)
(b)
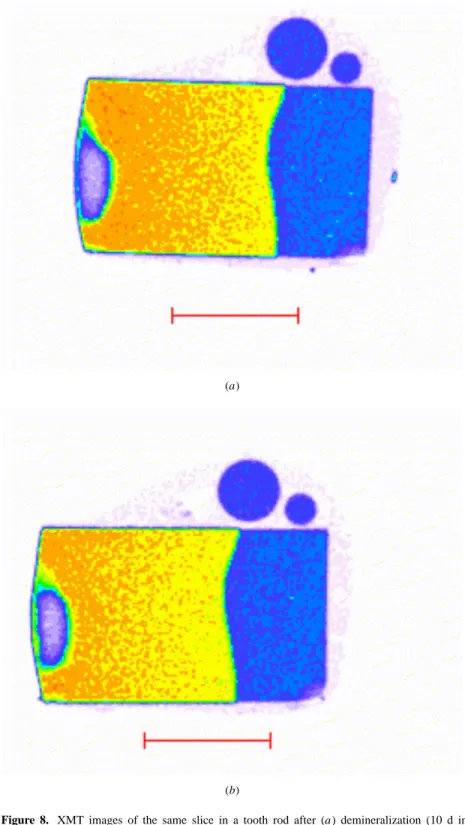
Figure 8. XMT images of the same slice in a tooth rod after (a) demineralization (10 d in
a gel containing 100 mmol dm−3 ethanoic acid, 7.5 mmol dm−3 CaCl2 and 4.5 mmol dm−3 KH2PO4, adjusted to pH 4.0 with 1 mmol dm−3 NaOH) and (b) subsequent remineralization (90 d in 2 mmol dm−3 CaCl2, 1.2 mmol dm−3 KH2PO4, 0.05 mmol dm−3 NaF, 150 mmol dm−3NaCl and 20 mmol dm−3sodium cacodylate at pH 7.0). (See also Gao et al 1991.)
X-ray microtomography of bones and teeth 141
(a)
(b)
Figure 9. Distribution of KI in a piece of deer antler (scale bar, 1 mm), after immersion in
3.0 mol dm−3KI for a period of 20 h prior to scanning on the LHMC XMT scanner. Attenuation measurements were made above and below the I K absorption edge. By assuming the only x-ray absorbing component in the antler (prior to immersion) was pure hydroxyapatite it is possible to derive two images, one representing the concentration of hydroxyapatite (a) and the other the concentration of KI (b). The pseudo-colour scales represent concentration in grams per cubic centimetre.
concentration gradient in enamel from the apex towards the incisal end with a maturation rate of 0.11 g cm−3 d−1 (assuming that the eruption rate was 0.6 mm per day). For dentine, no gradient along the incisor length was found, but the peripheral dentine was shown to have a higher mean mineral concentration than the circumpulpal dentine (1.5 and 1.3 g cm−3 respectively) (Wong et al 1995c). Using the non-destructive characteristics of XMT, Gao
et al (1993) quantitatively showed how much mineral was lost after demineralization in the
enamel of a tooth rod (figure 8), and how much mineral was regained after remineralization (in the same position of the same rod). In a study of deciduous teeth in low-birth-weight children, Fearne et al (1994) used XMT to determine the mineral concentration in enamel in these children. It was found that the mineral concentration ranged from 2.3 to 2.6 g cm−3in
low-birth-weight hypoplastic, and between 2.65 and 2.78 g cm−3in control primary enamel and post-defect, post-natal low-birth-weight enamel. The XMT images (e.g. figure 6) also showed that, in the incisal half of the teeth, there were regional differences within a slice, with the approximal enamel having higher mineral concentrations than the buccal and lingual enamel.
Using a synchrotron source, Kinney et al (1994) mapped the three-dimensional mineral distribution of a carious human canine. They found that the mineral concentrations for normal and demineralized dentines were 1.29 and 0.55 g cm−3 respectively. For remineralized dentine, the mineral concentration (2.25 g cm−3) was higher than that for normal dentine. This was attributed to the loss of organic matter during the previous demineralization process.
Recently, a group based at the University of Texas Health Science Centre at San Antonio has used XMT for endodontic research (Nielsen et al 1995). Their XMT system, the x-ray inspection module (General Electric Company Aviation Component Service Center, Cincinnati, OH), has a stated resolution of 127×127µm2. The three-dimensional rendering of the root canal in an endodontically prepared human maxillary molar has shown clearly the relationship between the three canals. Using the three-dimensional data, these authors also showed the tissue loss (increase in volume of the root canal space) due to endodontic instrumentation.
6.4. Multiple-energy microtomography
Figure 9 shows a pair of tomographic images of a piece of deer antler which has been soaked in 3.0 mol dm−3 potassium iodide for 20 h. Data were collected using a multi-channel analyser and the images derived from absorption measurements above and below the iodine K absorption edge. The images represent the concentration of hydroxyapatite (assumed to be the only significant x-ray absorbing component in the antler) and potassium iodide. The gradient in potassium iodide can be clearly seen, showing that it is possible, where absorption edges fall into useable energy ranges, to map specific elements within the specimen.
7. Conclusion and future work
X-ray microtomography is a largely unexploited method of observing and quantifying the structure and mineral content of bone. Since the measured parameters of structure and mineral content depend, to a certain extent, on the equipment and methodologies used, there will inevitably be differences in values recorded at different sites and it will be difficult to establish normal values. In time, however, as the technique’s use becomes more widespread, it is likely that equipment standards will arise, or at least a method of standardizing results. Only when the distribution of these parameters is known in the ‘normal’ population, will the ability of the technique to detect and quantify abnormalities be fully appreciated. At the present time, area-detector-array systems are as easy to construct as any other but the computational resources needed to reconstruct a three-dimensional volume, with a reasonable resolution, are vast, in terms of both memory and processing power. Inevitably, such power will soon be readily available and so the procedure for scanning, reconstruction and quantification of the three-dimensional structure and mineral concentration of bone biopsies and teeth will become a simple and rapid procedure.
For reasons of long measurement time and radiation dose mentioned in the introduction, it is unlikely that XMT will ever be carried out in vivo, at least, not in humans. Nevertheless,
X-ray microtomography of bones and teeth 143
the ability to carry out further studies in small live animals will be of tremendous benefit, for example, in therapeutic trials the statistical uncertainty due to inter-animal variation would be removed, which would improve the accuracy of results as well as reducing the time and resources required, including the number of animals. The pre-requisite for this is the ability to complete the scan within the maximum time for which the animal can be anaesthetized. The detector quantum efficiency must also be high in order to minimize the x-ray exposure. The observation of the change in structural parameters during mechanical loading will improve our knowledge of how these parameters are related to bone strength and hence the mechanism by which bone disorders give rise to ultimate structural failure. The non-destructive nature of the technique will allow this and a variety of other experiments and tests of real time structural and compositional changes to be undertaken.
Acknowledgment
The authors wish to thank Professor J C Elliott, at this institution, for his encouragement and help in the preparation of this review.
Appendix. Interpretation of the linear attenuation coefficient in hard tissue
Apart from mineral concentration, there are two other factors that will affect the linear attenuation coefficient.
Table A1. Mass attenuation coefficients of apatite with different formulae (formulae from Legros et al 1987 and mass attenuation coefficient data from McMaster et al 1969).
Mass attenuation coefficient (cm2g−1) Animals and age Bone mineral formulae at 22.1 keV Rat
at birth Ca8.29(PO4)4.29(HPO4)1.20(CO3)0.51(OH)0.29 4.607 30 d Ca8.32(PO4)4.32(HPO4)0.88(CO3)0.80(OH)0.32 4.624 1 year Ca8.27(PO4)4.27(HPO4)0.74(CO3)0.99(OH)0.27 4.628 Bovine
2 months Ca8.38(PO4)4.38(HPO4)0.70(CO3)0.92(OH)0.38 4.642 7 years Ca8.35(PO4)4.35(HPO4)0.59(CO3)1.06(OH)0.35 4.643 Hydroxyapatite Ca10(PO4)6(OH)2 4.820
(i) The composition. The values of linear attenuation coefficients are often converted to mineral concentration for calcified tissues on the assumption that the mineral is made up of pure hydroxyapatite (Ca10(PO4)6(OH)2). It is known that bone mineral is made up of impure hydroxyapatite and the composition also varies between young and old bones. Table A1 gives some examples of how the mass attenuation coefficient changes with different compositions of apatite. This shows that the variable composition of the apatite phase will cause a relative difference in the mass attenuation coefficient of only about 0.5% with an absolute error with respect to pure apatite of about−4%.
(ii) The resolution of the system. Within each voxel, there would be partial-volume effects from small blood vessels, cells and lacunar spaces. Thus the linear attenuation coefficient will depend on the scale of these features with respect to the resolution. As the
resolution improves, so progressively smaller features can distinguished and excluded from the mineral concentration measurement. This partial-volume effect biases the absorption towards lower values and contributes to the long tail seen in the lower end of the mineral concentration distribution (figure 7).
References
Allinson N M 1994 Development of non-intensified charge-couple device area x-ray detectors J. Synchrotron Rad.
1 54–62
Anderson P and Elliott J C 1993 Scanning microradiography Microsc. Anal. March 29–31
Anderson P, Wong F S L, Davis G R and Elliott J C 1994 Microanatomy of cancellous bone from x-ray microtomographic 3D reconstructions Royal Microsc. Soc. Proc. 29 239–40
Bachus K N and Bloebaum R D 1992 Projection effect errors in biomaterials and bone research Cells Mater. 2 347–55
Bonse U, Busch F, Gunnewig O, Beckmann F, Pahl R, Delling G, Hahn M and Graeff W 1994 3D computed x-ray tomography of human cancellous bone at 8 microns spatial and 10−4 energy resolution Bone Miner.
25 25–38
Bowen D K, Elliott J C, Stock S R and Dover S D 1986 X-ray microtomography with synchrotron radiation SPIE
Proc. 691 94–8
Boyde A, Davy K W M and Jones S J 1995 Standards for mineral quantitation of human bone by analysis of backscattered electron images Scanning 95 17 6–7
Boyde A, Elliott J C, Bromage T G, Anderson P, Davis G, Collier J, Hausner W S, Mechanic G L, Katz E P, Arnaud S B and Durnova G N 1990 Quantitative mineralization density mapping of space flight rat femoral bone at submicron resolution: BSE calibrated byµCT Bone Tooth Soc. Meeting (London 1989); Bone 11 217 Boyde A and Jones S J 1983a Back-scattered electron imaging of skeletal tissues Metab. Bone Dis. Relat. Res. 5
145–50
——1983b Backscattered electron imaging of dental tissues Anat. Embryol. 168 211–26
Burch S F and Lawrence P F 1992 Recent advances in computerized x-ray tomography using real-time radiography equipment Brit. J. NDT 34 129–33
Chesler D A, Riederer S J and Pelc N J 1977 Noise due to photon counting statistics in computed x-ray tomography
J. Comput. Assist. Tomogr. 1 64–74
Cormack A M 1963 Representation of a function by its line integrals, with some radiological applications J. Appl.
Phys. 34 2722–7
Davis G R 1994 The effect of linear interpolation of the filtered projections on image noise in x-ray computed tomography J. X-ray Sci. Technol. 4 191–9
Davis G R and Elliott J C 1996 X-ray microtomography scanner using time-delay integration for elimination of ring artefacts in the reconstructed image Nucl. Instrum. Methods A submitted
Dedrick D K, Goldstein S A, Brandt K D, O’Connor B L, Goulet R W and Albrecht M 1993 A longitudinal study of subchondral plate and trabecular bone in cruciate-deficient dogs with osteoarthritis followed up for 54 months Arthritis Rheum. 36 1460–7
Dedrick D K, Goulet R, Huston L, Goldstein S A and Bole G G 1991 Early bone changes in experimental osteoarthritis using microscopic computed tomography J. Rheumatol. Suppl. 27 44–5
Elliott J C, Anderson P A, Davis G R, Wong F S L and Dover S D 1994 Computed tomography. Part II: the practical use of a single source and detector J. Miner. Met. Mater. 46 (3) 11–19
Elliott J C, Boakes R, Dover S D and Bowen D K 1988 Biological applications of microtomography X-ray
Microscopy II ed D Sayre, M Howells, J Kirz and H Rarback (Heidelberg: Springer) pp 349–55
Elliott J C, Bromage T G, Anderson P, Davis G and Dover S D 1989 Application of x-ray microtomography to the study of dental hard tissues Enamel V ed R W Fearnhead (Yokahama: Florence) pp 429–33
Elliott J C and Dover S D 1982 X-ray microtomography J. Microsc. 126 211–13
——1984 Three-dimensional distribution of mineral in bone at a resolution of 15 micron determined by x-ray microtomography. Metab. Bone Dis. Relat. Res. 5 219–21
——1985 X-ray microscopy using computerized axial tomography J. Microsc. 138 329–31
Engelke K, Graeff W, Meiss L, Hahn M and Delling G 1993 High spatial resolution imaging of bone mineral using computed microtomography. Comparison with microradiography and undecalcified histologic sections
Invest. Radiol. 28 341–9
Fearne J M, Elliott J C, Wong F S L, Davis G R, Boyde A and Jones S 1994 Deciduous enamel defects in low-birth-weight children: correlated x-ray microtomographic and backscattered electron imaging study of hypoplasia and hypomineralization Anat. Embryol. 189 375–81
X-ray microtomography of bones and teeth 145
Feldkamp L A, Davis L C and Kress J W 1984 Practical cone-beam algorithm J. Opt. Soc. Am. A 1 612–19 Feldkamp L A, Goldstein S A, Parfitt A M, Jesion G and Kleerekoper M 1989 The direct examination of
three-dimensional bone architecture in vitro by computed tomography J. Bone Miner. Res. 4 3–11
Gao X J, Elliott J C, Anderson P and Davis G R 1993 Scanning microradiographic and microtomographic studies of remineralization of subsurface enamel lesions J. Chem. Soc. Faraday Trans. 89 2907–12
Gao X J, Elliott J C, Anderson P, Wong F S L and Davis G R 1991 Quantitative study of de-and remineralization in a tooth rod by x-ray microtomography J. Dent. Res. 70 719
Goulet R W, Goldstein S A, Ciarelli M J, Kuhn J L, Brown M B and Feldkamp L A 1994 The relationship between the structural and orthogonal compressive properties of trabecular bone J. Biomech. 27 375–89
Hounsfield G N 1973 Computerized transverse axial scanning (tomography): part I. Description of system Br. J.
Radiol. 46 1016–22
Jowsey J 1960 Age changes in human bone Clin. Orthop. 17 210–18
Kak A C and Slaney M 1988 Principles of Computerized Tomographic Imaging (New York: IEEE)
Kinney J H, Johnson Q C, Nichols M C, Bonse U, Saroyan R A, Nusshardt R and Pahl R 1989 X-ray microtomography on beamline-X at SSRL Rev. Sci. Instrum. 60 2471–4
Kinney J H, Lane N E and Haupt D L 1995 In vivo, three-dimensional microscopy of trabecular bone J. Bone.
Miner. Res. 10 264-70
Kinney J H, Marshall G W Jr and Marshall S J 1994 Three-dimensional mapping of mineral densities in carious dentin: theory and method Scanning Microsc. 8 (2) 197–205
Kinney J H and Nichols M C 1992 X-ray tomographic microscopy (XMT) using synchrotron radiation Annu. Rev.
Mater. Sci. 22 121–52
Kuhn J L, Goldstein S A, Feldkamp L A, Goulet R W and Jesion G 1990a Evaluation of a microcomputed tomography system to study trabecular bone structure J. Orthop. Res. 8 833–42
Kuhn J L, Goulet R W, Pappas M and Goldstein S A 1990b Morphometric and anisotropic symmetries of the canine distal femur J. Orthop. Res. 8 776–80
Layton M W, Goldstein S A, Goulet R W, Feldkamp L A, Kubinski D J and Bole G G 1988 Examination of subchondral bone architecture in experimental osteoarthritis by microscopic computed axial tomography
Arthritis Rheum. 31 1400–5
Legros R, Balmin N and Bonel G 1987 Age-related changes in mineral of rat and bovine cortical bones Calcif.
Tissue Int. 41 137–44
McMaster W H, Kerr Del Grande N, Mallett J H and Hubbell J H 1969 Compilation of x-ray cross sections
Lawrence Radiation Laboratory Report UCRL-50174 section II, rev 1, section IV
Mechanic G L, Arnaud S B, Boyde A, Bromage T G, Buckendahl P, Elliott J C, Katz E P and Durnova G N 1990 Regional distribution of mineral and matrix in the femurs of rats flown on Cosmos 1887 biosatellite FASEB
J. 4 34–40
Nielsen R B, Allyassin A M, Peters D D, Carnes D and Lancaster J 1995 Microcomputed tomography: an advanced system for detailed endodontic research J. Endodont. 21 561–8
Ramachandran G N and Lakshminarayanan A V 1971 Three dimensional reconstruction from radiographs and electron micrographs: application of convolution instead of Fourier transforms Proc. Natl Acad. Sci. USA 68 2236–40
Reid S A and Boydie A 1987 Changes in the mineral density distribution in human bone with age: image analysis using backscattered electrons in the SEM J. Bone Miner. Res. 2 13–22
Reimers P, Kettschau A and Goebbels J 1989 Region of interest (ROI) mode in industrial x-ray computed tomography Industrial Computerized Tomography (Columbus, OH: The American Society for Non-destructive Testing) pp 48–53
Revell P A 1983 Histomorphometry of bone J. Clin. Pathol. 36 1323–31
Seguin F H, Burstein P, Bjorkholm P J, Homburger F and Adams R A 1985 X-ray computed-tomography with 50µm resolution Appl. Opt. 24 4117–23
Sissons H A, Jowsey J and Stewart L 1960 Quantitative microradiography of bone tissue X-ray Microscopy and
X-ray Microanalysis (Proc. 2nd Int. Symp. (Stockholm)) ed A Engstr¨om, V Cosslett and H Pattee (Amsterdam:
Elsevier) pp 199–205
Skedros J G, Bloebaum R D, Bachus K N and Boyce T M 1993a The meaning of graylevels in backscattered electron images of bone J. Biomed. Mater. Res. 27 47–56
Skedros J G, Bloebaum R D, Bachus K N, Boyce T M and Constantz B 1993b Influence of mineral content and composition on graylevels in backscattered electron images of bone. J. Biomed. Mater. Res. 27 57–64 Stuart P R 1980 Towards the ultimate x-ray microscope Microfocal Radiography ed R V Ely (London: Academic)
pp 245–88
(Bristol: Institute of Physics) pp 98–127
Wong F S L, Elliott J C, Anderson A and Davis G R 1991 X-ray microtomographic study of the mineral content and structure of a mouse mandible J. Dent. Res. 70 691
——1995a Mineral concentration in rat femoral diaphyses measured by x-ray microtomography Calcif. Tissue Int.
56 62–70
——1995b Three dimensional mineral distribution in the enamel of a rat incisor measured by x-ray microtomography Bone 16 690
——1995c Three dimensional mineral distribution in the dentine of a rat incisor measured by x-ray microtomography J. Dent. Res. 74 849
Yasumura S, Jones K, Spanne P, Schidlovsky G, Wielopolski L, Ren X, Glaros D and Xatzikonstantinou Y 1993 In vivo animal models of body composition in aging J. Nutr. 123 459–64