Figure 7 The separation of the enantiomers of the AQC fluorescent derivatives phenylalanine, methionine and serine. Courtesy of LC/GC. (T. L. Bereufer,LC-GC, Vol. 12 No. 10 (1994) 748).
Conclusion
Although relatively few substances are inherentlyS u-orescent, most can be made to formSuorescent deriv-atives by relatively simple derivatization procedures. In addition, with the aid of a suitable laser, the natu-ral high sensitivity of the device can be greatly en-hanced. The main disadvantage of the Suorescence detector is its limited linear dynamic range but since in most LC analyses high sensitivity is usually required for trace analysis, in practice this limitation is not found to be so important.
See Colour Plate 22.
Further Reading
Guilbault GG (1973)Practical Fluorescence. New York: Marcel Dekker.
Kok WTh (1998) Principles of detection. In: Katz E (ed.) Handbook of HPLC, p. 143. Chichester: John Wiley.
Rhys-Williams AT (1980)Fluorescence Detection in Liquid Chromatography. BeaconsReld: Perkin Elmer.
Scott RPW (1996)Chromatography Detectors. New York: Marcel Dekker.
Udenfriend S (1962) Fluorescence Assay in Biology and Medicine. New York: Academic Press.
Detectors: Infrared
R. P. W. Scott, Avon, CT, USA
Copyright^ 2000 Academic Press
Introduction
Infrared (IR) light is the term given to electromagnetic radiation having a wavelength lying between 1 and 15 micron. In contrast to UV light, which is adsorbed when the light energy at a particular wavelength is equal to speciRc electronic transitions in the mol-ecule, IR light is adsorbed when its energy is equal to
Figure 1 The elementary FTIR instrument. Courtesy of Nicolet Inc., Madison, Wisconsin, USA. there is considerably moreRne structure in IR spectra
and consequently, IR spectra are generally more use-ful and give less ambiguous identiRcation.
In general, IR adsorption is much weaker than UV adsorption and thus much larger samples are re-quired. In addition, most of the solvents that are used in liquid chromatography adsorb strongly in the IR region and thus there have been very few IR based LC detectors developed, and none sufRciently effec-tive for general use. In practice, the liquid chromato-graph is usually combined with an IR spectrometer as a tandem system to provide spectra of the eluted solutes for identiRcation purposes and not primarily as a detector. The basic construction of the tradi-tional IR spectrometer is similar to that of the UV spectrometer except that the optical components must be transparent to IR light and thus must be made of appropriate materials. In addition, due to relatively low sensitivity, the interface is usually some form of transport device that also concentrates the sample as well as removing any interfering solvent. There are two forms of IR spectrometer, the grating dispersion IR spectrometer and the Fourier transform IR spectrometer (FTIR). The dispersion instrument is rarely used today in conjunction with the modern liquid chromatograph and the FTIR-LC tandem in-strument now dominates the LC/IR Reld. Conse-quently only the FTIR instrument will be brieSy described.
The Fourier transform IR (FTIR) spectrometer in-volves relatively simple instrumentation but quite complicated data processing. Due to its basic design, the spectrometer monitors all the wavelengths coinci-dentally, and consequently, the FTIR spectrometer can scan samples much faster than the dispersive
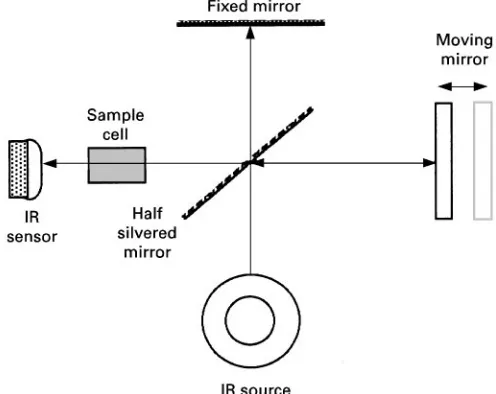
instrument. This feature alone, makes the FTIR spec-trometer highly suitable for tandem operation. A dia-gram of the basic system is shown inFigure 1.
Light from a broad band infrared source is col-limated and passes into an optical system where it strikes a beam splitter consisting of a very thinRlm of germanium. 50% of the light passes through theRlm and is reSected back along its original path by aRxed mirror, where half of the light intensity (25% of the original light intensity) is reSected by the same beam splitter, through the sample cell, to the infrared sen-sor. The remaining 50% of the incident light is reS ec-ted at right angles to its incident path onto an axially movable mirror. Light from the moving mirror re-turns along its original path and again, half of the light intensity is transmitted through the beam split-ter, through the sample cell, to the infrared sensor. As a result of this optical system, a quarter of the original collimated incident light from the source reaches the sensor from theRxed mirror and a quarter from the movable mirror. Because the path length of the two light beams striking the sensor will differ, there will be destructive and constructive interference, the sys-tem constituting a Michelson interferometer. As the movable mirror traverses its programmed path, it will produce a series of maxima and minima as all the different wavelengths generated by the source pass through conditions of constructive and destructive interference. These maxima and minima are continu-ously monitored by the sensor and recorded. It should be noted that the frequency of the waveform is con-trolled by the velocity of the moving mirror which will be selectable.
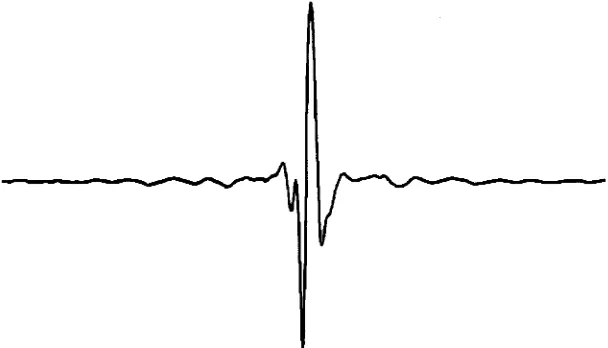
Figure 2 A typical interferogram. Courtesy of Nicolet Inc., Madison, Wisconsin, USA.
interferogram obtained from the FTIR is shown in
Figure 2.
The resolution of the interferogram does not ap-pear to be very good. However, this is misleading as a one second scan from an FTIR instrument gives equivalent resolution to that of a dispersive instru-ment scanning for 10 to 15 min. In any event, the FTIR resolution can be improved still further by using repetitive scans and processing the sum. The resolu-tion is increased proporresolu-tionally to the square root of the number of accumulated scans, e.g. 16 accumu-lated scans would increase the resolution by a factor of four. Spectra accumulation also increases sensitiv-ity which is a distinct advantage in tandem systems, as the available sample may be severely limited. A single scan may take about a second, thus scanning for four seconds would double the sensitivity. Tan-dem systems involving IR measurements would not be successful without the introduction of the Fourier transform IR spectrometer.
LC
/
IR Transport Interfaces
The Rrst transport system to be used as a liquid chromatograph}spectrometer interface was intro-duced by Scott et al. for a liquid chromatogra-phy/mass spectrometer tandem system. Eventually, the transport concept was extended to LC/IR tandem instruments and the most effective LC/FTIR interface commercially available incorporated a solvent trans-port interface. One of the Rrst LC/IR transport systems was developed by Kuehl and GrifRths. Ini-tially, moving ribbon devices were used in a similar manner to that of Scott et al., but were eventually discarded in favour of a rather crude, but effective, rotating disc transport system. TheirRnal model con-sisted of a cup carousel containing potassium chloride
that actually acted as a fraction collector and thus was hardly an in-line interface. Depending on the speed of the transport process, many transport inter-faces could be considered as automated off-line monitoring devices. Fast moving transport systems such as a wire or belt transport however, give the impression of being in-line devices although in prin-ciple, they are not. The LC/IR carousel had 32 cups Rtted with aRne mesh screen andRlled with potassi-um chloride powder. Carousel position was control-led automatically in three positions, where speciRc sampling activities took place. In position (1) the eluent passed onto the potassium chloride until the halide powder was saturated with mobile phase. In position (2) a stream of air was drawn through the packing to evaporate the solvent. In position (3) in-frared light was directed through the dry halide, and the spectrum was taken. The carousel interface con-centrated the solute and increased the sensitivity of the LC/IR combination. Unfortunately, with modern LC columns, many peaks can be eluted in a few seconds and so intermittent sample collection is un-suitable. The carousel interface primarily acts as a chromatographic ‘memory’; all the eluted solutes are stored as a ‘physical’ chromatogram as localized masses, deposited on the transport medium. TheRrst chromatographic memory was introduced by Kar-men, who used a wire transport detector to accumu-late each eluted solute onto the wire surface, which was then stored on a reel. Subsequently, the wire was passed continuously through theSame of an FID, to produce a record of the separation. The most effective LC/IR interfaces are directly or indirectly based on this principle.
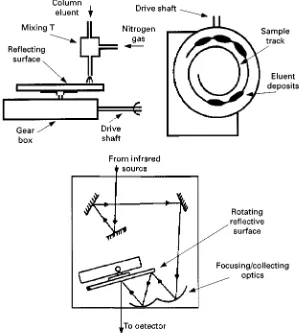
Figure 3 The layout of the transport LC/FTIR apparatus developed by Gagel and Bieman. (Reproduced with permission from Gagel and Bieman, 1986.)
was actuated by the detector signal and, at the start of a peak, the plate was moved to a new collection position. The disc moved on when elution was com-plete so that the sample was isolated at a speciRc position on the plate perimeter. A small bore column was used (Sow rate 5L min\1) so the eluent fell onto the plate and the solvent either evaporated under ambient conditions or with the aid of an infrared heater. After the separation was complete a spectrum was taken by measuring the light transmitted through the dry deposit in the usual manner. Obviously, be-cause of the solubility of the halide in water, aqueous solvents could not be used.
Gagel and Bieman employed an aluminium disc, on top of which was cemented a circular glass mirror to form a transporter with a reSective surface; it was used in conjunction with a simple nebulizer that de-posited the sample on the surface. Their basic appar-atus is shown diagramatically inFigure 3.
The disc rotated continuously during separation, leaving a spiral trail of solid deposits on the surface of the reSective plate. Evaporation was accomplished by the nebulizer. The column eluent passed into a T, one
limb of which carried aSow of nitrogen gas. The gas and eluent passed outviaa narrow nozzle in the third limb, which directed the spray onto the disc surface. After separation, the disc was placed in a modiRed total reSectance IR accessory. The disc was rotated, the surface scanned by the IR spectrometer, and the reSectance}absorbence spectra continuously col-lected. This LC/FTIR interface appeared successful, and functioned without signiRcant peak dispersion or loss of chromatographic resolution. The minimum mass needed to provide a satisfactory spectrum varied with the characteristic absorbence of the substances being monitored. However, it was shown that be-tween 50 and 100 ng of sample could provide a rec-ognizable spectrum.
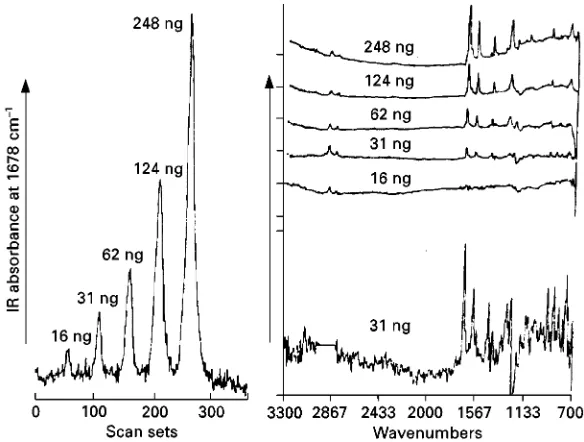
Figure 4 Results from the modified LC/FTIR interface demonstrating the overall sensitivity of the tandem instrument. (Reproduced with permission from Gagel JJ and Bieman K (1987)Anal. Chem., 59(9): 1267.)
was situated inside another nozzle through which heated nitrogen wasSowing. The new arrangement functioned well with aqueous solvent mixtures and the overall sensitivity of the apparatus was signiR -cantly increased. The sensitivity of the modiRed inter-face is demonstrated inFigure 4.
The peaks from the injection of different masses of phenanthraquinone are shown on the left. The peaks are curves relating the IR absorbance at 1678 cm\1 to scan number for samples deposited from 29% water in methanol. The ultimate sensitiv-ity, deRned as the mass of solute that would provide a signal to noise ratio of 2, was about 16 ng.
Solvent elimination is relatively easy with nonaqueous mobile phases but the majority of LC separations employ reversed phase columns and re-quire mobile phases with a high water content. Poor volatility of such solvent mixtures, causes the deposits to be smeared into one another. This seriously im-pairs the separation. Water in the mobile phase also restricts the choice of the transport medium as it must be water resistant. A considerable amount of work has been carried out on nebulizer design to improve solute deposition and focus the material onto a smal-ler spot. Techniques that have been tried include ther-mospray and hydrodynamic focusing that employs a concentric gas Sow to reduce the jet diameter by the Bernoulli effect. Different transport media have also been explored, including potassium chloride layers on the surface of a zinc-selenium metallic stage using diffuse transmission spectroscopy to obtain the spectrum of the deposited material. The deposition of
the eluent from a narrow bore reversed phase col-umn, onto the surface of a linearly moving substrate, using a jet spray assembly as an interface, has also been developed. The immobilized chromatogram (ac-tually a chromatographic memory) is analysed by moving the substrate linearly under an FT-IR micro-scope while collecting the spectra. Zinc selenide was found to be preferable to an aluminized reSective surface as a disc transport. An example of the disc system used to display a reversed-phase separation of some polynuclear hydrocarbons is shown in three-dimensional form in Figure 5. The sensitivity to pyrene at a signal to noise ratio of 2 was 13 ng.
The In-Line Flow Sensor
The alternative to a transport interface is an in-line Sow-through cell, and in 1983 a micro IR cell, 3.2L in volume, thatRtted directly into the IR spectrometer was described by Brown and Taylor. By using a small-bore column they achieved an overall increase in mass sensitivity of about two orders of magnitude, relative to that obtained from the standard 4.6 mm i.d. column. An FTIR spectrometer was used, but the actual sensitivity improvement was confused as the length of the small bore column differed signiRcantly from that of the standard column. Consequently, the true sensitivity in terms of minimum sample mass that would provide an acceptable spectrum, could not be assessed accurately.
Figure 5 A three-dimensional reversed phase LC/IR plot of the separation of some polynuclear aromatic hydrocarbons. (Reproduced with permission from Conroy and Griffiths, 1984.)
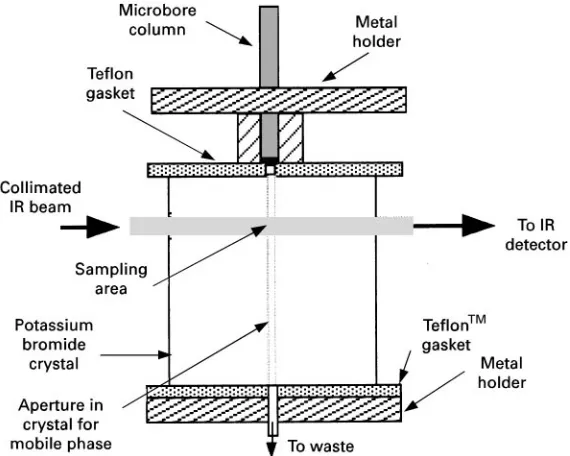
Figure 6 Zero dead volume micro IR cell.
was described by Johnson and Taylor. It was claimed that the cell would reduce the detection limit (the minimum mass required to produce a useful IR spec-trum) to about 50 ng. TheSow cell design is shown in
Figure 6.
The cell was formed crystalline calcium Suoride or potassium bromide in the form of a block 10;10;6 mm. A hole 0.75 mm i.d. was drilled through it to carry the mobile phase from the column through the block and out to waste. The collimated IR beam passed through the block, normal to the cylindrical aperture and, in doing so, transversed
a section of the exiting eluent. A beam condenser was used to reduce the focal diameter of the beam to that of the hole. It was noted that the maximum signal-to-noise was obtained by summing the spectra from scans taken across the peak, between$1.53of the Gaussian proRle, as it passed through the cell. As a practical point of interest, it was found easier to modify optically the size of the IR beam to match the Sow cell, than to construct a cell that would accurate-ly match the dimensions of the IR beam.
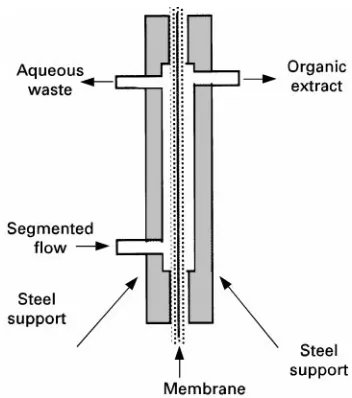
Figure 7 An extraction interface for LC/IR. chromatography. The cell was made with cone
shaped ends, from a cylindrical shaped zinc selenide crystal, and mounted in stainless steel. The crystal was blazed at 453and consequently gave ten reS ec-tions during passage of the IR beam down its length. The incident beam was focused onto the cone face and the radiation leaving the crystal was focused onto the IR sensor. The cell volume was large, ca. 24L and thus would adversely affect the resolution of a small-bore column. Clear, identiRable spectra were obtained from a 100L sample, containing 2% of acetophenone and ethyl benzoate and 1% of nitro-benzene from on-the-Sy spectra. However, this was not a very sensitive device compared with other LC/FTIR systems.
A rather complicated solvent extraction system was developed by Conroy and GrifRths for use with an LC/FTIR tandem instrument. It involved a process that continually extracted the solute from the column eluent into dichloromethane. The solution is dichloro-methane was concentrated and dispersed onto a plug of potassium chloride powder. The residual solvent was evaporated, the sample scanned and a spectrum taken. This process is somewhat clumsy but it intro-duces a new concept for constructing LC/IR interfa-ces. Employing the same basic principle Johnsonet al. constructed a rather unique extraction cell for use with an LC/IR tandem system by introducing the technique of segmented Sow. The aqueous eluent from a reversed phase column was mixed with chloroform (with which the column eluent was im-miscible) producing segmented Sow. The extraction solvent (chloroform) was then separated from the segmentedSow by means of a ‘hydrophobic’ (disper-sive) membrane. There were two pumps, one for the mobile phase and the other for the extraction solvent, which could be either chloroform or carbon tetra-chloride. The two streams were mixed at a T junction (post column) and formed the segmented Sow. The segmented Sow then passed through an extraction coil and then to a separator. The separator was made of stainless steel with a membrane having pores about 0.2m in diameter dividing its length into half and its general layout is shown inFigure 7.
The volume on either side of the membrane was about 16L and the amount of solvent passing through the membrane was controlled by the differ-ential pressure across the membrane. Obviously this device could cause serious peak dispersion and would be unsuitable for use with high-efRciency of small-bore columns. Samples containing at least 300g of material were necessary to produce a satisfactory spectrum, indicating a relatively poor sensitivity.
The segmented Sow interface was developed fur-ther by Hellgeth and Taylor, who improved both the
segmentation and the extraction efRciency. The seg-mented Sow generator was made from 1/16 in. Swagelok T union, drilled out to contain 1/16 in. tubes the ends of which were only 0.45 mm apart and the general design is shown inFigure 8.
Figure 8 Diagram of a phase separator.
The extraction solvent Sowed through a second column situated prior to the T piece to provide more pulse damping. The segmented mixture then passed through an extraction coil which provided the neces-sary time for the solutes to diffuse from the aqueous phase into the solvent. There is no parabolic velocity proRle in segmentedSow, and thus little or no peak dispersion can occur.
The segmentedSow entered a phase separator and the separated solvent then passed through a UV ab-sorption detector and into a spray jet assembly. Heated nitrogen was used in the spray jet assembly, to aid in the nebulization process. The chromato-grams obtained indicate that very little peak disper-sion occurs and that the column resolution is not signiRcantly degraded. The Rnite volume of the ex-traction tube, however, produced a signiRcant reten-tion delay (about 3.5 min), which varied with both the Sow rate and volume of the extraction system. Providing the solvents were reasonably volatile, they were completely removed in the nebulizing process. However, the percentage of organic solvent in the mobile phase must not be large enough to make it miscible with the methylene dichloride and prevent the formation of segmentedSow. It follows that the choice of mobile phase was somewhat restricted.
Conclusion
Although considerable work has been applied to the development of LC/IR, it remains the least effective of all the LC tandem instruments. However, the IR
spectrum does provide unique information not read-ily available from other spectroscopic techniques and consequently, for the elucidation of certain molecular structures, can be extremely useful, if not essential. It would appear that, at this time, the trans-port interface will provide the highest sensitivity and the best spectra if sample availability is limited.
See also: II/Chromatography: Supercritical Fluid: Fourier Transform Infrared Spectrometry Detection.
Further Reading
Brown RS and Taylor LT (1983) Microbe liquid chromatography with Sow cell Fourier transform in-frared spectrometric detection.Analytical Chemistry55: 1492}1497.
Conroy CM, GrifRths PR, Duff PJ and Azarraga LV (1984) Interface of a reversed-phase high-performance liquid chromatograph with a diffuse reSectance Fourier trans-form.Analytical Chemistry56: 2636}2642.
Gagel JJ and Bieman K (1986) Continuous recording of reSection-absorbance Fourier transform infrared spectra of the efSuent of a microbore liquid chromatography.
Analytical Chemistry58: 2184}2189.
Helgeth JW and Taylor LT (1987) Optimization of aSow cell interface for reversed-phase liquid chromatogra-phy/Fourier transform infrared spectrometry.Analytical Chemistry59: 295}300.
Jino K and Fujimoto C (1981) Combination of micro high performance liquid chromatography and Fourier trans-form infrared spectrometry using the potassium bromide crystal buffer memory technique.Journal of High Res-olution Chromatography4: 532}533.
Johnson CC and Taylor LT (1984) Zero dead volumeSow cell for microbore liquid chromatography with Fourier transform infrared spectrometric detection. Analytical Chemistry56: 2642}2647.
Johnson CC, Hellgeth JW and Taylor LT (1985) Reversed-phase liquid chromatography with Fourier transform infrared spectrometric detection using aSow cell inter-face.Analytical Chemistry57: 610}615.
Karmen A (1966) Flame ionization detector for liquid} liquid chromatography. Analytical Chemistry 38: 286}290.
Kuehl D and GrifRths PR (1979) Novel approaches to interfacing a high performance liquid chromatograph with a Fourier transform infrared spectrometer.Journal of Chromatographic Science17: 471}476.
Raynor MW, Bartle KD, Davies IL, Williams A, Clifford AA, Chalmers JM and Cook DW (1988) Polymer
addi-tive characterization by capillary supercritical Suid chromatography/Fourier transform infrared microspec-trometry.Analytical Chemistry60: 427}433.
Sabo M, Gross J, Wang J and Rosenberg IE (1985) On-line high-performance liquid chromatography/Fourier trans-form infrared spectrometry with normal and reverse phases using an attenuated total reSectance Sow cell.
Analytical Chemistry57: 1822}1826.
Scott RPW, Scott CG, Munroe M and Hess J Jr. (1974) A transport interface for LC/MS.The Poisoned Patient:
The Role of the Laboratory, p. 395. New York: Elsevier. Somsen GW, Hooijschuur EWJ, Goopijer C, Brinkman UATh and Velthorst NH (1996) Coupling of reversed-phase liquid column chromatography and Fourier trans-form infrared spectrometry using post column on-line extraction and solvent elimination. Analytical Chem-istry68: 746}752.
Detectors: Mass Spectrometry
M. R Clench and L. W Tetler,
Sheffield Hallam University, Sheffield, UK
Copyright^ 2000 Academic Press
Introduction
Liquid chromatography (LC) can often separate com-plex mixtures but simple detectors (e.g. ultraviolet-visible UV/Vis) do not allow identiRcation of the individual components. Comparison of retention data and spiking with known standards is normally required to provide evidence of composition but this may lead to erroneous results as absolute identiR ca-tion is not possible. Development of diode array de-tection has somewhat alleviated the problem but not removed it entirely. Absorbance requires the presence of a chromophore in the molecule and, as such, UV/vis spectra do not enable absolute identiRcation but are frequently used to conRrm identity through comparison of recorded spectra with reference spectra. Mass spectrometry (MS) provides a unique means of determining the presence of a compound in a mix-ture by producing a mass spectrum which will aid or conRrm its identiRcation. The relative molar mass (RMM) and/or structurally important information may also be obtained from the mass spectrum.
The combination of a separation technique with MS provides a powerful instrumental method for the analytical scientist. Modern gas chromatography} mass spectrometry (GC-MS) instrumentation, having overcome the obstacles associated with coupling them to each other, has matured into an easy-to-use benchtop technique. The interfacing of high perfor-mance liquid chromatography (HPLC) with a mass
spectrometric detector (LC-MS) poses many prob-lems, not least the different sample requirements of the respective instruments, i.e. liquid and vapour. The purpose of this article is to describe those interfaces that are most routinely used in LC-MS applications and, as such, will cover aspects of ionization methods and, to a lesser extent, mass analysers.
Background
The combination of HPLC and MS can be used as an ofSine technique, that is, fractions are collected and then a mass spectrum of each obtained. Much greater sensitivity, however, may be achieved by having an online interface, but this is much more difRcult to achieve than with GC. The vapourSow in HPLC is much greater than in GC and there may be problems with electrical breakdown in high voltage instru-ments. HPLC may be operated in either normal or reversed-phase modes and the mobile-phase composi-tion may be either isocratic or gradient. Different-sized columns are available (analytical, microbore and capillary), leading to a wide range of operational Sow rates. The various possible conRgurations com-plicate the interfacing to MS.