The Distributional Effects of Austerity Measures: A Comparison of Six EU Countries
39
0
0
Full text
(2) Europeaan Commission Emplloyment, Social Affairss and Inclusion Social Situation Obseervatory – Living Condditions and Income Disstribution 2011. So ocial Situa ation Observatory – Income distributio on and living condittions Applica (BE), Europea an Centre for the Eu uropean Centre C forr Social Welfare W P Policy and d Researc ch (AT), ISE ER – Unive ersity of Esssex (UK) and a Tárki (HU) Tim Callan+, Chrrysa Leven nti*, Horac cio Levy***, Ma anos Matssaganis*, Alari A Paulu us** & Holly Sutherla and** + ESRI, Du ublin; * Athens Univ versity of E Economicss and Busiiness; ** ISSER Universitty We would w like to thank Josse Albuque erque, Mike Brewer, Ca arlos Farinha a, Francesc co Figari, Vitor Junqueira a and Terrry Ward for comme ents, advic ce and asssistance. We W also ackn nowledge the t contrib bution of all a past an nd current members of the EUROMOD conssortium. The e usual disclaimer applies. a The e process of extendiing and updating u t, Social EURO OMOD is fin nancially su upported by b the Direc ctorate Ge eneral for Employmen E Affairs and Inclu usion of the e European n Commissio on [Progresss grant no. VS/2008/03 318]. For this v version of th he paper th he estimates for Ireland d are from the t ESRI mo odel SWITCH H, based on m microdata frrom the Irish h SILC 2008 made available by th he Irish Centtral Statistic cs Office. For P Portugal we e make use e of microd data from the EU Sta atistics on In ncomes an nd Living Cond ditions (EU-SILC) made e available e by Eurosttat under contract c EU U-SILC/2009/17, the natio onal EU-SILC C “PDB” datta for Estoniia, Greece and Spain made avaiilable by resspective natio onal statistic cal offices and a for the UK Family Resources R Su urvey data made avaiilable by the D Department of Work and a Pensions via the UK Data Archive. The authors alone are respo onsible for the analysis and interprretation of the data rep ported here e.. This Research note was financed by and prrepared fo or the use of the Eu uropean Com mmission, Dirrectorate- General G for Employmen nt, Social Affairs A and Equal E Oppo ortunities. It do oes not ne ecessarily re eflect the opinion or position of o the Euro opean Com mmission, Direc ctorate-Gen neral for Em mployment, Social Affa airs and Equal Opporttunities. Neiither the Com mmission norr any perso on acting on its behalff is responsiible for the use that m might be mad de of the info ormation co ontained in this publica ation.. 2 Nove ember 2011.
(3) Europeaan Commission Emplloyment, Social Affairss and Inclusion Social Situation Obseervatory – Living Condditions and Income Disstribution 2011. Table e of Conte ents Abstrract ................................................................................................................................................ 4 1. Inttroduction ...................................................................................................................................... 5 2. Me ethodology ................................................................................................................................... 6 3. Sim mulating the e austerity measures m ................................................................................................ 9 4. The e effects of austerity measures m ................................................................................................ 15 5. Co oncluding re emarks ..................................................................................................................... 27 Referrences ......................................................................................................................................... 31 Appe endix 1: Aussterity meassures in 2009-11 .................................................................................. 33. 3 Nove ember 2011.
(4) Europeaan Commission Emplloyment, Social Affairss and Inclusion Social Situation Obseervatory – Living Condditions and Income Disstribution 2011. Absstract We compare c the distributio onal effects of austerity y measures that t have been b introdu uced in 6 EU countries in n the period d of large go overnment budget b defficits followin ng the 2007 7-8 finan ncial crisis an nd subsequ uent econom mic downtu urn. We explore the effe ects of polic cy chan nges presen nted as “aussterity meassures” in Esto onia, Ireland d, Greece, Spain, Portu ugal and the UK, usin ng the EU microsimulation model EUROMOD E and a the Irish h national model, m SWITC CH. The six countries c ha ave chosen n different policy mixes to achieve varying de egrees of fiscal consolidattion. We foc cus on the fiirst round efffects of inc creases in pe ersonal taxe es, cuts in spe ending on cash c benefiits and redu uctions in pu ublic sectorr pay acrosss the distribu utions of household incom me. There iss a range off important conceptua al and consiistency issue es to be addrressed when n doing suc ch analysis, particularly p in a compa arative setting. These in nclude how to identify “austerity “ m measures” in n a consisten nt manner, the relevan nt time perio ods to tual scenarrios and the scope of th conssider, the assumptions behind b the counterfac c he polic cies conside ered. Using a set of com mmon assum mptions we find that the burden of fiscal conssolidation brrought about through changes c in componen nts of household dispossable incom me is shared d differently y across the e income disstribution in the six coun ntries. At on ne extre eme, in Gree ece, the be etter off lose e a higher proportion of their incom mes than the poor and at the othe er, in Portuga al, the poorr lose a high her proportio on than the e rich. Bringin ng incre eases in indirect taxes in nto the pictture can alter conclusio ons about th he overall distrib butional efffect, increassing the cosst most for those with lo ower income and making the overa all incidenc ce of the me easures morre regressive e. JEL: C C81, H55, I3 Keyw words: Auste erity measurres, Europea an Union, Fisscal consoliidation, Pov verty,. Micro osimulation.. 4 Nove ember 2011.
(5) Europeaan Commission Emplloyment, Social Affairss and Inclusion Social Situation Obseervatory – Living Condditions and Income Disstribution 2011. 1. Introducttion The e economic crisis c which started s in 20 008 and the e austerity measures m to counter the e subse equent gov vernment bu udget defic cits are wide ely perceive ed to be having an imp pact on incom me poverty y and inequality. In this paper we ig gnore wide er aspects of the econo omic crisis on income distribution n, which are e considered d for examp ple in Jenkin ns et al. (201 11) and focus instead on n austerity measures m alone, comparing their size s and disttributional e effects in six EU U countries: Estonia, Irelland, Greec ce, Spain, Portugal and d the United d Kingdom. Gove ernment bu udgets were e extensively y affected by b the finan ncial and ec conomic criisis that starte ed in 2007. Of O the six co ountries ana alysed in thiis paper, thrree were running budg get surpluses in 2007 7 and anoth her two had d budget de eficits aroun nd the Stability and Gro owth o GDP. By 2009 2 only Esstonia had a deficit be elow that lim mit. The othe er five Pactt limit of 3% of had budget defficits much higher than n the EU-27 average a an nd around or o above 10 0% of GDP (see Figure e 1). Our cho oice of six countries c to analyse is based b on their being am mong those e in the EU with w the highest increasse in deficit and/or red duction in GDP G or employment within the period d since 2007 7. The degre ee of deficit reduction these six go overnmentss set out to ac chieve natu urally varied, and so did d the policy y mix chosen n to achieve it. Our analysis addrresses the question of how h reformss to direct p personal taxxes, cash be enefits and public p secto or pay have e been distrributed acro oss income groups and d types of ho ousehold, and a how they have impacted on risk k of poverty y. We also consider the incidence of changess to some e employer costs (socia al contributiions) and in ncreases in VAT, V across the househ hold incom me distributtion and discuss the challenge of measuring m t the incidenc ce of cuts in n in-kind bene efits and public service es. Figure e 1 Governm ment deficits as a a percenta age of GDP (2001-2010) (. Ne et government lending g (+) /borro owing (-) 4 2 0 -2. % GDP. -4 -6 -8 -10 -12 -14 -16 EU-27. -18. 20 001. 2002. EE 2003. IE E 2004. EL 2005 5. ES 2006. PT 2007. * -32.4. UK K 2008. 2009. 2010. Source e: Eurostat (lasst accessed on n 16 Septembe er 2011).. 5 Nove ember 2011.
(6) Europeaan Commission Emplloyment, Social Affairss and Inclusion Social Situation Obseervatory – Living Condditions and Income Disstribution 2011. A ran nge of impo ortant conceptual and d consistenc cy issues arise when doiing such an nalysis and these are re evealed cle early in a co omparative setting. The ey include how h to identtify “austterity measu ures” in a co onsistent ma anner, the time t period to consider, and the assum mptions beh hind the co ounterfactua al scenarioss. We exploit informatio on from a repre esentative sample of each nationa al populatio on, using miicro-data fro om the Euro ostat and national ve ersions of the e European Union Statistics on Inco ome and Liv ving Condittions he Family Re esources Surrvey for the UK. Simulattions of the effects of changes c (EU-SSILC) and th to pa ay, taxes an nd benefits are a provide ed using the e EU tax-ben nefit microsimulation model m EURO OMOD.1 cal The sstructure of this paper iss as follows.. Section 2 discusses d the e various methodologi m issues and briefly y describes EUROMOD. Section 3 introduces i t the austerity y measures taken in ea ach country y and highlig ghts those modelled m in this analysiss. Section 4 presents an n analy ysis of the distributiona d l effects of the t austerity y measures in the six co ountries and d shows how the differen nt policy mixxes have their own disttributional im mplications.. Section 5 conc cludes by pllacing this a analysis in th he context of o questionss about the effects of the econ nomic crisis as a whole,, by summa arising our policy releva ant findings and by exp plaining the caveats c to be b adopted d when interpreting the em.. 2. M Methodo ology There e are many analytical choices c and d assumptio ons to be made m when simulating the t effec cts of austerrity measure es on incom me. There are also choic ces to be made m in con nsidering how to measure e the impac ct and whatt indicators to use. Both h types of choice are particularly impo ortant when n making co omparisons across cou untries. On th he one han nd the same e choices sh hould be made in each country fo or valid com mparisons to o be made. On the other hand, the most appro opriate cho oice may va ary across co ountries, de epending on n the nature and timin ng of the measures tak ken. In addittion, possibiilities may be b limited du ue to lack of data in some s counttries, but not in others. In this paper we attempt to define e an equiv valent (com mparable) assessment a i each cou in untry. This builds on pre evious work which w took an essentia ally nationall perspectiv ve in each case c and co onsidered th he implicatiions of meth hodological difference es when inte erpreting ressults (Leventti et al., 2010 0). Amo ong the metthodologica al issues to be b confronted are the following: Which W meassures coun nt as austerity measures? What is the counterffactual, i.e. what do we w assume would w have e happened d to policiess without the e austerity measures? m W Which measures can be b assesssed across the income e distribution n, with a rea asonable degree of prrecision? To what exten nt can (and d should) ind direct effec cts and mac croeconomic changes be accoun nted for? W We conside er each in tu urn.. Whic ch measure es count as a austerity y measuress? In som me countrie es, such as G Greece, explicit packa ages of refo orms have been b labelle ed as auste erity measures. While mostly m involv ving tax incrreases and cuts in socia al benefits and a publiic sector pa ay, they also o include inc creases in some beneffits or reductions in taxe es for. 1. For Irreland this verssion of the pap per makes use of the nationa al tax-benefit model, m SWITCH H.. 6 Nove ember 2011.
(7) Europeaan Commission Emplloyment, Social Affairss and Inclusion Social Situation Obseervatory – Living Condditions and Income Disstribution 2011. certa ain groups to compenssate or allev viate the impact of oth her measure es. In any ca ase, the packkage as a whole w can b be easily ide entified. In o other countrries it is not so s clear how w polic cies would have h evolve ed in the ab bsence of th he budgetary crisis. In th he UK, for example, there e was a cha ange of gov vernment in mid-2010 and a the poliicy change es include, along gside meassures that might m have been b introdu uced by an ny government, cuts an nd restru ucturing of the t welfare system that arguably are a part of a new approach, some under the guise g of austerity. In general our ap pproach ha as been to focus f on changes that were explicitly introdu uced in orde er to cut the e public defficit, or stem m its growth.. Some of th he chan nges implem mented in a particular period that may be pa art of some other policy y agen nda and wo ould have a also happen ned in the absence a of the t fiscal crrisis are not conssidered. The e idea is to distinguish d b between changes that were part of o a “busine ess as usual” agenda from f those introduced i for austerity y reasons. In n particular the remova al of temp porary fiscal stimulus me easures is not considerred as part of o the auste erity packag ge if those e reforms were originally presented d as tempo orary. A sec cond area of o considera ation is wha at reference e time perio od to consid der for the changes. In som me cases measures m are e all announced and introduced within a sing gle year. In other case es, for instance in the UK K, measuress announce ed at one point (e.g. in 2010) may not be imple emented fu ully until muc ch later (e.g g. 2014). The ere are seve eral differen nt rationaless for the phassing of tax in ncreases an nd spending g cuts. One is to reduce e the risk of another (orr further) macroeconomic downturn n and soften n the blow for political feasibility f re easons. Ano other is relate ed to the lo ong term resstructuring of o the tax and welfare system. A th hird might be b to influe ence expec ctations and d therefore behaviour, particularly y in the finan ncial marke ets. Distin nguishing be etween these three typ pes of phasiing is difficu ult. Furthermore, it is posssible that the medium m term plan ns that are announced a will be reve ersed or am mended befo ore being g implemen nted as well as further measures m in ntroduced (e e.g. in Gree ece, Ireland d and Portu ugal during 2011).2 For this t reason we w limit the changes th hat we ana alyse to those alrea ady introduc ced (June, 2011). 2 We do d not harm monise the re eference pe eriod for the e chan nges becau use this natu urally differs across countries.. The c counterfac ctual The w way in which we simula ate the counterfactual scenario (i..e. “what would w have happ pened in the absence of the auste erity measures”) is critic cal to the ev valuation of their effec cts. We have chosen to o interpret the “absenc ce of the au usterity mea asures” as th he continuation of pre-austeritty policies, indexed according to usual u practiice (or law). Such indexxation is nott the same across coun ntries. Wherreas the UK has long-esstablished indexxation rules (Sutherland d et al., 2008 8) which are e changing g (Joyce and Levell, 2011), mostt of the polic cies in Eston nia, Ireland and a Greece e are not re egularly inde exed and in nstead are c changed oc ccasionally on an ad hoc h basis. In Portugal and Spain there is a mixx of regular indexatio on and ad hoc changes.. 2. One of the measu ures in the UK that will have e the largest eeffect, but onlly over time, is the decision n to T is likely to o have the effect of changge in the indexx used for indexation of benefits and taxx thresholds. This reduccing benefits and a tax‐free in ncome relativee to income as a whole. The effect of thiis is not evident in our short‐‐term simulations. 7 Nove ember 2011.
(8) Europeaan Commission Emplloyment, Social Affairss and Inclusion Social Situation Obseervatory – Living Condditions and Income Disstribution 2011. Furth hermore, in order o to neu utralise their effect, policy change es that are not n conside ered part of the “austerity y package” are also inc cluded in th he counterfa actual scen nario.. Whic ch measure es can be simulated? In mo ost countrie es austerity measures m ta ake the form m of some combination c n of: (i) redu uctions in ca ash benefits and public c pensions; (ii) ( increasess in direct ta axes and co ontributions;; (iii) incre eases in indirect taxes; (iv) reductio ons in public c services th hat have an n indirect im mpact on th he welfare of o households using the em; (v) redu uctions in pu ublic expenditure that cannot be allocated to householdss (e.g. pure public goo ods like defe ence spend ding) and inc creases e not straigh htforward to o allocate to o household ds; (vi) cuts in i public sector in taxxes that are pay (vii) cuts in public p secto or employm ment. The e eventual efffect on the public budget will be the t net effe ect of these changes. There T will be in nteractions. For example, reductio ons in public c sector pay y will serve to o reduce ta ax reven nue; increases in indire ect taxes will result in inc creased inflation and hence h (in so ome case es) increased d indexation of benefitts. The overa all result will also depen nd on any beha avioural or macro-econ m nomic seco ond and thirrd round efffects. In this analysis we e focus on th he direct, firrst round, effects of cha anges in cash payments and direc ct personal taxes and contribution ns. In addition to that, the t effects of public se ector pay cu uts are captured p cut is measured m ne et of any reduction for all countries except the UK.3 The efffect of the pay in inc come tax an nd social co ontributions. Where posssible and re elevant we also measu ure the effec ct of increassed employ yer contribu utions and draw d on ava ailable previous researc ch to show w, in broad and a approxximate term ms, the addittional effectt of indirectt tax increasses. A fully c comprehen nsive first-rou und analysiss would also o include th he effects off cuts in pub blic servic ces, taxes and a expend ditures that are a not straiightforward d to allocate e to households, and cuts in public sector em mployment. These mea asures are beyond b the scope of th he analy ysis in this pa aper but we e return to consider c the e implicatio ons of leavin ng them outt in later sections of this paper. p Furth hermore, som me of the changes c are e difficult to capture exxactly beca ause our datta are not sufficient. Where W possib ble, and esp pecially to maintain m cro oss-country comparabi c lity, plaussible approxximations have been made. m. Mac croeconom mic and sec cond orde er effects It is im mportant to o note that our o simulatio ons are effe ectively mea asuring the effects of th he auste erity measures on popu ulations with h pre-crisis la abour mark ket characte eristics. Marrket incom mes are adjjusted by so ource, in line e with actua al changes between th he period when w the data d were collected c an nd the “aussterity” yearr (see Table 1 below) but neverthe eless the size a and distribution of the effects e of th he austerity policies mig ght be some ewhat different once e unemploy yment increa ases and otther labour market cha anges due to t the crisis, directly. 3. In th he UK, while public p sector in nstitutions have had their budgets b cut, and a pay rises are a certainly restricted, r there is no figure fo or a specific pay p cut that caan be simulateed in this exerrcise. 8 Nove ember 2011.
(9) Europeaan Commission Emplloyment, Social Affairss and Inclusion Social Situation Obseervatory – Living Condditions and Income Disstribution 2011. or ind directly, hav ve been ac ccounted fo or.4 We migh ht expect th he effects of benefit cu uts to be amp plified and fo or tax and contribution c n increases to t be damp pened some ewhat. This isssue is distin nct from whe ether our an nalysis capttures the full effects of the t crisis, wh hich, as expla ained abov ve, we do no ot attempt to do. More eover, the austerity a me easures them mselves may induce sec cond order and a macro-economic effects. Forr example, households h facing incom me losses may m adapt their t behaviiour in an atttempt to compensate e, at least pa artly, for such adverse ch hanges in circumstances. For insta ance, those able to ma ay work long ger hourss or increase e their labo our supply in other wayss; young pe eople facing g drastic red ductions in living standard ds may retu urn to live with their parrents; reduc ctions in inco ome will lea ad to reduction in con nsumption and, a potenttially, a slow wer recovery y. These issues too are beyond b the scope of thiss paper whiich focuses on the first round effec cts of the au usterity mea asures alone e, under the e assumptio on of other things t being g equal (eve en when it is i clear thatt they are n not). Wider aspects a of the t crisis beyond the austerity mea asures are ig gnored, eve en though the latte er may argu uably aggra avate the fo ormer, at lea ast to some extent.. The E European tax-benefi t it model EU UROMOD Our a analysis makes use of EUROMOD, E which simulates tax liabilities and benefit entitllements for the househ hold popula ations of EU Member M Sta ates. EUROM MOD simula ates noncontributory cassh benefit entitlements e and direct personal ta axes and so ocial insuran nce contribution liab bilities on the e basis of th he tax-bene efit rules in place p and in nformation availlable in the underlying datasets. Market M incom mes and the taxes and d benefits which w are n not simulate ed (e.g. ben nefits which depend on n contributio on history) are a taken fro om the data a, along with h informatio on on other personal/ho ousehold ch haracteristic cs (e.g. age e and marittal status). See S Sutherla and (2007) and a Lietz an nd Mantova ani (2007) fo or further inform mation.5 Re esults for Irela and are bassed on SWITTCH, the Irish h tax-beneffit model, which w uses income concepts aligned with those of EURO OMOD (Callan et al., 20 011). 6 are In this analysis, so ome adjustments for non-take-up of certain benefits b e made for all coun ntries (assum med the sam me before and a after the austerity measures); m while tax ev vasion is assum med not to happen – itt is implicitly y assumed that t legal ru ules are univ versally resp pected and that the co osts of comp pliance are zero.. 3. Simulating the au usterity measures m s We focus on the e austerity measures m im mplemented d after the 2008 2 econom mic downtu urn and o mid-2011. However, the period in n which aussterity meassures were in ntroduced is i up to differrent across countries depending on o many fac ctors (includ ding the tim ming of the national n. 4. For iinstance, in Greece the uneemployment rate r for male workers w aged 30‐44 rose frrom 3.5% in 20 008 to 8.1% in 2010. 5. EUROMOD is currrently subject to a major up pdating process. All EU‐27 countries c in EUROMOD, using EU‐ d will be included by 20 012. SILC aas underlying data, 6. A recent study byy Matsaganis et e al. (2010) estimated thatt the non takee‐up of meanss‐tested beneffits for o the countriees examined here h (Greece and Spain) co ould be very exxtensive. Non n take‐up the elderly in two of d in the UK (seee for examplee Pudney et al., 2006). has beeen thoroughly researched 9 Nove ember 2011.
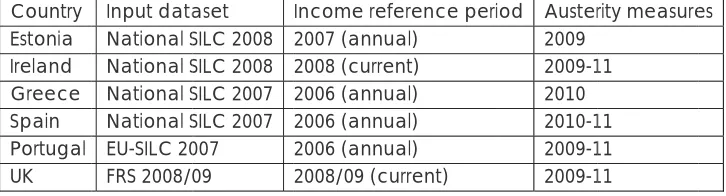
(10) Europeaan Commission Emplloyment, Social Affairss and Inclusion Social Situation Obseervatory – Living Condditions and Income Disstribution 2011. macroeconomic and budg getary reac ctions to the e financial crisis): 2009 fo or Estonia, 2010 2 for Gree ece, 2010-11 1 for Spain and a 2009-11 1 for Portuga al, Ireland and a the UK (see Table 1). 1 Table 1: Su ummary of input datase ets and periiod of analy ysis Country Estonia Ireland Greece Spain Portugal UK. Input data aset National SILC S 2008 National SILC S 2008 National SILC S 2007 National SILC S 2007 EU-SILC 20 007 FRS 2008/0 09. Income refe erence periiod 2007 (annual) 2008 (current) 2006 (annual) 2006 (annual) 2006 (annual) 2008/09 (cu urrent). Austerrity measure es 2009 2009-1 11 2010 2010-1 11 2009-1 11 2009-1 11. In ea ach case the level and distribution n of market incomes i is drawn d initially from datta from the re ecent, pre-crisis, past. For Greece, Portugal a and Spain th his is 2006 income data a from onal SILC, for Estonia itt is 2007 inco the EU-SILC/nati E ome data frrom the nattional SILC, for Irelan nd 2008 income data from f the national SILC and a for the UK it is 2008 8/9 Family Reso ources Surve ey data. In each e case market m inco omes are up pdated app propriately to t the polic cy simulation n year for th he baseline (to 2009 lev vels in Estonia, 2010 in Greece G and d 2011 in the re est of the countries). Th hese income es are then held constant and the e counterfactual and reform scen narios are simulated on n the same underlying distributionss of market income. We now n provide e a summarry of policy changes in each coun ntry. Further details on specific s chan nges are giv ven in Appe endix 1.. Eston nia The c crisis hit Esto onia in 2008 and in 2009 9 the govern nment started introduc cing austeritty measures in order to tackle e the increasing budge et deficit, bo oth by findin ng ways to increase reven nues and decreasing expenditure e es. Pensions and severa al cash bene efits were signifficantly incrreased in 20 006-08 follow wing the economic boom7, and th hese faced relatiively small cuts c by the end e of 2009 9. In fact, the flat rate element e of public p pensions was even e increa ased furtherr in April 200 09. In contra ast, on the re evenue side e, social insu urance contributions an nd indirect taxes were increased. There T were additional, one-off me easures like the sale of CO C 2 quota and a frontloa ading of EU grants from m the Cohession Fund. (H How these e affect peo ople individ dually is not possible to establish.) On O the expe enditure side e, publiic sector inv vestments and a salaries//wages werre reduced and public c services cu ut. The m main policy changes th hat are simu ulated in this paper are e the following.. 7. Mosst importantlyy, in 2008 the indexation of public pensio ons was changged – the weigght attached to t the growtth of average salary was inccreased relativve to the conssumer price in ndex (which has h been much h lower than salary s growth in recent yeaars) – and, add ditionally, the flat rate elem ment of public pensions wass increaased by more than 20%. An nother benefitt made notablly more generrous was the parental p beneefit, while smalleer scale increaases took placce for the subsistence beneefit (i.e. social assistance) an nd additional childcare leave for fathers. 10 Nove ember 2011.
(11) Europeaan Commission Emplloyment, Social Affairss and Inclusion Social Situation Obseervatory – Living Condditions and Income Disstribution 2011. . In ncreased so ocial insuran nce contributions (emp ployer, emp ployee, self-e employed) nd The suspension of creditted and em mployee contributions to t the 2 pe ension pillarr8 R Reductions in income ta ax deductio ons In ncrease in the t standard d rate of VA AT P Public secto or pay cuts. Polic cy changes which could d not be sim mulated inc clude cuts in n minor benefits and in minor tax allowances, a the increasse in the red duced rate of VAT and d excises. The b base scenario for Eston nia is the 200 08 policy sysstem with market m incom me (exceptt public secto or wages) and a pension ns uprated to t 2009 leve els. Note tha at the increa ase in public c penssions in 2009 9 is also inclu uded in the base scena ario becausse it is not considered tto be an auste erity measure. The reform scenario o is based on this, while e additionally simulating g the chan nges listed above. a. Irela and Durin ng the summ mer of 2008,, signs of a weakening w of the Irish economy e b became mo ore evide ent, and a substantial s d deficit in the e public sec ctor finance es emerged d. This promp pted the gove ernment to bring b forward the budg get for 2009 9 from its usu ual date (De ecember) to Octo ober 2008. In n order to capture c the full extent of o austerity measures m it is essential to include the cha anges introd duced in thiss budget. Th hus, the pre-crisis or pre e-austerity baseline b is pro ovided by policy p for 200 08. The austterity measu ures introduced in budgetary mea asures for 20 009, 2010 an nd 2011 (an nnounced in n Decembe er 2010 and implementted from January 2011) are therefore include ed in the sco ope of our study. s In bro oad terms, these t includ de the follow wing. . Lowering inc come tax ba ands and re eduction in tax credits The introduc ction of a ne ew income levy In ncreased so ocial insuran nce contributions (emp ployee, self--employed) C Cuts in all means-teste m ed and un niversal cash benefits and a free eze in con ntributory 9 b benefits P Public secto or pay cuts. 8. It is important to note that whiile the suspen nsion of creditted contributio ons did not afffect current evenue for the e governmentt. What it houseehold disposable income, itt was a significcant source off additional re basicaally entails is that t for those who are enro olled in the 2n nd pension pillar (and by no ow these are tthe majorrity of workers), the govern nment transfers one‐fifth off the pension insurance con ntributions (p paid by emplo oyers only) fro om the first to o the second pillar, p hence reducing the fu unds availablee for current public p pensio ons. Therefore, halting tem mporarily such h transfers hass helped to fill the hole in th he finances off the curren nt pensions att the expensee of future pen nsions. 9. Amo ong other thin ngs, a cash ben nefit entitled the Early Childcare Supplem ment was replaced by a new w, non‐ cash sscheme of sub bsidisation of places in earlyy child care fo or children age ed 3 years of age. This brings into sharp focus the issu ue of cash verrsus non‐cash provision of social s supportt (see e.g. Pau ulus et al., 201 10). In e overall impacct of policy measures, we have, h exceptio onally, include ed the value of o the order to assess the m the im mpact of the cut c in the cash h payment). non‐ccash subsidisation (which mitigates 11 Nove ember 2011.
(12) Europeaan Commission Emplloyment, Social Affairss and Inclusion Social Situation Obseervatory – Living Condditions and Income Disstribution 2011. In ad ddition there e were some minor cha anges to ind direct taxes and an inc crease in the e tax on depo osit interest in the perio od 2009-2011 which hav ve not been n simulated in the prese ent exerc cise becausse of data liimitations.100. Gree ece Afterr a decade of fast grow wth, the und derlying weakness of th he Greek ec conomy wa as made evide ent in October 2009, w when the inc coming gov vernment an nnounced that t earlier fiscal f data a had been misreported d. The fiscal deficit and d public deb bt estimates for 2009 were w revise ed to 15.4% % and 126.8% % of GDP re espectively. Financial markets m reac cted by incrreasing sprea ads on Gree ek bonds an nd by lowerring credit ra atings. Aimiing to reduc ce the public defic cit, the gove ernment announced a first package of auste erity measures in March h 2010, and a tax reform m in April 2010. When th hese failed to placate the marketss, a second d auste erity packag ge was ann nounced in May 2010 as a part of the negotiate ed rescue package p with the Europea an Commisssion, the Eu uropean Ce entral Bank and a the Inte ernational Mone etary Fund. 11 The m main policy changes th hat are simu ulated in this paper are e as follows: . . In ncrease in top income tax ratess (partly co ompensated d by decre easing tax rates r for lo ower bandss), changess in tax cred dits and allo owances and broadening of the income ta ax base The introduc ction of a on ne-off addittional tax on n incomes and a a speciial tax on pe ensions C Cuts in publiic pensions P Public secto or pay cuts In ncreases in the standard and redu uced rates of o VAT. Changes not captured c in n our simulations include increa ases in excise duties as a well as (m minor) redu uctions in tax t credits... 10. Thee revenue imp pact was modeest (e.g. indireect taxes conttributing not more m than 10% % of the increease reven nue over that period). p 11. A th hird package of o austerity measures m was announced a in June 2011 (kknown as “Urg gent measuress for the appliccation of the in nterim financial strategy frramework for the period 20 012‐2015”). Th he measures, appliccable from 2011but not cap ptured in our simulations, s include a redu uction of the in ncome tax‐freee bracket from € €12,000 to €5 5,000. All tax allowances a weere abolished (except the child c tax allow wance which was w reducced) and tax crredits were reeduced by 50% %. A special co ontribution off 1% to 5% waas imposed on n individ duals with inccome exceeding €12,000 an nd an annual entrepreneur e ship duty of €300 € to €500 p per year was leevied on self‐e employed and d liberal profeessions. Pensio oners’ solidarity contributio on was raised and suppleementary pen nsions were reeduced. Large e property taxx, vehicle tax, VAT V for restau urant servicess and excisee duties on heeating petroleum were also increased. So ocial insurance e contribution ns for unemplloyment beneffits were raise ed. In Septemb ber, the goverrnment annou unced the intrroduction of a new propertty tax on perso ons owning commercial or residential r pro operty, to be paid p via electrricity bills. An appeal againsst this law c by the Supreme Administrrative Court. Finally, F approxximately 30,00 00 civil is currrently under consideration servan nts are planne ed to be placeed on partial pay p by the end d of 2011. 12 Nove ember 2011.
(13) Europeaan Commission Emplloyment, Social Affairss and Inclusion Social Situation Obseervatory – Living Condditions and Income Disstribution 2011. Spaiin In ressponse to th he economic crisis, the Spanish go overnment introduced a fiscal stim mulus 12 packkage in 2008 8-09. In 20 010, as a response to prressures from m financial markets and d the Europ pean Comm mission due to its increa asing budge et deficit, a set of auste erity measures were e introduced d. Among other o things,, the 2010-11 austerity measures m pa artly reverse ed the fiscal stimulus (w which in this analysis are e not consid dered as pa art of austeriity measure es) and aime ed to reduce public expenditure by b €15 billion n. The ffollowing po olicy changes have been simulate ed. . The introduc ction of add ditional inco ome tax rate es for top ea arners C Cuts in, and freezing of,, cash bene efits Freezing of public p pensiions In ncrease in the t standard d rate of VA AT P Public secto or pay cuts. In ad ddition there e were the ffollowing measures tha at are not sim mulated: VA AT reduced d rates and excise dutie es were incrreased and d some regio onal govern nments eliminated or sc caleddown their bene efits and taxx credits.. Portu ugal We consider c as austerity me easures tax and beneffit changes and pay cu uts introduced betw ween 2009 and a 2011 tha at were pre esented by the t Portugu uese govern nment as exxplicit polic cy decisions taken to re educe the budget b defic cit. They inc clude: . In ncrease in income taxx rates, intrroduction of o an additional incom me tax rate e for top e earners, and d reduction of tax cred dits Freezing of nearly n all in nsurance be enefits and pensions and reductio on of mean ns-tested u unemploym ent assistan nce, family benefit b and d social assisstance. In ncrease in the t standard d rate of VA AT P Public secto or pay cuts. In ad ddition theree were the following f meeasures that are not sim mulated heree: VAT reducced rates and eexcise duties were increaased. Unite ed Kingdom m We consider c me easures intro oduced in th he period between b Ap pril 2009 and d June 2011. These exclu ude some measures m that were due e to happen anyway or o were intro oduced as p part of the political p dea al made in forming f the 2010 coalittion governm ment. We exclude e thesse (whic ch tend to reduce r tax revenue or increase sp pending) fro om the com mparison by including them both b in the base (“pre austerity”) and a in the reform r scen nario (“post. 12. Thee 2008‐09 fiscaal stimulus inccluded a new benefit for jo obless workerss who have exxhausted unem mployment insurance and un nemploymentt assistance benefits, a new w personal taxx credit, a parttial mortggage moratoriium for the un nemployed, th he right to exttend the duration of mortggage by two yeears free of chaarge, as well as a various otheer measures. 13 Nove ember 2011.
(14) Europeaan Commission Emplloyment, Social Affairss and Inclusion Social Situation Obseervatory – Living Condditions and Income Disstribution 2011. auste erity” which h is the 2011 system) in an a effort to focus on th hose designe ed to reduc ce the budg get deficit. It sho ould be note ed that the measures introduced by 2011 are e already kn nown not to o be the end of the story. Further, substantial me easures hav ve been announced, which w are lik kely to e a bigger effect e on tho ose with low wer incomess than those e with highe er incomes, but are have not due d to be im mplemented d until 2012 or later.13 The m main austerrity measure es introduce ed between n 2009 and 2011 2 which are simulatted are as fo ollows: . In ncreased so ocial insuran nce contributions (emp ployee, self--employed, employer) The introduc ction of an additional top t income e tax rate and withdraw wal of the personal p a allowance a high incomes at C Cuts in some e cash bene efits and taxx credits and increasess in others In ncrease in the t standard d rate of VA AT Freezing of lo ocal tax (Co ouncil Tax).. Othe er policy cha anges whic ch could nott be simulatted include certain cutts in cash be enefits.. Counterfactua al Our ssimulations compare c th he situation after the au usterity mea asures have e been intro oduced with that under a “business as usual” (c counterfacttual) scenario. This broa adly corresp ponds to the pre-auste erity policy system indexxed in the way w that is usually u assum med in polic cy anno ouncements and public c finance projections p in n the counttry concerned and/or iis written into the t law. The ese indexatiion assumpttions are the e following: Eston nia: No inde exation exce ept for penssions (indexed by a we eighted ave erage of CPI and wage e growth) Irelan nd: No inde exation Gree ece: No inde exation Spain n: No indexa ation excep pt for pensio ons (indexed d by CPI) Portu ugal: Indexa ation of mosst compone ents by CPI at a least (CP PI assumed). 13. Theese include fre eezing Child Benefit B rates in 2012 and 2013 2 and the savings s creditt part of Pension Credit for 3 more years; removal of Child Benefitt from higherr‐rate taxpayers; increase in the workking hours requirrement for co ouples in WTC C from 16 to 24; reforms to the medicaal test for Disaability Living Allowance A that w will reduce the e number of claimants c by 20%; 2 spendingg cut on Coun ncil Tax Benefiit; use of the CPI rather than tthe Retail Pricces Index to uprate u all ben nefits and mo ost tax/contrib butions (this will w tend to reeduce the size o of regular stattutory indexattion); limit co ontributory Em mployment an nd Support Alllowance to 12 1 months unlesss very disableed; impose beenefit cap of £500 £ per week per household (£350 perr week if singlle with no childrren); reduce HB H awards by 10% for some groups on Jobseeker’s Allowance for more m than 12 2 months . For a full list and more m detail see s Browne (2 2010; Append dix C). Analysis by Browne and Levell (2 2010) and hat these chaanges have a much more regressive r efffect than the measures Breweer et al. (2011) suggests th introd duced 2009‐11 1. 14 Nove ember 2011.
(15) Europeaan Commission Emplloyment, Social Affairss and Inclusion Social Situation Obseervatory – Living Condditions and Income Disstribution 2011. UK: In ndexation according a to statute orr assumption ns built into official fisca al projections (OBR, 2011; Annex C). Mainly by prices; p some e compone ents by earn nings; some componen nts not indexxed. In som me cases th he counterffactual scen nario that is simulated departs d som mewhat from m the (inde exed) actua al policy systtem before the austeritty measuress were intro oduced if so ome of the changes c we ere not relatted to auste erity. These exceptions e are noted above a and in Appe endix 1.. 4. The effec cts of aussterity me easures We consider c a number n of different d typ pes of effectts, using varrious measures. First, we e analy yse the size and composition of th he changes to cash be enefits, incom me taxes an nd contributions pa aid by worke ers (employ yees and self-employed d), public pay cuts (net of corre esponding tax t and con ntribution re eductions) and a also em mployer contributions an nd credited contrib butions, all of o which can be simula ated with EU UROMOD, with w the exce eptions outlin ned above and in the Appendix. A We W do not include i the effects of in ndirect tax incre eases at this point beca ause our info ormation on n this is deriv ved from otther studies and we are n not able to calculate c th he effects on o fiscal con nsolidation in i a consiste ent way. first, in term Seco ondly, the efffects on ho ousehold dissposable inc come are considered, c ms of the prop portional red ductions in in ncome acro oss the inco ome distribu ution and then in terms of the impa act on at risk k of poverty y rates. Since household d disposablle income iss not directly affec cted by employer or crredited con ntributions, changes c in these t are not included d in this analy ysis. Finally, we show w the effect of the VAT increase i by y expressing g it, together with the other measures analysed in this paper, p as a proportion of household disposab ble income.. Size and comp position of austerity packages p The e extent and composition of the “au usterity packages” ana alysed here is shown in Figure 2. Me easured as a percenta age of pre-a austerity tota al disposable income (in ( order to compare the sc cale across countries), c fiscal f conso olidation as a result of th hese measu ures taken together varies v from about 2% of o disposable income in n the UK to 8% 8 in Ireland d. It is 6% in n Estonia and between 2% and 3% % in Greece,, Spain and Portugal.14 Figure 2 alsso shows the re elative impo ortance of the t differen nt types of measure, m inc cluding emp ployer conttributions 15 and reductions in credited contributions. Com mparing acro oss countrie es, we can see s that the e relative importance of o the differe ent typess of measurre varies gre eatly. Pay cuts on publiic sector wo orkers (net of o taxes and d. 14. Sincce more auste erity measures are in the piipeline in som me of the coun ntries, but nott others, the aggregate a size of the measurees shown in th he figure shou uld not be inteerpreted as indicating the relative r extentt of fiscal olidation, thro ough the typess of policy sho own, in each country. c conso 15. Chaanges in creditted contributiions are only relevant for Estonia. Changges in employeer contributio ons are only rrelevant in Esttonia and the UK. 15 Nove ember 2011.
(16) Europeaan Commission Emplloyment, Social Affairss and Inclusion Social Situation Obseervatory – Living Condditions and Income Disstribution 2011. contributions) arre substantial in Ireland d, Greece and a Spain, amounting a t between to n 1 and 2 percent of total household disposable e income an nd, in the ca ase of Greece, more th han half of the net overa all effect sho own in Figurre 2. Increasses in social insurance contribution c ns are impo ortant in Irela and (only on workers), Estonia and d the UK (wo orkers and employers). e . Incom me tax incre eases consiiderably in all a countriess (except Greece), G and d particularrly in Irelan nd, Portuga al and Spain n, where the e increases are equivallent to more e than 1 percent of total disposable e income. In Greece inc come tax and a employe ee contribu utions decre ease afterr the austerity measures. This is to a small extent due to ta axes and co ontributions colle ected from pensions p wh hich were re educed. But it is mainly y due to the e fact that th he reform of the inc come tax sc chedule, as part of the austerity pa ackage, itse elf lead to a reduction in tax revenue. Overall, O expe enditure on n benefits an nd pensionss is reduced d in all coun ntries, partic cularly in Irelland, Greec ce and Porttugal. Beneffit and penssion reductions are less im mportant in n aggregate e in Estonia and the UK. Figure e 2 Aggrega ate effect off simulated austerity me easures as a percentage of total household dispo osable incom me, by type of policy. 9. 8.1. 8. % of disposable income. 7. 6.2. 6 5 4 2.2. 3. 2.7. 3.0 1.9. 2 1 0 -1 EE. IE. EL. ES. PT. UK. Pub blic sector pay (net). W Worker SIC. Income ta axes. Ben nefits and pe ensions. E Employer SIIC. Credited SICs. Source e: EUROMOD version v F4.19 and a SWITCH Note: The austerity measures m inclu uded here are limited to those that can be e simulated wiith EUROMOD.. Increases in indirect tax, cutss in public serrvices and som me minor tax--benefit changes (see text)) are not included. The t chart are the t aggregate e net increase in the public budgetary b balance as a pro oportion of numbers shown on the total h household disp posable incom me in each cou untry.. Figurre 3 shows how h the aussterity measures are disstributed by deciles of equivalised e 16 dispo osable income. Note that here we w assume that t increasses in emplo oyer contrib butions affec ct the releva ant employ yees’ incomes rather than on profitts or prices or wages generally and that reducttions in cred dited contrib butions affe ect current incomes ratther than pe ension. 16. Inco omes are equivalised usingg the modified d OECD scale. 16. Nove ember 2011.
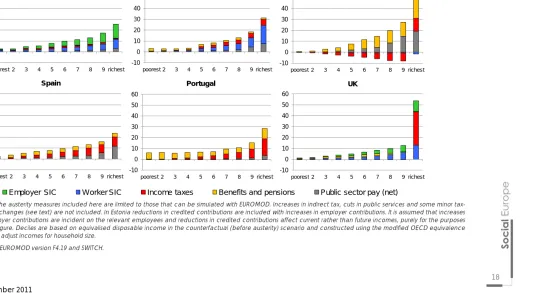
(17) Europeaan Commission Emplloyment, Social Affairss and Inclusion Social Situation Obseervatory – Living Condditions and Income Disstribution 2011. incom mes in the future. f Neith her are realistic assump ptions and Figure F 3 shou uld be interpreted 17 with this in mind. On this b basis, in all countries, c a larger proportion of the e fiscal conssolidation is assumed by y higher inc come house eholds than lower incom me househo olds. This is onlly to be exp pected since e the richerr households have a dissproportionate share of o total incom me in each country, so o even if taxxes were lev vied at a un niform rate, these t house eholds would pay more e. In particu ular, we find that the ric chest 10% off the popula ation accou unts for ween 24% (in n Spain) and d 54% (in the UK) of the e overall inc creased burrden includiing that betw due to employe er and crediited contrib butions. The share effec ctively paid by those in the uppe er half of the e income distribution ra anges from 70% in Portugal to 93% % in Greece. Neve ertheless, the contributiion of lowerr income ho ouseholds to o the fiscal consolidatio c on effort is nott negligible.. That is especially evident in Portu ugal, where the poorest three dec ciles each h contribute e about 6% of the overa all burden. Figurre 3 also sho ows a break kdown of the contribution made by b each by decile grou up, in terms of the com mponents sh hown in Figu ure 2. Here we can see e that in Gre eece, the effect of pay cuts c is conc centrated in n the upper part of inco ome distribu ution, while cuts in benefits (mainly pensions) are more e equally sprread. Most income gro oups actually benefit fro om the incom me tax cha anges and itt is only in th he top decile group tha at the tax burden rises. In the e UK, the effect of incre eases in con ntributions sshows up for the upperr half of the distrib bution while e the increa ase of incom me tax only affects the very top off the distribu ution.18 The rreductions in n the middle and botto om of the distribution d are a almost all a due to be enefit cuts. In Spain, Po ortugal and d Ireland, be enefits and pensions ha ave an effect at all poiints across the distrib bution, while e the effectts of public wage w cuts and the inc crease of inc come tax are a larger fo or richer dec ciles (there are a no chan nges to social insurance contributions in Spain n). In Estonia a, where the e main effe ect is from pay related elements: employer e an nd employee contrribution incrreases, inco ome tax and d public wa age cuts, a higher h share e of which comes fro om the top part of the distribution. The effect from beneffit cuts is ne egligible.. 17. Thee effects of theese changes are a shown at the t top of the bars in Figuree 3, to make factoring f them m out of the piicture relative ely straightforw ward. 18. Bro owne and Leve ell (2010) show w the large increase in tax in the top deccile group in the UK is itselff heavily skeweed to the top one percent. This is confirm med by our ow wn analysis, not reported here. 17 Nove ember 2011.
(18) European Commisssion Employyment, Social Affairs and Incluusion Social Situationn Observatory – Living Conditiions and Income Distribution 2011. Figure F 3 Relative contribution c to fisscal consolidation n by type of auste erity measure, by y income decile group g. Estonia. Ireland. Grreece. 60. 60. 60. 50. 5 50. 50. 40. 40. 40. 30. 30. 30. 20. 20. 20. 10. 10. 10. 0. 0. 0. -10. -10 poorest 2. 3. 4. 5. 6. 7. 8. 9 richest. -10 poorest 2. 3. Spain. 4. 5. 6. 7. 8. 9 richest. po oorest 2. 60 0. 60. 50 0. 50. 40 0. 40. 30 0. 30. 20 0. 20. 10 0. 10. 40 20 0 -20 r p23456789ri o c o h r e e s. 20 10 0 -10 poorest 2. 3. 4. 5. Employyer SIC. 6. 7. 8. 9 richest. W Worker SIC. 0. 0. -10 0. -10 poorest 2. 3. 4. Income taxes. 5. 6. 5. 6. 7. 8. 9 richest. 6. 7. 8. 9 richest. UK. 50. 30. 4. P Portugal. 60. 40. 3. 7. 8. 9 richest. po oorest 2. Benefitts and pensions. 3. 4. 5. Public sector pay (net). Notes: N The austerity y measures included d here are limited to t those that can be b simulated with EUROMOD. Increase es in indirect tax, cu uts in public service es and some minor taxbenefit b changes (se ee text) are not inc cluded. In Estonia re eductions in credite ed contributions are e included with incrreases in employer contributions. It is assumed a that increa ases in employer contrib butions are incidentt on the relevant em mployees and redu uctions in credited contributions c affect current rather tha an future incomes, purely p for the purpo oses of o this Figure. Decile es are based on eq quivalised disposab ble income in the counterfactual (befo ore austerity) scena ario and constructe ed using the modifie ed OECD equivalence scale s to adjust inco omes for household size. Source: S EUROMOD version F4.19 and SWITCH. S. 18 November N 2011.
(19) Europeaan Commission Emplloyment, Social Affairss and Inclusion Social Situation Obseervatory – Living Condditions and Income Disstribution 2011. Distriibutional effects e on household h incomes Altho ough better off househo olds pay a la arger share,, as noted above a this is only to be expe ected, and it does not signify s that the burden of o the meassures in relattion to their ability to pay iis also larger. The share of the total cost of the measures paid p by high her and lowe er incom me groups, therefore, te ells us nothin ng about whether the distribution d o the cost iss of equittable or nott. In order to o account fo or the greate er ability to pay of riche er household ds Figure 4 sho ows the average propo ortional chan nge in house ehold dispo osable incom me by decile e group caussed by the austerity a measures that have a dire ect bearing on househo old income. The effec cts of chang ges to emplo oyer and crredited conttributions arre not includ ded here. Th he results show w that the re eduction in in ncome due e to the mea asures is rela atively flat ac cross the inc come distrib bution in Esttonia and Sp pain (i.e. each decile groups g pays roughly the same prop portion of incom me). In the UK U the effec ct is also fairrly uniform up to the 9th decile grou up, but much larger at the top. The distribution d iss more unev ven in Ireland where the e proportion nal reduction in incom me is larger at the botto om as well as, a more esp pecially, at the t top. Pen nsioners, who are conc centrated in n the middle e decile grou ups, have had their income relatively well prottected. Portu ugal is the only country with a clearrly regressive e distribution n, with perc centage lossses that are c considerably y larger in th he first and second s dec cile groups than higher up the distribution. The o opposite is th he case in Greece, G where percenttages lossess are largestt for the top decile groups and thosse at the bottom pay re elatively little e. Figure e 4 Percentage change in n household disposable income due to t austerity measures m. 0 -2 2. %. -4 4 -6 6 -8 8 -10 0 -12 2 poorest. 2. 3. 4. EE. 5 6 income de ecile IE. EL. ES. 7. 8. P PT. 9. riche est. UK. Notes:: The austerity y measures in ncluded here are limited to t those that have a direc ct effect on household dispossable income (changes to direct d taxes, ca ash benefits an nd public secttor pay). They do not include e changes to employer or cred dited contributions. In additio on, increases in n indirect tax, cuts c in public services s and so ome minor enefit change es (see text) are a not include ed. Deciles arre based on equivalised e dissposable inco ome in the tax-be countterfactual (beffore austerity) scenario s and constructed c ussing the modiffied OECD equ uivalence scale e to adjust incom mes for househo old size. Source e: EUROMOD version v F4.19 and a SWITCH.. 19 Nove ember 2011.
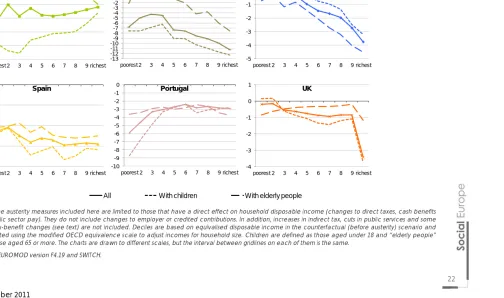
(20) Europeaan Commission Emplloyment, Social Affairss and Inclusion Social Situation Obseervatory – Living Condditions and Income Disstribution 2011. Figurre 5 distingu uishes the prroportional effect on ho ousehold in ncome in ea ach decile group g by th he three ma ain types of change: those in bene efits and pensions, thosse in income e taxes and contribution ns, and thosse in public sector pay. Cuts to be enefits and pensions p ha ave a particularly large e effect on householdss in the lowe er part of th he income distribution d in Portu ugal, Ireland d and Spain n. Interesting gly, results are a different in the case e of Greece e, indic cating that the t pension cuts do no ot have muc ch effect on n the incom me of poorerr households but are mainly concentratted in the up pper middle e part of the e distribution. The effec ct is relatively small and d similar acrross the botttom two thirds of incom me distributiion in Eston nia and the UK. The p pattern of th he distributio on of tax an nd contribution change es is quite different. d In Ireland I and to a lesser extent e in Portugal the re eductions in n disposable e income due d to tax and contribution increases are larger in the e upper parrt of the distribution. The e same app plies in the UK U but conc centrated in n the top de ecile group.. (The reduc ction in tax in the bottom decile group is due d to the freezing f of lo ocal tax.) While W in Estonia, the red duction is larrger in the fiirst decile group and th hen relative ely flat and d declining in the top half of the distrib bution, in Sp pain it describes a U-shape with ho ouseholds in n the upperr middle part of the incom me distributtion most afffected. In Greece, G mo ost people actually a gain from the income tax changes, c especially in the t middle of o the distrib bution, and it is only in the top dec cile group, that the tax burden rises. Finally, public se ector pay cu uts have a larger effec ct in the upp per part of the income distrib bution in all the countries where th hese apply, but the gra adient varie es, with the strongest effect in Ireland. (These ( are shown s net of o taxes and d contributio ons on the reduction - i.e. they take ac ccount of th he fact thatt the emplo oyees conce erned pay le ess tax beca ause they earn less – which w probably explainss why the efffect is not stronger s in the t top incom me groups where w taxes are higher.) It is a also of intere est to underrstand how the burden of the austterity measu ures is shared across differrent types of o household d. Figure 6 compares c th he proportio onal chang ge in disposa able incom me by decile group on n the whole population n (as in Figurre 4) with th hat on (a) people in households with h children (d defined as aged a underr 18) and (b) people in householdss containing elde erly people (defined ( as aged 65 orr more). In Greece G this latter group p loses more e proportion nately, rega ardless of the eir position in i the incom me distributiion. In the other o five coun ntries households with older o people e lose less th han all housseholds and d it is househ holds with children tha at tend to lo ose more, although a in Portugal P thiss only applie es at the bo ottom of the in ncome distrribution. In Estonia E the contrast c be etween the position of children c and d the elderrly is particu ularly striking g, especially y towards th he bottom of o the incom me distribution. In Gree ece children n are relativ vely well-pro otected, esp pecially tow wards the middle and bottom b of the distributio on. These efffects are pa artly due to decisions about a tax an nd benefit changes c that particularly affect child dren or elde erly people:: for example choices over o whethe er to reduce a child tax t credit orr a pension.. They are also a partly driven by the e compositio on of households acro oss the inco ome distributtions.. 2 20 Nove ember 2011.
(21) Europeaan Commission Emplloyment, Social Affairss and Inclusion Social Situation Obseervatory – Living Condditions and Income Disstribution 2011. Figure e 5 Percenta age change in i household d disposable income due e to austerity y measures by b type of meassure. Chan nges to beneffits and pens sions 2% 1% 0% -1% -2% -3% -4% -5% -6% -7% -8% -9%. EE. IE. EL. ES. PT. UK. Changes s to income tax and work er SICs 2% 1% 0% -1% -2% -3% -4% -5% -6% -7% -8% -9%. EE. IE. EL. ES. PT. UK. Pu ublic sector pay p cuts (nett) 2% 1% 0% -1% -2% -3% -4% -5% -6% -7% -8% -9%. EE. poorest. IE. 2. EL. 3. 4. ES. 5. 6. PT. 7. 8. UK. 9. richest. Notes:: The austerity y measures in ncluded here are limited to t those that have a direc ct effect on household dispossable income (changes to direct d taxes, ca ash benefits an nd public secttor pay). They do not include e changes to employer or cred dited contributions. In additio on, increases in n indirect tax, cuts c in public services s and so ome minor tax-be enefit change es (see text) are a not include ed. Deciles arre based on equivalised e dissposable inco ome in the countterfactual (beffore austerity) scenario s and constructed c ussing the modiffied OECD equ uivalence scale e to adjust incom mes for househo old size. Source e: EUROMOD version v F4.19 and a SWITCH.. 2 21 Nove ember 2011.
(22) European Commisssion Employyment, Social Affairs and Incluusion Social Situationn Observatory – Living Conditiions and Income Distribution 2011. Figure F 6 Percenta age change in ho ousehold disposab ble income due to t austerity measu ures: by type of household h 0. 3 2 1 0 -1 -2 -3 -4 -5 -6 -7 -8 -9 -10 -11 -12 -13. Estonia. -1 -2 -3 -4 -5 -6 poorest 2. 3. 4. 0. 5. 6. 7. 8. -1. -2 200.0% -3 0.0% -4. % poorest 2 -200.0 3 4. 5. -1 -2 -3 -4 -5 3. 0 -1 -2 -3 -4 -5 -6 -7 -8 -9 -10. Spain. 6. 7. 8. 9 richest. Greece. 0. pooresst 2. 9 richest. 1. Ireland. 4. 5. 6. 7. 8. 9 richest. poorest 2. 3. 4. 1. Portugall. 5. 6. 7. 8. 9 richest. 6. 7. 8. 9 richest. UK. 0 -1 -2 UK -3 -4 pooresst 2. 3. 4. 5. 6. 7. 8. 9 richest. poorest 2. 3. 4. 5. -400.0%. All. With children. With elderly people. Notes: N The austerity y measures included d here are limited tto those that have a direct effect on household h disposab ble income (chang ges to direct taxes, cash benefits and a public sector p pay). They do not in nclude changes to o employer or crediited contributions. In I addition, increasses in indirect tax, c cuts in public servic ces and some minor m tax-benefit changes (see text) are a not included. D Deciles are based on o equivalised disp posable income in the t counterfactual (before austerity) scenario s and constructed c using tthe modified OECD D equivalence scale e to adjust incomess for household size e. Children are defin ned as those aged d under 18 and “eld derly people” as a all those aged 65 5 or more. The charrts are drawn to diffferent scales, but th he interval between n gridlines on each of them is the same e. Source: S EUROMOD version F4.19 and SWITCH. S. 2 22 November N 2011.
(23) Europeaan Commission Emplloyment, Social Affairss and Inclusion Social Situation Obseervatory – Living Condditions and Income Disstribution 2011. Risk of poverty y The e effect of austerity measures on the e risk of pov verty, define ed as having g income below 60% o of the mediian, depend ds on how this t effect is calculated d. Given the e reduction in incom me at the bottom b of th he income distributions d we might expect e the risk r of poverty to rise, if i a fixed po overty thresh hold is used. However, if the poverrty threshold d is allowed to shift with median inc come (i.e. to o decline ass median income decliines), and given g the inc come reductions in the e middle of the distribu ution shown in Figure 4, it is not clea ar what to expect e in terrms of relative poverty risk after the e austerity measures m arre introduce ed (other th hings rema aining the sa ame). Table e 2 shows the change in poverty risk using botth a fixed poverty thresshold and one that fallss as income e is reduced d and confirrms that kee eping the th hreshold the same as beffore, the pro oportion at risk of pove erty rises in each e countrry. It does so o most in Ireland (3.7 pe ercentage points) p and Portugal (2 2.0) but by le ess than one percenta age pointt in the othe er countries. In all coun ntries, excep pt Greece and a the UK, the proporttion of child dren at risk rises conside erably, espe ecially in Ireland. The risk of poverty y also increa ases among the work king age po opulation esspecially in Ireland and d Portugal and a to a lessser exten nt in Estonia a and Spain. The propo ortion of older people at a risk increa ases by less, but mostt in Portugall, Greece and Spain an nd actually falls a little in Ireland. Table e 2: Risk of po overty rates before b and affter the introd duction of au usterity measu ures. EE IE E EL E ES PT UK Risk of poverty rate before e 15.3 12.4 4 20.4 18.6 18.5 16.6 Risk of poverty rate after (ffixed threshold) 16.2 16.0 0 21.1 19.6 20.5 16.6 Perc centage po oint change e in risk of po overty rate relative to base b scenario by age All 2.0 1.0 3.7 7 0.7 1.0 0.0 3.2 --0.5 0-17 2.2 5.0 0 0.3 1.2 18-64 0.8 3.8 8 0.6 0.9 1.4 0.0 2.8 65+ 0.1 -0.7 7 1.3 1.1 0.4 Cha ange in med dian equiva alised incom me (%) -2.9 -7.6 6 -1.2 -2.7 -2.0 --0.8 Pov verty rate affter (relative e threshold) 14.9 11.9 9 20.3 18.3 19.6 16.1 Perc centage po oint change e in risk of po overty rate relative to base b scenario by age 1.1 --0.4 All -0.4 -0.5 5 -0.1 -0.3 0-17 1.0 -0.4 4 -0.6 -0.2 2.5 --1.1 18-64 -0.1 -0.2 2 -0.2 -0.1 0.8 --0.3 65+ -3.2 -1.9 9 0.7 -0.8 1.0 --0.2 Notes:: The austerity y measures in ncluded here are limited to t those that have a direc ct effect on household dispossable income (changes to direct d taxes, ca ash benefits an nd public secttor pay). They do not include e changes to employer or cred dited contributions. In additio on, increases in n indirect tax, cuts c in public services s and so ome minor tax-be enefit change es (see text) a are not included. Risk of po overty rates are a calculated d as the percentage of peoplle in the releva ant group with h equivalised household h inc come below 60 0% of the med dian, using the e modified OECD D equivalence scale. The fixe ed threshold iss calculated using u equivalise ed disposable e income in the base, or countterfactual (pre-austerity), sce enario. Source e: EUROMOD version v F4.19 and a SWITCH.. Not ssurprisingly, median equivalised inc come decliines in all co ountries as a result of th he auste erity measures. If the po overty line iss recalculatted on the basis b of the median aftter the measures have been imposed, overall risk of pove erty rates arre broadly unchanged u d or fall a little iin all countrries, exceptt Portugal. By B age grou up, increase es in the risk of poverty a among. 2 23 Nove ember 2011.
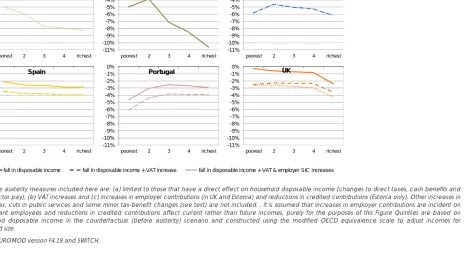
(24) Europeaan Commission Emplloyment, Social Affairss and Inclusion Social Situation Obseervatory – Living Condditions and Income Disstribution 2011. those e of working g age and the t elderly are a notable e in Portugal as is the su ubstantial re eduction in the e risk of pov verty among g the elderly y in Estonia and Ireland d.. Indirrect taxes In som me of the countries c the ere have alsso been changes to indirect taxess that we ca annot model in detail (because EUROMOD’s input database (EU-SILC) does no ot include d data on expe enditure). Ho owever, dra awing on otther researc ch, it is possible give an indication of the size a and inciden nce of the effect e of increases in VA AT across th he income distribution d . Using g external in nformation for f Estonia, Portugal, P Sp pain and the e UK on the e incidence of VAT by income decile group an nd assuming g that there was no cha ange in pre e-tax expenditure or in pre e-tax relativ ve prices, we e have estim mated the increase i in standard ra ate VAT as a 19 prop portion of dissposable inc come. Forr Greece, th he effects of o changes in i all rates of o VAT have e been estim mated from a previous study using g micro-data a from a Grreek Househ hold Budg get survey (D Decoster ett al., 2010; Matsaganis M and Leventti, 2011).20 In Esttonia and Spain the ma ain VAT rate e increased by two perrcentage points; in the e UK the incre ease was 2.5 5 percentag ge points; in n Portugal itt was 3 perc centage po oints and in G Greece the in ncrease in the t main ratte was 4 pe ercentage points, p plus 1 and 2 perrcentage po oint incre eases to the reduced ra ates. Assuming the incrreases have e a proportio onal incidence, we 21 find that t in each h of the cou untries, the effect e is reg gressive. Th his is most clearly so in Greece G wherre the extra tax represe ents almost 5.6% of hou usehold inco ome in the bottom b quin ntile group and 2.7% in the top quintile q grou up. The corrresponding figures for the t other co ountries are, for f Estonia: 1.5% and 1.1%; for Spa ain: 1.4% and d 1.1%, for Portugal: P 1.4 4% and 1.0% % and for th he UK: 2.2% and 1.2%.222 The c combined effect e of the e VAT increa ase and of the t change es simulated d with EURO OMOD (direct taxes, be enefits and pensions, and public se ector pay) is i shown in Figure F 7 (da ashed. 19. Thee studies used d are, respecttively, for Esto onia: Vork et al. (2008), fo or Spain: Serraano (2001) an nd for the UK: B Barnard (2010 0). For Portugal we carried out our own n approximations based on n information from the 2005//06 Household Budget Surrvey on the distribution d o expenditure by COICOP of P categories by b income quintiile group. VATT was calculated based on the t most usuaal VAT rate applying to each h spending category. 20. Theere were no su ubstantial chaanges to VAT in Ireland in th he relevant peeriod, althouggh it is due to rise in 2012. 21. Loo oking at the efffect of taxes paid p on the baasis of recorded spending patterns p as a proportion p of recorded houseehold income can distort th he view of the regressivity or o otherwise of o indirect taxxes, and especcially the effectt at the bottom m of the incom me distributio on. See Brown ne and Levell (2010). ( 22. Thee relative degrree of regressivity across co ountries is duee to (a) differe ences in the sttructure of VA AT and how itt relates to co onsumption patterns (i.e. th he extent to w which goods with w lower tax rates are con nsumed by tho ose on low inccomes) and (b b) the effective savings ratee across the in ncome distribu ution. For Greeece, spend ding is much higher h than inccome in the lo ower income decile groups. The same teends to apply in i the other countries, bu ut to a letter extent. e 2 24 Nove ember 2011.
(25) Europeaan Commission Emplloyment, Social Affairss and Inclusion Social Situation Obseervatory – Living Condditions and Income Disstribution 2011. line), contrasted d with the efffect of the income ch hanges alon ne (as in Figu ure 4: solid line).23 Given the appro oximations and a the assumptions about incide ence made, we canno ot draw firm c conclusions. Neverthele ess, in all five countries where VATT rates were raised, the regre essiveness of o the increa ased VAT ac cross the inc come distrib bution affec cts the conc clusions we m might draw about the distributiona d al effects of the austeritty measuress. In Spain, Estonia E and the UK the proportion p o income contributed of c d to the austterity measu ures by thosse on ncomes is now n increased relative to the conttribution by those on high incomess. 24 The low in very strongly pro ogressive na ature of the Greek mea asures beforre including g the effect of VAT rises iis transformed into a U--shaped pic cture involviing large lossses for the bottom two o decile groups in particu ular. The pe ercentage lo osses amon ng the low in ncome Gree ek population are simila ar in scale to o those for the t Irish low w income po opulation (w where there are no VATT incre eases). In a tthird step we w add the effects e of increased em mployer con ntributions and a reduced contribution cre edits (dotted d lines), mak king further,, strong assu umptions ab bout the inc cidence of these effects (see above e). If these assumptions a s are valid – and this, it should be emphasised is open o to que estion – adding these in ncreases to employer costs c and reductions in cre edits to futu ure pensionss to the othe er current lo osses experie enced by th he employees in qu uestion wou uld have the e effect of in ncreasing th he progresssivity of the combined measures in the two countrries where th hey apply (Estonia and d the UK) an nd espe ecially in Esto onia where the size of the t effect iss large, bring ging the “lo oss”, in termss of a prop portion of ho ousehold inc come, to a level similarr to that in Irreland for th hose on mid ddleuppe er incomes. On th he one han nd the fact that t the size e and distrib bution of the e combined d effect dep pends on ho ow compre ehensively th he analysis is i able to co over all the relevant au usterity mea asures, make es definitive e statementts about the e relative efffects of aussterity across countries difficult. On th he other ha and, our estimates of th he effects off VAT increa ases are approximate. And while e EUROMOD D simulates the t size of the changes to employ yer and cred dited contriibutions quite e precisely, our o assump ptions aboutt the inciden nce of these, as well as the incide ence of the VAT V change es are necessarily quite e tentative c compared with w the pre ecise analyssis we are a able to carrry out on the e incidence e of change es to direct taxes, t cash benefits an nd publiic sector pa ay. Even mo ore tentative e would be an analysiss that attem mpted to inc clude the effects e of cu uts in public c services, which w are disscussed in the next sec ction.. 23. Notte that by com mbining the reesults in this way w we assume that the com mposition of the t decile groups in the two d data sources are the same Both B sets of caalculations usee a very similaar concept of household dissposable incom me and the sam me equivalencce scale. How wever, the factt that different surveys are used means that t there are bo ound to be some differencees in the comp position of thee income deciles. In particu ular the study in indireect taxes that we use for Sp pain is more th han 10 years old. o Our resultts should be viewed v with caaution, thereffore. 24. Bro owne and Leve ell (2010) also o find these efffects for the UK U changes in n indirect taxes. 2 25. Nove ember 2011.
(26) European Commisssion Employyment, Social Affairs and Incluusion Social Situationn Observatory – Living Conditiions and Income Distribution 2011. Figure F 7 Austerity y measures as a percentage of h household dispossable income by quintile group: changes c to incom me components,, VAT increases and a changes c to emplo oyer contribution ns 0% -1% -2% -3% -4% -5% -6% -7% -8% -9% -10% -11%. 0% -1% -2% -3% -4% -5% -6% -7% -8% -9% -10% -11%. E Estonia. poorest. 2. 0% -1% -2% -3% -4% -5% -6% -7% -8% -9% -10% -11%. 3. 4. ric chest. poorest. 2. 3. fall in disposable income. poore est. 0% -1% -2% -3% -4% -5% -6% -7% -8% -9% -10% -11%. Spain. 4. ric chest. 0% % -1% % -2% % -3% % -4% % -5% % -6% % -7% % -8% % -9% % -10% % -11% %. Ireland. 2. 3. 4. richest. 2. 3. fall in disposable income + VAT increase. poorest. 2. 0% % -1% % -2% % -3% % -4% % -5% % -6% % -7% % -8% % -9% % -10% % -11% %. Portugal. poore est. Greec ce. 4. richest. 3. 4. richest. 3. 4. richest. UK. poorest. 2. fall in disposable income + VAT & emplo oyer SIC increases. Notes: N The austerity y measures included d here are: (a) limitted to those that ha ave a direct effectt on household disp posable income (ch hanges to direct ta axes, cash benefits and a public p sector pay), (b) VAT increases and a (c) increases in n employer contribu utions (in UK and Esttonia) and reductio ons in credited conttributions (Estonia only). o Other increase es in indirect tax, cuts in public services and d some minor tax-b benefit changes (se ee text) are not inc cluded. . It is assum med that increases iin employer contrib butions are incident on the t relevant emplo oyees and reductio ons in credited con ntributions affect current c rather than future incomes, pu urely for the purpo oses of this Figure Quintiles Q are based d on equivalised e disposa able income in the e counterfactual ((before austerity) scenario s and consstructed using the modified OECD e equivalence scale to adjust incomess for household h size. Source: S EUROMOD version F4.19 and SWITCH. S. 26 November N 2011.
Figure

+2
Related documents
This paper also contributes to the literature related to theories and models of technology adoption and acceptance which have recommended to be expanded to new contexts by
Bohm Commercial Real Estate is a small quality group of individuals with a dedication to ongoing commercial, industrial and investment real estate education and to clearly identify
Levels of testosterone, dehydroepiandrosterone and estradiol differed significantly between the hotspot and non-sprayed region, but there were no correlations between levels of
This paper is aimed to verify whether the knowledge and beliefs of female medical freshmen about HIV infection, their personal risk perception, and their sexual behaviour differs
The aim of the evaluation was to assess the impact of PEP on peer educators and student trainees on: student emotional and behavioural difficulties; perception
Against this backdrop, this study explores the nature and extent of employee training and development in small and medium-sized manufacturing organisations in Greece and explains
Service report, since 1993 (when the top statutory rate was set at 35 percent), the effective corporate tax rate — that is, the share of total corporate profits that is paid to
