403
Generating Summaries of Sets of Consumer Products:
Learning from Experiments
Kittipitch Kuptavanich Department of Computing Science
University of Aberdeen Aberdeen, UK
Ehud Reiter
Department of Computing Science University of Aberdeen
Aberdeen, UK [email protected]
Kees Van Deemter Utrecht University
Utrecht, NL
Advaith Siddharthan Knowledge Media Institute
The Open University Milton Keynes, UK
Abstract
We explored the task of creating a textual summary describing a large set of objects characterised by a small number of fea-tures using an e-commerce dataset. When a set of consumer products is large and varied, it can be difficult for a consumer to understand how the products in the set differ; consequently, it can be challenging to choose the most suitable product from the set. To assist consumers, we generated high-level summaries of product sets. Two generation algorithms are presented, dis-cussed, and evaluated with human users. Our evaluation results suggest a positive contribution to consumers’ understanding of the domain.
1 Introduction
When presented with a large amount of data in tabular form, an additional textual summary could aid a reader’s comprehension of the other-wise overwhelming information at hand. The task of automatically creating a summary from numer-ical data is an ongoing research area within Natu-ral Language Generation (NLG). We explored this task in the context of generating a textual summary describing a large set of objects [products] from a large database, where each object is characterised by several product features.
Product set overviews can be written by hand if the category is known beforehand. For exam-ple, manually written product reviews often start with an overview paragraph that discusses a wider set of products of which the product is a member. However, when a consumer searches for products
with keywords or through filters (e.g. on an e-commerce website), an overview of the returned set of search results would have to be automati-cally generated.
In this paper, we test the hypothesis that au-tomatically generated textual summaries can be of benefit to customers. This can be seen as a specific instance of Shneiderman’s Visual Infor-mation Seeking mantra (Shneiderman, 1996) of “Overview first, zoom and filter, then details-on-demand”. One of the main ideas presented there is that it is beneficial for a reader to be exposed to an overview of the information before diving into specific details of interest.
There have been related NLG research about sets of objects, although with different goals or fo-cuses. For example, to refer to or identify a set of objects within a larger set (Van Deemter,2002), to perform a data-to-text analysis of tabularized data by records1, to generate a page title for set items with shared characteristics from existing metadata (Mathur et al., 2017), or to address the issue of missing data encountered in summarisation ( In-glis et al.,2017). In contrast, our work explores summaries that describe commonalities and differ-ences within a set in order to help a user make in-formed decisions in selecting an object from the set. Our work focuses particularly on Content De-termination step in the NLG pipe-line (Reiter and Dale,2000), including selecting features and val-ues to be presented.
2 Analysis of Hand-written Reviews
To inform our algorithms, we manually anal-ysed 30 hand-written reviews gathered with the search term “best TV review” on Google. We used
the 30 top ranked pages which contained a list of TVs (not just one single product). We then de-fined a per-clause tagging scheme to identify as-pects that could be generated from product specifi-cations and to systematically observe how review-ers described sets of products. In our scheme, a clause could have multiple tags. There was one annotator involved in the tagging (the first author). Our finding are summarised below.
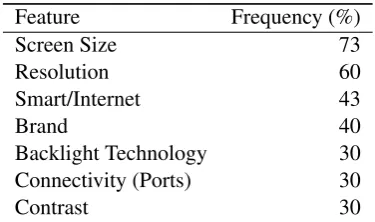
Feature Selection: We analysed how often each product feature gets mentioned in the reviews. We found, as shown in Table 1, besides the price, the most frequent features (in descending order) are screen size, resolution, smart/internet feature, brand, backlight technology, ports, and contrast.
Feature Frequency (%)
Screen Size 73
Resolution 60
Smart/Internet 43
Brand 40
Backlight Technology 30
Connectivity (Ports) 30
[image:2.595.87.275.285.396.2]Contrast 30
Table 1: Frequency Count of Features in Reviews
Price Description: The product price in the re-views are typically mentioned only vaguely, us-ing terms like “desirable price”, “cheap”, “expen-sive” or “premium”. The description is vague even when numbers are involved e.g. “around £300”. But when a crisp description is used it is more of-ten found in the form of stating the starting point, e.g., “you can get a 1080p TV starting at £270” or the maximum e.g. “Discover the best 32 inch Smart TVs under £300 here”.
Description of a Set of Items: Usually in a review, only a small number of sentences ex-plicitly describe the set as a whole, for exam-ple “Most 32-inch TVs these days are labeled as
HD Ready”. When they do they uses quantify-ing words like “most”. Numbers are described vaguely e.g. weight is mentioned as “light” or “re-sponse time” is either “fast” or ”slow”. Some fea-tures, for example the screen size, are mentioned both as exact numbers and vague description.
Price–Features Relationship: The relationship with price is used as a secondary justification to the features that the reviewers already think im-portant, for example, “A TV with a 1920×1080
resolution [are] not even that much more expen-sive” or “good image quality and available smart features [...] carry a price premium.”
Based on this analysis, we decided that our summaries should describe the shape of the price curve, the important features, and the effect of these features on price.
A large part of the reviews gathered included domain knowledge, for example, descriptions of technical terms and other insights. This part of the reviews clearly could not be produced from spec-ification table. There were also mentions of fea-tures that can be, non trivially, derived from the table, e.g. picture quality (which can be based on columns like resolution and contrast).
3 The Algorithms
3.1 Alg1. Summarising a set of products
In our previous work (Kuptavanich,2018), we pre-sented an algorithm (called Alg1 here) to gener-ate summaries consisting of (a) the shape of the price curve, (b) common features within the set and (c) features that influence price (Figure1gives an example of the generated text). The algorithm mainly used the influence of a feature on the prod-uct price to determine its importance.
Figure 1: Alg1 Summary Example
3.2 Alg2. Dynamically summarising and contextualising a set of products
Alg1 only included content that could be gen-erated from descriptions of items in a set being summarised. Following our analysis of the hand-written reviews, we adapted the algorithm. The resulting Alg2 allows for dynamic creation of sets through the use of feature filters and the contextu-alisation of these sets with respect to the unfiltered wider set as described below.
show a situation where the user has filtered the set of TVs to those that are 40–59 inches with 4K ul-tra high definition. The underlined portion is gen-erated only by Alg2.
Description of Important Features: In the TV domain, the following features occurred most frequently: display size, display resolution, smart/internet feature, support content service, brand, display technology, connectivity technol-ogy (ports) and HDR. We therefore focussed on these features, but generated more detail about them than in Algo1. The description of each fea-ture consisted of two parts. The first used quan-tifiers to describe the common values for the fea-ture within the set. The second compared the me-dian price of products with the said feature values against the median price of general products in this category and reported feature values that impacted on price (Figure2).
Figure 2: Our Description of Important Features
(a) Quantifiers. Here we generated expressions such as “Most products in the result are...” If the values of a feature are continuous numbers e.g. weight, we report them in the same fashion as the price (i.e. range and median value). Otherwise, we use the quantifiers “most” (more than 50%), “a large proportion” (more than 25%) and “some” (more than 10%).
(b) Comparatives and Qualifiers. In the sec-ond part, we also use phrases such as “more expen-sive” , “less expenexpen-sive” or “about the same price” (when the difference is less than 5%). If the dif-ference falls between 5 - 10%, we qualify this us-ing the word “slightly”. This generates texts such as“TVs with Smart-Internet Feature are generally slightly more expensive (£475 vs £450).” (Fig-ured3, in the next section).
The processes from document structuring through realization was carried out through tem-plate/schemata approach (McKeown,1985). Also, the tone of the discourse is primarily to provide factual product overview without trying to be per-suasive. Both algorithm were implemented using the Jinja22template engine.
2jinja.pocoo.org
4 Evaluation Experiment
Our previous work (Kuptavanich, 2018) vealed difficulties designing a suitable task that re-flected real consumer behaviours in the task based experiments, but a promising result with human rating. We therefore decided only to focus on hu-man rating evaluation3. The scenario of interest is where a consumer is searching for products on an e-commerce website. Our Laboratory Human Rat-ings Evaluation experiment had three goals. First, we wanted to find out whether the text summaries generated by Alg2 were preferred over those gen-erated by Alg1, and also over the static introduc-tory text provided on the e-commerce site. Sec-ond, we asked the participants to identify parts of the summaries that were useful, parts that were un-necessary, and what they want to see added. Third, we wanted to also find out what product features are important in the decision-making process.
4.1 Method
Materials: We scraped TV product data from Amazon UK4 during May - June 2018 to obtain 1478 products. We used this database to generate the summaries using both Alg1 and Alg2. As our baseline, we used Amazon’s static text provided on their TV browsing page. An excerpt is shown in Figure4. The full text can be found on Amazon UK TVs5page.
We used two product search scenarios on Ama-zon UK, based on its search filters. Each scenario produced a different set of search results and thus generated different summaries for Alg1 and Alg2.
Participants: Participants were 18 graduate stu-dents in Computing Science and Chemistry De-partment of University of Aberdeen recruited through the departments’ internal student mailing lists.
Design and Procedure: In total, there were 2 pre-determined product search scenarios:
• Scenario 1: 40 – 59 inch TVs with Ultra HD
• Scenario 2: TVs of any size that are smart TVs First, summaries [amz], [alg1], and [alg2] were presented in random order. To ensure that partici-pants engaged with the task, each participant was asked to select one product. Then they were asked
3
https://ehudreiter.com/2017/01/19/types-of-nlg-evaluation
4
www.amazon.co.uk
5
Figure 3: [alg2] Summary Example
Figure 4: An Excerpt from the Baseline Summary
to rank the summaries; “Please rank the sum-maries (#1 being most useful)” Then, they were asked 3 free text questions:
[Q1]: “From the summaries above, which part do you think is most useful? (please quote)” [Q2]: “What would you like to see added to the
summaries?”
[Q3]: “Which part do you think is not necessary?”
After the 2nd scenario was completed, we asked the participants to select 3 products they liked. Then we asked:
[Q4]: “When buying a TV which feature do you think is most important?”
[Q5]: “What information do you think should be in a summary?”
[Q6]: “What kind of summary would help you choose a good TV?”
For [Q4], participants could choose from a list with the following choices: price, screen size, sup-ported content service, smart/internet, resolution, Freeview, connectivity (ports) and also could spec-ify their own features.
Hypotheses: Our research hypotheses were: [Hyp1]: Participants prefer the [alg2] summary
over the baseline [amz] summary
[Hyp2]: Participants prefer the [alg2] summary over the [alg1] summary
4.2 Results
[image:4.595.308.524.492.560.2]Summary Preference: The number of times each summary was ranked first, second or third in the 36 trials is as shown in Figure5. The average ranking of each algorithm 1.47 [alg2], 1.81 [alg1], and 2.72 [amz] respectively.
Figure 5: Ranking Counts of Each Algorithm
Out of all 36 trials, there were 31 (86.11%) where the participants preferred [alg2] over [amz] and 24 (66.67%) where the participants preferred [alg2] over [alg1].
A Friedman (1940) analysis of the rankings confirmed that the distributions of rankings were different for [amz], [alg1] and [alg2] (p-value of 2.8×10⁻⁷). A post-hoc Friedman Aligned Ranks test (García et al., 2010) showed that [alg2] was significantly better than [amz] (p-value of1.09×
Free Text Answer: Many responses (7 in total) asked for the summary to be short and precise or even bulleted. Furthermore, to [Q1] most partic-ipants found the price range and the relationship between price and features useful, which was sup-ported by the data in the ranking. For [Q2], par-ticipants wanted to see product rating and other features, e.g. display frequency, model year or warranty added to the summary. They wanted to see some explanation of the technical terms and/or specification (e.g. what a smart TV is and what it can do). To [Q3], most participants did not find the Amazon summary useful and thought that it was not necessary. To [Q4], participants emphasized price (14 counts), screen size (11 counts), res-olution (10 counts) and smart/internet feature (8 counts) when buying a TV. To the questions [Q5] and [Q6], participants thought that the features and their descriptions (including terminology expla-nations), how the features impact the price, user reviews, and information about warranty make a good summary.
5 Discussion and Future Work
Generalisation of our findings – which were based on only a very small set of scenarios – is tricky: we do not know whether they generalise to different kinds of products (e.g., groceries or paintings) and to product sets of different sizes (e.g. a set of just 3 products). However, our re-sults suggest that customers find high-level prod-uct set summaries of the type we investigated more useful than Amazon’s static product cate-gory overviews. This was further confirmed by the free text question where many participants quote substantial parts of [alg2] summary as being use-ful.
In future, we aim to experiment with refine-ments and extensions of [alg2]. For instance, in order to expand the algorithm work with various product domains, an automation of the analysis of hand-written reviews has to be implemented.
Additionally, based on participants’ comments, technical information (as canned text) could also be included into the summary.
Since a number of readers pointed out that the summaries generated by [alg2] were too lengthy, the future version of the summary could be shorten (e.g., by omitting price comparisons in some cases). Some comments proposed that the sum-mary should group together features that make the products different, separately from those the
prod-ucts have in common, this, as well, has a potential as a next feature to be experimented on.
In addition, to mimic more of human-written texts, approches to reduce the repetition in the gen-erated text could be considered.
Finally, a more seamless integration of the sum-mary to e-commerce websites could also be con-sidered, maybe as a browser extension or a website wrapper.
Acknowledgment
The authors would like to thank the reviewers for their constructive comments and suggestions.
References
Milton Friedman. 1940. A comparison of alternative tests of significance for the problem ofmrankings. Ann. Math. Statist., 11(1):86–92.
Salvador García, Alberto Fernández, Julián Luengo, and Francisco Herrera. 2010. Advanced nonpara-metric tests for multiple comparisons in the design of experiments in computational intelligence and data mining: Experimental analysis of power. Inf. Sci., 180(10):2044–2064.
Stephanie Inglis, Ehud Reiter, and Somayajulu Sri-pada. 2017. Textually summarising incomplete data. In Proceedings of the 10th International Confer-ence on Natural Language Generation, pages 228– 232, Santiago de Compostela, Spain. Association for Computational Linguistics.
Kittipitch Kuptavanich. 2018. Using textual sum-maries to describe a set of products. InProceedings of the 12th ACM Conference on Recommender Sys-tems, RecSys ’18. ACM.
Prashant Mathur, Nicola Ueffing, and Gregor Leusch. 2017.Generating titles for millions of browse pages on an e-commerce site. In Proceedings of the 10th International Conference on Natural Language Generation, pages 158–167. Association for Com-putational Linguistics.
Kathleen R. McKeown. 1985. Discourse strategies for generating natural-language text. Artificial Intelli-gence, 27(1):1–41.
Ehud Reiter and Robert Dale. 2000. Building Natural Language Generation Systems. Cambridge Univer-sity Press, New York, NY, USA.
B. Shneiderman. 1996.The eyes have it: a task by data type taxonomy for information visualizations. In Proceedings 1996 IEEE Symposium on Visual Lan-guages, pages 336–343.