The
Jour
nal
of
P
hysiology
TE C H N I Q U E S F O R P H Y S I O L O G Y
Sialic acids regulate microvessel permeability, revealed by
novel
in vivo
studies of endothelial glycocalyx structure
and function
Kai B. Betteridge
1, Kenton P. Arkill
2,3, Christopher R. Neal
1, Steven J. Harper
1, Rebecca R. Foster
1,
Simon C. Satchell
1, David O. Bates
2and Andrew H. J. Salmon
1,41Bristol Renal, Schools of Clinical Sciences and Physiology & Pharmacology, Dorothy Hodgkin Building, University of Bristol, Bristol, BS1 3NY, UK 2School of Medicine, Faculty of Medicine and Health Sciences, University of Nottingham Medical School, Nottingham, NG7 2UH, UK
3Biofisika Institute (CSIC UPV/EHU) and Research Centre for Experimental Marine Biology and Biotechnology (PiE), University of the Basque Country,
Spain
4Renal Service, Specialist Medicine and Health of Older People, Waitemata DHB, Auckland, New Zealand
Key points
r
We have developed novel techniques for paired, direct, real-time in vivo quantification ofendothelial glycocalyx structure and associated microvessel permeability.
r
Commonly used imaging and analysis techniques yield measurements of endothelial glycocalyxdepth that vary by over an order of magnitude within the same vessel.
r
The anatomical distance between maximal glycocalyx label and maximal endothelial cell plasmamembrane label provides the most sensitive and reliable measure of endothelial glycocalyx depth.
r
Sialic acid residues of the endothelial glycocalyx regulate glycocalyx structure and microvesselpermeability to both water and albumin.
Abstract The endothelial glycocalyx forms a continuous coat over the luminal surface of all vessels, and regulates multiple vascular functions. The contribution of individual components of the endothelial glycocalyx to one critical vascular function, microvascular permeability, remains unclear. We developed novel, real-time, paired methodologies to study the contribution of sialic acids within the endothelial glycocalyx to the structural and functional permeability properties
of the same microvessel in vivo. Single perfused rat mesenteric microvessels were perfused
with fluorescent endothelial cell membrane and glycocalyx labels, and imaged with confocal
microscopy. A broad range of glycocalyx depth measurements (0.17–3.02 μm) were obtained
with different labels, imaging techniques and analysis methods. The distance between peak cell membrane and peak glycocalyx label provided the most reliable measure of endothelial glycocalyx anatomy, correlating with paired, numerically smaller values of endothelial glycocalyx
depth (0.078±0.016μm) from electron micrographs of the same portion of the same vessel.
Disruption of sialic acid residues within the endothelial glycocalyx using neuraminidase perfusion decreased endothelial glycocalyx depth and increased apparent solute permeability to albumin in the same vessels in a time-dependent manner, with changes in all three true vessel wall permeability coefficients (hydraulic conductivity, reflection coefficient and diffusive solute permeability). These novel technologies expand the range of techniques that permit direct studies of the structure of
the endothelial glycocalyx and dependent microvascular functions in vivo, and demonstrate
that sialic acid residues within the endothelial glycocalyx are critical regulators of microvascular permeability to both water and albumin.
C
(Received 10 February 2017; accepted after revision 8 May 2017; first published online 19 May 2017)
Corresponding authorA. H. J. Salmon: Renal Service, 122 Shakespeare Road, North Shore Hospital, Waitemata District
Health Board, Takapuna, Auckland, New Zealand. Email: [email protected]
Abbreviations Alexa 488, Alexa Fluor 488; BSA, bovine serum albumin; FITC, fluorescein isothiocyanate; FWHM, full
width at half-maximum;PsBSA, apparent solute permeability to bovine serum albumin; R18, octadecyl rhodamine B chloride; S1P, sphingosine-1-phosphate; TMA-DPH, 1-(4-trimethylammoniophenyl)-6-phenyl-1,3,5-hexatriene p-toluenesulfonate; TRITC, trimethylrhodamineisothiocyanate; WGA, wheat germ agglutinin.
Introduction
The entire luminal surface of all vascular walls is covered with a continuous, carbohydrate-rich mesh: the
endothelial glycocalyx (Weinbaum et al. 2007). The
membrane-bound portion of the endothelial glycocalyx is supplemented with components of plasma to form a thickened endothelial surface layer. This endothelial coat governs the nature of interactions between fluid, protein and cellular constituents of flowing blood and the endothelial cell, and is therefore a critical regulator of vascular function (Curry & Adamson, 2013). The endothelial glycocalyx regulates permeability in exchange microvessels; leukocyte rolling, adhesion and migration in post-capillary venules; mechanotransduction, flow- and shear-induced vasodilatation in arterioles; and protects the vessel wall from the development of atherosclerosis in conduit arteries.
The role of the endothelial glycocalyx in regulating
microvessel permeability was formalised in the
fibre-matrix junction-break theory proposed by Curry and Michel in 1980. This theory and subsequent refinements hold that the endothelial glycocalyx is the primary macromolecular sieve in continuous micro-vessels, and that this sieving immediately above inter-endothelial junctions creates a protected ‘sub-glycocalyx space’, whose oncotic pressure determines the magnitude of the oncotic pressure gradient resisting water and solute flux across vessel walls (Levick & Michel, 2010). Demonstrations of the resulting non-linear form of the Starling equation under steady-state filtration conditions (Michel & Phillips, 1987), and unequal actions of luminal
and abluminal oncotic pressures (Hu et al. 2000),
support this theory. These functional demonstrations are supported by recent observations that a repeating periodic arrangement of the fibres of the endothelial glycocalyx are sufficient to explain the near-uniform macromolecular permeability coefficients seen throughout the vasculature
(Squire et al. 2001; Arkill et al. 2011). The endothelial
glycocalyx also regulates hydraulic resistance, with greater glycocalyx depths providing greater resistance (Adamson,
1990; Salmonet al. 2009).
The structure of the endothelial glycocalyx is complex, with depth, spatial localisation and 3-D architecture all structural facets that impact on vascular function,
including permeability. In addition, determining
the relative functional importance of different
glycocalyx components has been challenging. The endothelial glycocalyx contains an array of glycoproteins, proteoglycans and glycosaminoglycans (GAGs), with much focus on the importance of GAGs in regulating key physiological properties to the vessel wall (Tarbell & Ebong, 2008). Many of the glycoproteins are capped by sialic acid (Varki, 2008) contributing to the structure of the glycocalyx. The dominant GAG is heparan sulphate, which is a family of charged molecules with a wide variety of subtypes depending on the nature of bonds between individual saccharide units and their sulphation pattern
(Weinbaum et al. 2007). Heparan sulphate has been
shown to regulate mechanotransduction (Florian, 2003;
Kumagaiet al. 2009), and evidence indicates an important
role in regulating permeability in endothelial monolayers in vitro (Singh et al. 2007) and in isolated coronary
arteriolesex vivo(Huxley & Williams, 2000). Chondroitin
sulphate also carries significant charge, and again appears to have an important role in regulating permeability (Jeansson & Haraldsson, 2003). Finally hyaluronan, a non-sulphated GAG with extended chain length, also plays important roles in mechanotransduction and glomerular
filtration (Jeanssonet al. 2006, 2009; Pahakiset al. 2007).
At present, little is known about the potential role that sialic acid residues within the endothelial glycocalyx may also make to microvessel permeability characteristics.
Sialic acid residues regulate leukocyte (Sakaryaet al. 2004)
and platelet (Gorog et al. 1982) adhesion,
mechano-transduction (Tarbell & Ebong, 2008; Kumagai et al.
2009), low-density lipoprotein (LDL) uptake into
end-othelial cells (Gorog et al. 1982) and development
of atherosclerosis (Cuniberti et al. 2005). Endothelial
glycocalyx sialic acid residues are disrupted in disease states predisposing to atherosclerosis such as diabetes
(Nassimizadehet al. 2010), as well as playing an important
role in kidney disease (Dekan et al. 1991; Gelberget al.
1996), and sepsis (Adembriet al. 2011), all of which have
(Singhet al. 2007; Cioffiet al. 2012), but the endothelial glycocalyx and permeability coefficients of cultured
end-othelial cells are substantially different from thein vivo
situation (Curry, 2005; Chappell et al. 2009). Despite
their abundance and importance in key physiological processes and disease states, the importance of endothelial glycocalyx sialic acid residues in regulating intact vessel wall permeability coefficients remains unclear.
Current in vivo studies of the endothelial glycocalyx
either involve disruptive (e.g. electron microscopy) or indirect (e.g. tracer exclusion) techniques to examine the endothelial glycocalyx, both of which give conflicting
results (Salmon et al. 2009; Gao & Lipowsky, 2010).
Newer and more direct optical imaging techniques which have employed the use of fluorescently tagged anti-bodies and lectins to bind glycocalyx have also been
attempted in recent years (Caiet al. 2012; Salmonet al.
2012; Yenet al. 2012). These techniques have often used
confocal laser scanning and two-photon microscopes in an attempt to better resolve the glycocalyx in micro-vessels. However, even with the improved resolution of laser scanning methods, these optical techniques are still assessing changes in glycocalyx structure that fall within or below the diffraction limit of optical imaging, particularly in the physiological environment (Gretz & Duling, 1995). To make estimates of relative changes in depth within this resolution limit, each of these direct optical imaging techniques have applied different analysis methods which often yield varying and conflicting results
(Gao & Lipowsky, 2010; Cai et al. 2012; Salmon et al.
2012; Yenet al. 2012). In addition, these studies of
end-othelial glycocalyx are rarely coupled with measurements of the functional properties of the wall of the same vessel.
The aim of this study was to understand the contribution of endothelial glycocalyx sialic acid residues to microvascular structure and permeability function, and to do so we have developed methods for real-time, direct, paired measurements of endothelial glycocalyx
structure and functionin vivo, as well as applying electron
microscopy preservation to comparein vivoandex vivo
measurements of the same vessels with known functional properties.
Methods
Ethical approval. Procedures were carried out in accordance with national regulations set out by the UK Home Office legislation, and with local approval from the University of Bristol local ethical committee. Male Sprague–Dawley rats (150–250 g; Harlan, Oxon, UK) were used in all experiments. Anaesthesia was induced with an intraperitoneal injection of sodium pentobarbital
(60 mg kg−1), and maintained with subcutaneous
intra-muscular injections approximately every 45 min. At
the end of all experiments animals were killed with excess anaesthetic and cervical dislocation. Glycocalyx measurements were made on 16 rats, solute permeability measurements on 9 rats, and hydraulic conductivity and reflection coefficient measurements on 7 rats.
Real-time endothelial glycocalyx imaging. Under anaesthesia, the mesentery was exposed via a midline laparotomy, constantly superfused with mammalian
Ringer solution at 37°C, teased over a glass coverslip,
and imaged via the objective of an inverted micro-scope. Capillaries and post-capillary venules from 10
to 40 μm in diameter and without rolling or adherent
leukocytes were identified and cannulated in the direction of flow with a refillable bevelled glass micropipette
(Bates et al. 2002) for endothelial glycocalyx imaging
alone in initial experiments. Microvessels were then perfused continuously with mammalian Ringer solution containing bovine serum albumin (BSA; 4%; A4378, Sigma, Dorset, UK), followed by supplementation with an endothelial cell membrane label (octadecyl rhodamine
B chloride (R18); 2 μM in BSA–Ringer–0.01% DMSO;
O246, Life Technologies, Renfrew, UK), or TMA-DPH (1-(4-trimethylammoniophenyl)-6-phenyl-1,3,5-hexatriene
p-toluenesulfonate; 2μMin BSA–Ringer–0.01% DMSO;
T204, Molecular Probes, Eugene, OR, USA) (Peti-Peterdi et al. 2009) and then labelling of sialic acid residues within the endothelial glycocalyx (fluorescein isothiocyanate
(FITC)-conjugated wheat germ agglutinin (WGA;
2 mol mol−1 dye content; 2.77 μM in BSA–Ringer;
L4895, Sigma) or trimethylrhodamineisothiocyanate
(TRITC)-conjugated WGA (0.65 mol mol−1 dye
content; 11.08 μMin BSA–Ringer; L5266, Sigma), with
concentrations determined in preliminary optimisation experiments, each for 5 min, followed by washout with unsupplemented 4% BSA–Ringer solution.
Respiratory and peristaltic movement required both fluorophores (R18 and FITC-WGA) to be excited and detected simultaneously in all experiments. The consequent theoretical possibility of signal detection in
the 605±75 nm (R18) channel from the broad emission
spectrum of WGA-conjugated FITC was assessed qualitatively and quantitatively. Fluorescein (FITC-WGA) artefacts observed in the centre of vessels were detected
in both the 515±30 nm (FITC) and 605±75 nm (R18)
with neither fluorophore emission spectra detectable by an alternative channel. This combination of TMA-DPH (endothelial cell membrane) and TRITC-WGA (sialic acid residues in the endothelial glycocalyx) also eliminated the possibility of fluorescence emission from anatomical labels from confounding the functional solute flux data obtained using Alexa 488 BSA in later experiments.
Labelled mesenteric microvessels were imaged via the
objective (CFI Plan Apochromatic VC 60× Oil with
1.4 NA) of an inverted microscope (Nikon Eclipse TiE),
and scanned in thexandydirections using 488 nm and
543.3 nm wavelength lasers (100% laser power). The laser power, gain and offset for both channels was kept constant
for all experiments (515 ± 30 nm channel = 90 gain
and 0 offset; 605 ± 75 nm = 100 gain and 0 offset).
Fluorescent light emitted back into the objective was
detected using 515 ± 30 nm and 605 ± 75 nm
photo-multiplier tubes (PMTs), and differential interference contrast (DIC) images were detected simultaneously in a diascopic manner using a PMT for transmitted light.
z-stack images (2048 by 2048 pixels; 20 slices) were
captured through the entire vessel using an even inter-slice distance in proportion to the height of the vessel being
imaged (e.g. a 20μm diameter vessel will have 20 optical
slices each 1μm apart) (Fig. 1A).
Endothelial glycocalyx image analysis. Allz-stacks were
analysed using FIJI (Image J) software (Schindelinet al.
2012). Three channels (DIC, endothelial glycocalyx label (FITC or TRITC), and cell membrane label (R18 or
0 0 4 12
8 16 20
E D
C
A 35.00 μm B
30.00 μm
25.00 μm
20.00 μm
15.00 μm
10.00 μm
5.00 μm
0.00 μm
Intensity (If) 180 160 140 120 100 80 60 40 20
0 0.5 1.0 1.5
μm 2.0 2.5 3.0
25 μm
P-P
FWHM
1 2 3 4 5 6 7 8
position across model (pixels)
[image:4.595.51.375.254.722.2]lf
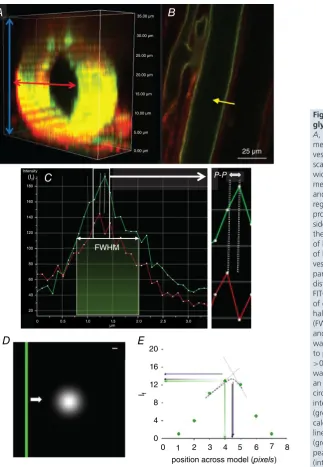
Figure 1. Imaging and analysis of endothelial glycocalyxin vivo
A, section of az-stack imagedin vivo; when a measurement line was drawn across the width of a vessel, all available slices (blue arrows) were scanned though and the slice which yielded the widest vessel diameter (red arrow) was selected for measurements.B, example of FITC-WGA (green) and R18 (red) imaged vessel in the mid-plane region. For demonstration purposes the intensity profile (yellow arrow) has only been drawn on one side of the vessel; this line was actually drawn across the entire width and therefore took measurements of both sides simultaneously.C, the intensity profile of both R18 and FITC-WGA along a line across the vessel wall (yellow arrow) was used to determine 4 parameters of glycocalyx depth: (1) the anatomical distance between peak signals from R18 and FITC-WGA labels (peak to peak: P-P) as a measure of depth, (2) the full width measured at the point of half-maximal fluorescence intensity of FITC-WGA (FWHM) and (3) the peak intensity of FITC-WGA (If), and (4) fractional coverage of endothelial glycocalyx was calculated as the number of points with a peak to peak endothelial glycocalyx depth measurement >0.D, a model of endothelial glycocalyx (green bar) was moved (white arrow) at 1 nm intervals across an Airy disc representation of laser light (white circle). Scale bar: 100 nm.E, the fluorescence intensity (If) of measurements across the green bar
(green points) was highest when peakIfwas
TMA-DPH channels)) and 20 slices in the z plane were processed to account for variability in the image acquisition step, predominantly arising from respiratory and peristaltic movement between optical slices of the
z-stacks causing misalignment of frames within az-stack.
Virtual stack slices were therefore registered based on the images acquired in the DIC channel, and realigned identically for all channels to generate a 3-D image
of the entire vessel. Once registered, the z-stack image
demonstrating the maximal vessel diameter (i.e. the mid-point of the vessel, and the position in which endothelial glycocalyx and cell membrane labels will be perpendicular to the plane of section, minimising
anatomical overlap) was identified (Fig. 1A, red arrow).
Fluorescence intensity profiles were then generated for both endothelial cell label and the sialic acid component of the endothelial glycocalyx label, along 30 evenly-spaced lines across the full width of the vessel. Each point along the profile represented the average fluorescence intensity from 16 adjacent pixels (8 pixels either side of
the line drawn) (Fig. 1B). Four automated measurements
of endothelial glycocalyx parameters were then calculated
(Fig. 1C): (i) the anatomical distance between peak
signal intensity of the endothelial cell membrane label and sialic acid component of the endothelial glycocalyx label (‘peak to peak’); (ii) the full width measured at the point of half-maximal fluorescence intensity of the sialic acid component of the endothelial glycocalyx label (‘FWHM’); (iii) the peak fluorescence intensity of the sialic
acid component of the endothelial glycocalyx label (If);
and (iv) fractional coverage of positively (and negatively) resolvable glycocalyx. Mean values for each of the first three assessments of the endothelial glycocalyx were determined using data from all of the 30 intensity lines analysed; any values for peak to peak which yielded depth values
of0 were excluded from the calculation of the mean
glycocalyx depth and were used to determine (iv). All registration, maximal width identification, fluorescence intensity profiling and measurement steps were conducted by automated macros.
To model whether the peak to peak method was dependent on the size of the individual picture elements acquired in the image we used computational modelling to vary the anatomical position of the ‘true’ theoretical peak glycocalyx within a single voxel by passing an Airy disc representation of 488 nm laser light passing
through a 1.4 NA objective (Fig. 1D) at 1 nm
inter-vals. The anatomical position of the maximum intensity reading would vary as much as one voxel integer
(104 nm for the 60× objective). This problem was
addressed mathematically by comparing the recorded peak intensity with those calculated to be close to the true intensity via linear interpolation (triangulation) and Gaussian fitting of the three peak pixels recorded
(Fig. 1E). Results showed that recorded peak intensities
and triangulated peak intensities varied depending on the true position, but Gaussian intensities provided the least variable (mid-range) results, with the position of peak fluorescence intensity identified independent of the starting point of the scan, therefore providing the greatest
anatomical resolution of these three methods. (Fig. 1E). As
a consequence, all further measurements were calculated using the peak value of a Gaussian fit of recorded peak intensities.
Paired imaging of solute flux and endothelial glycocalyx.
Having developed imaging methods for studying the
endothelial glycocalyx in real time in vivo, alternative
cannulation and perfusion systems were necessary and hence developed for combined solute permeability and
endothelial glycocalyx imaging (Fig. 2A). Micropipettes
were constructed in-house from split-barrel borosilicate glass capillaries (o.d. 2 mm, wall thickness 0.3 mm, central septum thickness 0.22 mm), pulled to a fine tip (Narishige
P22), bevelled (25 deg angle, 10–15 μm tip diameter),
and angled mid-shaft (45 deg angle). Each pipette
barrel then received a refilling line (stretched polyethylene tubing, o.d. 0.61 mm) and a blunt-tipped needle (26G), before the non-cannulating rear aperture was sealed with epoxy resin. The refill line was connected to a syringe pump-driven replaceable refill reservoir for exchanging solutions within each pipette barrel; the 26G needles were attached to individual, modifiable water manometers to control hydrostatic pressures in each side of the pipette
independently (Fig. 2A).
Using the same surgical preparation described above for glycocalyx-only imaging, mesenteric microvessels were cannulated using this double-barrelled pipette system. Barrel A contained BSA–Ringer solution (final concentration 4% w/v BSA). Barrel B contained BSA– Ringer solution supplemented with Alexa Fluor
488-conjugated BSA (Alexa 488 BSA; 0.03 mg ml−1 unless
otherwise stated) to a final concentration of 4% w/v total BSA. Following cannulation, the pressures exerted individually to both pipette barrels were adjusted manually using the relevant water manometers until balance pressure was reached (perfusion ceased; typical range
15–25 cmH2O). The pressure in barrel A (BSA–Ringer)
was then marginally raised (1–5 cmH2O) above the
pressure in barrel B (Alexa 488 BSA) until the vessel was perfused with BSA–Ringer solution only, without back-flow into barrel B. The vessel was continuously perfused under these stable conditions for 10 min before image acquisition.
TRITC-WGA
TMA-DPH P-P
A
B
D E
Fi Fii Fiii
P I
EG VL
ECM I
EC vl
int
sp
Im
rm w
w
sp
r r
n n
tp
50 μm
C350
300 250
If (Gr
e
yscale)
200 150 100
[ –dlf ]0 dt
ΔIf0
0 40
Time (s)
60 80 20
110 100 90 80 70 60 If Intensity
50 40 30 20 10 0
[image:6.595.112.476.60.554.2]0 0.5 1.0 1.5 2.0 2.5 3.0 3.5 4.0 4.5 5.0 5.5 6.0 6.5 7.0 [μm] 25 μm
Figure 2. Paired imaging of solute permeability and endothelial glycocalyx in single microvessels
A, two 26G needles (n) and two fine tubes (grey line) were inserted into each of the main barrels of the bevelled theta-style micropipette (tp) and glued in place to form a tight seal. Two syringe pumps (sp) were used to push solution into the fine tube which was connected to the pump by a refill line (r) and both sides filled with BSA–Ringer solution (or desired dye). The other end of the syringe pumps (sp) were connected to a waste line (w) that was positioned directly behind the back of the two needles (n) and would pull solution away (green arrows) as the refill line pushed solution into (black arrows) the pipette. The needles were also connected to two separate water manometers; the right manometer (rm) and the left manometer (lm) to control pressure on each side of the pipette independently. This design allowed the solution in the pipette to be readily changed even during microvessel cannulation.B, mesenteric microvessels of pentobarbitone-anaesthetised male Sprague–Dawley rats were cannulated using theta-style micropipettes where the pressure on either side was set so that only one desired side perfused (15–30 cmH2O). Perfused BSA–Ringer solution was switched instantly to perfused Alexa 488-labelled
BSA (0.03 mg ml−1) transiently for 30–60 s, and imaged using fluorescence microscopy.C, a measuring window
followed by a steady linear increase inIf, the initial rate of change of which ([dIf/dt]0) represents the rate of solute flux across the vessel wall.D, confocal image of cannulated mesenteric microvessel perfused and labelled with TMA-DPH (endothelial cell membrane: blue) and TRITC-WGA (sialic acids within endothelial glycocalyx: red). vl: vessel lumen; int: interstitium. White bar: selected line of interest across vessel wall.E, fluorescence intensity profile along selected white bar. P-P (peak to peak): measure of anatomical distance between peak fluorescence of TMA-DPH (endothelial cell membrane: blue) and TRITC-WGA (sialic acids within endothelial glycocalyx: red) signals. FWHM: measure of full-width half-maximum of TRITC-WGA (sialic acids within endothelial glycocalyx: red) signal. Other previously described parameters were also analysed (mean peakIfof TRITC-WGA, and fractional coverage).
F, representative images of the same cannulated and perfused microvessel imaged using light (a), confocal (b) and electron (c) microscopy.Fa, P: pipette; I: interstitium; VL: vessel lumen.Fb, red: endothelial cell membrane (R18); green: endothelial glycocalyx (FITC-WGA); white box: portion of membrane also examined by electron microscopy.Fc, VL: vessel lumen; EG: endothelial glycocalyx; ECM: endothelial cell membrane; EC: endothelial cell; I: interstitium.
detection; 20 MHz readout mode; 2×2 binning; 696×
520 pixels; 350 visual gain). Under these conditions, initial videos were captured (Nikon NIS Elements software; 60 ms intervals; 20 s duration). Pressures in barrels A and B were then instantly swapped, halting perfusion of BSA–Ringer solution and commencing perfusion with Alexa 488 BSA
(Fig. 2B and C). After 20 s perfusion with fluorescent
solution, pressures were switched back to initial settings, generating perfusion with non-fluorescent BSA–Ringer
for a final period of 20 s (Fig. 2C). This perfusion
and imaging sequence for capturing solute permeability
(PsBSA) quantification data was repeated 4–5 times for each
period of the experiment. During these experimental peri-ods, perfusate either contained vehicle, or neuraminidase
to disrupt sialic acids (neuraminidase fromClostridium
perfringens, Salmon et al. 2012; 2 U ml−1 in 4% BSA;
N2876, Sigma).
Following this imaging of solute flux, pipette barrels A and B were refilled and the vessel perfused with labels for endothelial cell membrane and glycocalyx: note that the use of Alexa 488-labelled BSA precluded the use of overlapping emission fluorophores (e.g. FITC) for cell membrane or glycocalyx labelling in these permeability
experiments. After PsBSA measurements, vessels were
therefore labelled with TMA-DPH to label endothelial cell membranes; and TRITC-WGA to label endothelial
glycocalyx sialic acid residues; Fig. 2D). Each dye was
perfused for 5 min, before lumen refill and perfusion with BSA–Ringer solution alone. Endothelial glycocalyx was
then imaged as described above (Fig. 2E).
Solute permeability analysis. Real-time video images of Alexa 488 BSA-perfused microvessels were analysed using Nikon NIS Elements software. A standard region of interest (ROI) was created covering the full length of the perfused vessel in the imaging field and extending
20 μm directly adjacent to either side of the vessel,
with the distance between pipette tip and the ROI
position maintained at150μm. ROI measurements of
mean fluorescence intensity (If)vs. time (seconds) were
recorded from each experiment and plotted as a scatter plot giving a characteristic time course appearance (e.g.
Fig. 2C). Anatomical dimensions of the microvessel radii
(r) were measured directly from images of endothelial cell
membrane labelling in the same microvessel.
A typical time course plot (e.g. Fig. 2C) demonstrated a
steady baseline value of background fluorescence intensity
(If) during perfusion of BSA–Ringer alone. Initial filling
of the vessel lumen with Alexa 488 BSA caused a sharp,
stepwise increase in fluorescence intensity (If; [If]0)).
Initial BSA transport across the vessel wall caused a steady
rate increase inIfover time ([dIf/dt]0) (Fig. 2C; white line),
followed by a sudden drop inIf when the perfusate was
switched back to BSA–Ringer solution.
The permeability coefficient of the solute BSA (PsBSA)
was the rate of flux of BSA (JsBSA) through an area of a
microvessel (A) per unit concentration difference (c).
This can be expressed as:
PsBSA=
JsBSA
A ×
1
c (1)
With this methodology (Huxleyet al. 1987),JsBSA could
be calculated from the initial stepwise change (If) and
subsequent rate of change in fluorescence intensity (dIf)
over time (t) immediately (time zero: ‘0’) after the capillary
lumen was filled with Alexa 488 BSA in a capillary of
measured radius (r):
PsBSA=
1
If0 ×
dIf
dt ×
r
2 (2)
Endothelial glycocalyx imaging by electron micro-scopy. Following real-time structural measurements of
glycocalyx and vessel permeability in vivo, vessels were
then perfused with albumin-free Alcian Blue-Ringer solution (Alcian Blue 8GX, A5268, Sigma) as previously
described (Salmon et al. 2009) for 5 min (Fig. 2F).
Superfusate was then switched from warm Ringer solution to ice-cold glutaraldehyde (2.5%) for 5 min to achieve mesentery stiffening indicating successful fixation. Micropipettes were then removed, the mesenteric panel containing the preserved vessel dissected away from the surrounding gut, rinsed and then stored in glutaraldehyde
tetroxide, 1% lanthanum chloride and saturated uranyl acetate on ice, and then processed and embedded into resin. The cannulation site in the microvessel studied in vivowas identified, and the block was trimmed until 100 nm sections containing the previously studied portion of mesenteric microvessel were cut, mounted on piloform covered slot grids, and imaged with 120 keV transmission electron microscopy (Tecnai T12 with an Eagle camera
(FEI)) (Fig. 2Fc).
Electron micrographs were analysed using Adobe Photoshop software. Images from eight points evenly spaced around the lumen were assessed to quantify glycocalyx depth in each of these regions. The depth was assessed at 20 points for each high power image by measuring the anatomical distance from the luminal phospholipid bilayer to the furthest point of the glycocalyx; perpendicular measurements were ensured by only using images where the phospholipid bilayer was visible as two distinct layers. This was performed by initially overlaying a grid, and depth was measured at any point where the visible phospholipid bilayer crossed vertical or horizontal lines (depending on the orientation of the image). Sample groups were blinded before analysis, and measurements performed at points where endothelial cell membranes touched the overlaid gridlines to eliminate potential sub-jective interpretations.
Hydraulic conductivity and reflection coefficient measurement. In separate experiments, we used the Landis–Michel micro-occlusion technique as previously described to measure permeability coefficients hydraulic
conductivity (Lp) and the reflection coefficient to albumin
(σBSA) in intact microvesselsin vivo(Salmonet al. 2009).
In the steady state the following holds (Michel & Phillips, 1987):
Jv
A = Lp(P− σ
2
c) (3)
Individual mesenteric microvessels were exposed, cannulated with a single-lumen bevelled micropipette, and perfused with 4% BSA–Ringer solution supplemented with low-density rat erythrocytes (as flow markers and source of sphingosine-1-phosphate (S1P)) at 60, 80
or 100 cmH2O. Vessels were intermittently and briefly
occluded with a fine glass rod. Fluid filtration rate per unit
area (Jv/A) was calculated from the rate of erythrocyte
movement towards the occluder and the cross-sectional
area of the vessel. Lp (×10−7 cm s−1 cmH2O−1) was
calculated from the slope of the relationship between filtration rate and applied pressure, and the measured
effective oncotic pressure difference (σπ) from the
abscissal intercept. The ideal oncotic pressure of this
perfusate (πc) was calculated empirically (Bates, 1998).
The reflection coefficient was subsequently calculated from the relation (Michel & Phillips, 1987):
σ=√(σπ/πc) (4)
Measurements were repeated before and after perfusion with neuraminidase for 20–25 min, matching apparent solute permeability experiments described above.
Determination of true diffusive solute permeability.
Convective and diffusive fluxes of albumin contribute to the apparent solute permeability coefficient for albumin
(PsBSA). The relative importance of these processes were
discriminated using the recast form of the Patlak equation derived by Curry (Curry, 1984) and as subsequently
expressed by Fuet al. (1998):
Ps= Pd
Pe
(ePe−1) +Lp(1−σ)Peff (5)
where
Pe= Lp(1−σ)Peff Pd
(6)
and
Peff =P−σalbalb (7)
wherePdrepresents the true solute diffusive permeability
coefficient for albumin across the vascular wall, andPeis
the Peclet number (ratio of convective to diffusive flux).
Statistical analysis. All statistics were calculated using Prism (GraphPad) software. Statistical significance was
considered positive when a P value of < 0.05 had
been demonstrated. Unless otherwise expressed, all data
are presented as mean ± standard error of the mean
(SEM). All n values represent the number of animals
used unless otherwise stated. Two-sided parametric tests were employed for analysis of true value estimates of
glycocalyx parameters and PsBSA in vivo, as well as
glycocalyx depth measured from electron micrographs, and the following statistical tests were employed: Pearson’s
rank for examination of correlation, pairedttest, two-way
ANOVA, and one-way ANOVA were used for paired
experiments; unpaired t tests were used for unpaired
comparisons. All post hoc analyses used Bonferroni
post-tests
Results
Endothelial glycocalyx. Estimates of endothelial glycocalyx depth made in vessels perfused with R18 and FITC-WGA using the FWHM method yielded
significantly higher measurements (1507 ± 136.9 nm,
n=10) than those determined in the same vessels using
n=10) (P<0.001, pairedttest; Fig. 3A). Using peak to peak measurements the fraction of vessel wall yielding positively resolvable glycocalyx measurements was
0.77±0.04 (n=10) and the mean peakIfof FITC-WGA
across vessel walls was 176.4 ± 21.17 (n = 10). As the
peak If of the FITC-WGA signal increased, the paired
peak to peak depth of endothelial glycocalyx significantly
decreased, indicating that the peakIfof FITC-WGA may
be influencing the anatomical location of the peakIf of
R18, thereby resulting in a reduction in peak to peak
endothelial glycocalyx depth estimates (P < 0.05 by
Pearson’s correlation,r= −0.6975; Fig. 3B).
Endothelial glycocalyx depth measured in vivo using
both analysis methods (peak to peak and FWHM) were compared with the depth of endothelial glycocalyx measured at the same anatomical site of the same
vessel ex vivofrom paired electron micrographs. Paired
comparisons demonstrated that endothelial glycocalyx
depth estimated with FWHM (1376±99.77 nm,n=5)
(Fig. 3C) and peak to peak (243.6±22.44,n=5) (Fig. 3D)
techniques both yielded significantly greater estimates of depth than that estimated from paired electron
micro-graphs (78.09 ± 16.16 nm, n = 15) (P < 0.001,
pairedttest). Endothelial glycocalyx depth measurements
were therefore 3.1- to 17.6-fold greater using confocal
microscopy in vivothan measurements at the same site
using electron microscopyex vivo, with the broad range
dependent on the method used to analyse the confocal microscopy images.
Measurements of glycocalyx depth for TRITC-WGA
and TMA-DPH peak to peak (622.7±67.18 nmn=5)
methods were, on average, significantly greater than the previous depth estimates for FITC-WGA and R18 peak
to peak (231.4 ± 24.4 nm, n = 6, P < 0.001 by
unpairedttest) (Fig. 3E). Fractional coverage by resolvable
endothelial glycocalyx was not significantly different using the two sets of fluorescent labels (TMA-DPH,
TRITC-WGA: 0.7867±0.03851,n=5; R18, FITC-WGA:
0.7028 ± 0.04291, n = 6) (P > 0.05 unpaired t test)
(Fig. 3F). Peak fluorescence intensity measurements were
also not significantly different between TRITC-WGA
(269.0± 109.5 greyscale unitsn = 5) and FITC-WGA
(123.6±22.30n=6 greyscale units) (P>0.05 unpairedt
test) (Fig. 3G). Unlike the significant relation between
end-othelial glycocalyx depth measured with the peak to peak
method and the peakIf of FITC-WGA signal, there was
no significant relation between peak to peak determined
glycocalyx depth and the peakIf of TRITC-WGA signal
(r=0.29,P>0.5 Pearson’s correlation).
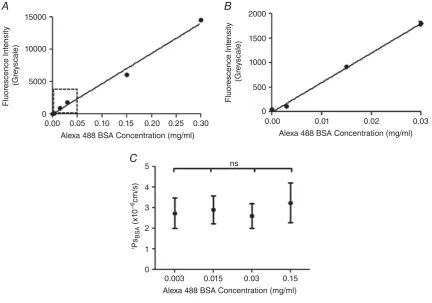
Apparent solute permeability. To test the assumption of a linear relationship between the number of Alexa 488-BSA
molecules in a perfused vessel with the meanIfmeasured
in that same vessel in vivo, individual vessels were
imaged during consecutive perfusion with the following concentrations of Alexa 488 BSA: 0, 0.003, 0.015, 0.03,
0.15 and 0.3 mg ml−1 of Alexa 488 BSA. There was
a significant linear relationship between the number of
Alexa Fluor 488 BSA molecules and the meanIfmeasured
within the perfused vessel (r2 = 0.9916, P < 0.0001,
Pearson’s correlation) (Fig. 4A and B). There was no
significant difference betweenPsBSAestimates made using
these different concentrations of Alexa 488 BSA in the
same microvessel (P>0.05 by one-way ANOVA) (Fig. 4C).
Importance of endothelial glycocalyx sialic acids. To determine whether endothelial glycocalyx sialic acids contribute to endothelial glycocalyx structure and vessel wall permeability, endothelial glycocalyx parameters and solute permeability were measured in individual vessels before and after (or with and without) disruption of terminal sialic acids by perfusion with neuraminidase. With the peak to peak method of analysis, there was no significant difference between glycocalyx depth at
base-line (243.6 ± 22.44 nm, n = 10) and that measured
after 20 min of treatment with vehicle (231.4±24.4 nm,
n = 6) (P > 0.05, two-way ANOVA Bonferroni
post hoc analysis) (Fig. 5A), but glycocalyx depth was significantly reduced within single vessels after 20 min
of treatment with neuraminidase (185.0 ± 32.78 nm)
when compared to baseline (288.9 ± 28.74 nm)
(P < 0.01, n = 5, two-way ANOVA Bonferroni post
hoc analysis) (Fig. 5B). The technique with the peak
to peak method of analysis was sufficiently sensitive to detect changes in endothelial glycocalyx depth in unpaired comparisons of vehicle- or neuraminidase-perfused vessels labelled with TRITC-WGA and TMA-DPH (rather than FITC-WGA and R18, as described above) (vehicle
treatment: 622.7±67.18 nm; neuraminidase treatment:
386.3±10.82 nm;P<0.05, unpairedttest) (Fig. 5C).
Removal of sialic acid residues with 20 min of treatment with neuraminidase also reduced the depth of end-othelial glycocalyx as determined by the FWHM method
of analysis (1646 ± 352.6 nm, n = 5, at baseline;
1223±199.4 nm,n=5, after neuraminidase) (P<0.05,
n = 5, two-way ANOVA Bonferroni post hoc analysis),
with no significant change in endothelial glycocalyx depth as determined by the FWHM method when vessels
were treated with vehicle (1479 ±68.81 nm) compared
to baseline (1355 ± 84.03 nm) (P > 0.05, two-way
ANOVA Bonferroni post hoc analysis) (Fig. 5D and E).
Unpaired comparisons (TRITC-WGA and TMA-DPH) of the FWHM measure of glycocalyx depth did not have sufficient discrimination to demonstrate a significant reduction in glycocalyx depth following treatment with
neuraminidase (1492 ± 116.8 nm) when compared to
vehicle treated control (1265±150.5 nm) (P> 0.05 by
4000
A
D C
E F G
B
***
***
***
*** 2000
2000 FWHM
CM
Alcian Blue EM 1500
1500 1000
1000
500
0 300
200
100
0 3000
2000
1000
Gl
ycocal
yx depth b
y
P
eak t
o P
eak(nm)
Gl
ycocal
yx depth (nm)
Gl
ycocal
yx depth (nm)
Gl
ycocal
yx depth (nm)
Gl
ycocal
yx depth (nm)
Gl
ycocal
yx fr
actional co
ver
P
eak l
f
(g
re
yscale)
400 300 200
Full Width Half Maximum Peak to Peak n=10
n=10
500
400
400
300 300
300
200 200
200 100
100
100
0
1.0
0.9
0.8
0.7
0.6
0.5
0.4
Peak to Peak TRITC-WGA FITC-WGA
Peak to Peak
TMA-DPH & TRITC R18 & FITC
Peak to Peak CM
800 ns
ns ns
600
400
200
0
Alcian Blue EM 0
0
Peak lf of FITC-WGA (greyscale) 100
[image:10.595.89.494.59.509.2]0
Figure 3. Endothelial glycocalyx depth in an individual vessel varies by more than an order of magnitude, according to the imaging and analysis method
A, microvessels were imaged immediately after perfusion with FITC-WGA (glycocalyx) and R18 (cell membrane). A line was drawn across the full diameter of the vessel and the depth of the endothelial glycocalyx estimated from: the full width measured at the point of half-maximal fluorescence intensity of FITC-WGA (FWHM); and the anatomical distance between peak signal from R18 (cell membrane) and FITC-WGA (sialic acids within endothelial glycocalyx) (peak to peak). FWHM analysis generated significantly higher values of glycocalyx depth than peak to peak analysis (∗∗∗P<0.001 pairedttest).B, the depth of the glycocalyx (peak to peak method) (y-axis) was inversely related to the peak fluorescence intensity (If) of FITC-WGA (x-axis) (r= −0.50,P <0.05 Pearson’s
correlation). C, full-width half-maximum (FWHM) measurements of endothelial glycocalyx depth made from confocal microscopy (CM) images were significantly greater than subsequent depth measurements of Alcian Blue-labelled endothelial glycocalyx imaged with electron microscopy (EM) in the same vessel (∗∗∗P<0.001 paired
The fluorescence intensity of FITC-WGA (If) was not
significantly altered after perfusion for 20 min with
vehicle (123.6 ± 22.30, n = 6) when compared to
that measured at baseline (176.4 ± 21.17, n = 10)
(P>0.05, two-way ANOVA Bonferronipost hocanalysis)
(Fig. 5G), but was significantly reduced following 20 min
of neuraminidase perfusion (124.9 ± 13.53) when
compared to that imaged at baseline (460.9 ± 48.21)
(n=5,P<0.001, two-way ANOVA Bonferronipost hoc
analysis) (Fig. 5H). Unpaired comparisons of peakIf of
TRITC-WGA did not have sufficient discrimination to demonstrate a statistically significant change to glycocalyx staining intensity following treatment with neuraminidase
(95.63±24.53 nm) when compared to the vehicle-treated
control (269.0±109.5 nm) (P>0.05 by unpairedttest)
(Fig. 5I).
The proportion of vessels with a glycocalyx depth greater than zero (fractional coverage), determined using the peak to peak method, was unchanged from baseline
coverage (0.7650 ±0.02563, n= 10) after perfusion of
vehicle (0.7028 ± 0.04291,n = 6) (P> 0.05, two-way
ANOVA Bonferronipost hocanalysis), and likewise was
unchanged before (0.8500 ± 0.07397, n = 5) and
after perfusion with neuraminidase (0.8167 ± 0.05603,
n=5) (P>0.05, two-way ANOVA Bonferronipost hoc
analysis) (Fig. 5Jand K). Unpaired comparisons (using
TRITC-WGA and TMA-DPH) did reveal a significant reduction in glycocalyx fractional coverage following
neuraminidase treatment (0.57± 0.07) when compared
to the vehicle-treated control (0.79±0.04) (P<0.05 by
unpairedttest) (Fig. 5L).
Measurement of endothelial glycocalyx depth within electron micrographs revealed a significant reduction in glycocalyx depth for vessels treated with neuraminidase
(40.01 ± 7.317 nm, n = 7) when compared to
vessels treated with vehicle alone (78.09 ± 16.16 nm,
n = 5) (P < 0.05, by unpaired t test) (Fig. 5M). The
depth of the endothelial glycocalyx determined in vivo
15000
10000
5000
0
0.00 0.05 0.10 0.15 0.20 0.25 0.30
Alexa 488 BSA Concentration (mg/ml)
Fluor
escence Int
ensit
y
(Gr
e
yscale)
Fluor
escence Int
ensit
y
(Gr
e
yscale)
2000
1500
1000
500
0
0.00 0.01 0.02 0.03
Alexa 488 BSA Concentration (mg/ml)
Alexa 488 BSA Concentration (mg/ml) 5
4
3
2
1
0
'Ps
BS
A
(x1
0
−6
cm/s)
0.003 0.015 0.03 0.15
ns
A B
[image:11.595.86.519.314.617.2]C
Figure 4. Imaging and analysis of solute permeabilityin vivo
A, the mean fluorescence intensity of Alexa Fluor 488-conjugated BSA (If:y-axis) was measured and quantified
within a cannulated and perfused microvesselin vivo, and plotted against the concentration of Alexa Fluor 488-conjugated BSA being perfused (x-axis). The measuredIf is linearly related to the concentration of Alexa
Fluor 488-conjugated BSA being perfused (r2=0.9916,P<0.0001 Pearson’s correlation).B, an expanded plot of the lower range ofIfvs. Alexa Fluor 488-conjugated BSA concentration data, demonstrating that this linear
relation holds at the range of low concentrations of Alexa Fluor 488-conjugated BSA used in solute permeability experiments (0.03 mg ml−1) C, P
sBSAwas calculated in the same perfused microvessel in vivo perfused with
different concentrations of Alexa Fluor 488-conjugated BSA. There was no significant difference between the
A 500 400 300 200 100 0
Baseline Vehicle Treated
Baseline Vehicle Treated
Baseline Baseline Vehicle Treated Baseline Neuraminidase Baseline Neuraminidase Baseline Neuraminidase Baseline Neuraminidase Neuraminidase Neuraminidase Vehicle Neuraminidase Vehicle Vehicle Vehicle Neuraminidase Vehicle Neuraminidase Vehicle
Glycocalyx depth by Peak to peak CM(nm)
Gl
ycocal
yx depth b
y
P
eak-peak(nm)
Gl
ycocal
yx depth b
y
P
eak-peak(nm)
Gl
ycocal
yx depth b
y
P
eak-peak(nm)
Gl
ycocal
yx depth b
y FWHM(nm) Gl ycocal yx fr actional co ve r Gl ycocal y x fr actional co ve r calculat ed fr om peak-peak F ractional co ver
age of gl
ycocal yx calculat ed fr om P eak t o P e ak Gl ycocal
yx depth b
y FWHM(nm)
Gl
ycocal
yx depth b
y FWHM(nm)
Gl
ycocal
yx depth b
y Electr on Micr oscop y (nm) Gl ycocal
yx depth b
y EM (nm)
300 200 100 1.0 0.8 0.6 0.4 1.0 1.8 1.6 0.4 1.0 0.8 0.6 0.4 0.2 0.0 150 100 50 0 200 150 100 50 0 0
100 200 300 400
0 500 400 300 200 100 0 1000 800 600 400 200 0 800 600 400 200 0 800 600 400 200 0 2000 1500 1000 500 0 3000 2000 1000 0 3000 2000 1000 0 B C
D E F
G H I
[image:12.595.59.524.63.675.2]J K M N L ns ns ns ns ns ns ns ** ** P eak l f (g re yscale) P eak l f (g re yscale) P eak l f cf TRI TC-WG A (g re yscale) * * * **
Figure 5. Disruption of sialic acids reduces endothelial glycocalyx depth and coverage
perfused with 40 mg ml−1BSA vehicle alone (baseline: filled circles; vehicle perfusion; filled squares). Glycocalyx
depth determined using the peak to peak method of analysis was no different before and after perfusion with vehicle (A), but was significantly reduced after neuramindase perfusion (B), (ns:P>0.05;∗∗P<0.01, two-way ANOVA with Bonferronipost hocanalysis). This neuraminidase-induced reduction in peak-to-peak-determined measurements of endothelial glycocalyx depth was reproduced in unpaired experiments (C), in which endothelial glycocalyx depth was determined once only, after earlier measurements of solute permeability in the same vessel during perfusion with either 40 mg ml−1BSA vehicle alone (filled squares) or 40 mg ml−1BSA supplemented
with 2 U ml−1neuraminidase (filled triangles) (∗P<0.05, unpairedttest). Likewise, glycocalyx depth determined
with the full-width half-maximum (FWHM) method was unaltered by perfusion with vehicle solution (D), but was significantly reduced after neuraminidase perfusion (E) (ns:P>0.05;∗∗P<0.01, two-way ANOVA with Bonferroni
post hocanalysis). However, in separate measurements in which endothelial glycocalyx depth was measured only
once by the FWHM after initial solute permeability measurements during perfusion with either 40 mg ml−1BSA
vehicle alone (filled squares) or 40 mg ml−1BSA supplemented with 2 U ml−1neuraminidase (filled triangles), no
significant difference was determined (ns,P>0.05, unpairedttest) (F). Identical results (as for FWHM) were also obtained when determining the peakIfof WGA-labelled endothelial glycocalyx in paired (GandH; ns:P>0.05;
∗∗P<0.01, two-way ANOVA with Bonferronipost hocanalysis) and unpaired (I; ns,P>0.05, unpairedttest)
experiments. The fractional coverage of the vessel wall with endothelial glycocalyx resolvable with the peak to peak method of analysis was no different before and after perfusion with either vehicle or neuraminidase (Jand
K; ns:P>0.05, two-way ANOVA with Bonferronipost hocanalysis), but a significant reduction was observed after neuraminidase perfusion in unpaired experiments (L;∗P<0.05, unpairedttest). Endothelial glycocalyx depth measured in electron micrographs was significantly lower in neuramindase-perfused vessels, as compared with vehicle-perfused vessels (∗P<0.05, unpairedttest) (M). There was a significant positive correlation between the depth of endothelial glycocalyx determined in electron microscopy (EM) images with the depth of endothelial glycocalyx determined by the peak to peak analysis method in confocal microscopy (CM) images in the same vessel (N;r=0.75,P<0.05 Pearson correlation).
from peak to peak analysis demonstrated a significant positive linear relationship to the depth estimates of the endothelial glycocalyx in the same vessels using
electron micrographs (r = 0.7515, P < 0.05, Pearson’s
correlation, 9 pairs) (Fig. 5N). However, none of the
other measurements of endothelial glycocalyx parameters
obtained from confocal microscopy images (peak If,
fractional coverage) correlated with the endothelial glycocalyx depth measurements from electron microscopy
images (FWHM:r=0.1362,n=9 pairs,P>0.05 Pearson’s
correlation; peakIf:r= −0.5184,n= 9 pairs,P>0.05
Pearson’s correlation; fractional coverage: r= −0.2734,
n=9 pairs,P>0.05 Pearson’s correlation).
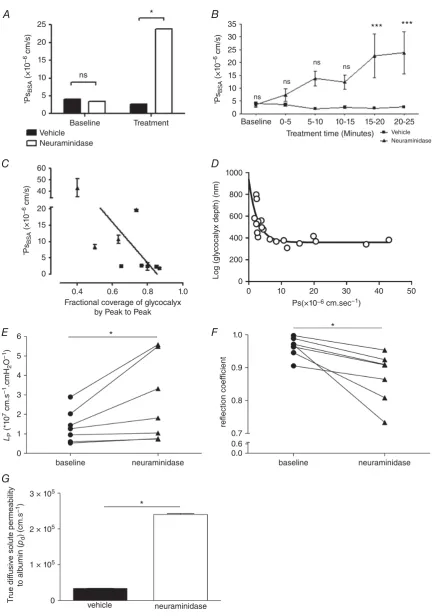
Treatment of perfused microvessels with vehicle solution for 20–25 min did not significantly alter
PsBSA (from (4.0 ± 0.43) × 10−6 cm s−1 to
(2.6±0.44)×10−6cm s−1;n=5 pairs;P>0.05, two-way
ANOVA with Bonferroni’s correction), but disruption of sialic acids with neuraminidase treatment did significantly
increasePsBSA6.8-fold (from (3.5±1.0)×10−6 cm s−1
to (23.8± 8.3)×10−6 cm s−1;n =4 pairs; P<0.001
by two-way ANOVA) (Fig. 6A). The rise in permeability
in response to neuraminidase treatment was progressive
and linear (r2 =0.9216;P<0.01, Pearson’s correlation)
(Fig. 6B). There was a significant inverse linear relationship
between PsBSA and endothelial glycocalyx fractional
coverage in the same vessels in neuraminidase-treated
and vehicle-treated vessels (r = −0.731, n = 9 pairs,
P < 0.05 Pearson’s correlation) (Fig. 6C). Likewise
there was an inverse relationship between PsBSA and
endothelial glycocalyx depth as assessed by the peak to peak analysis of TRITC-WGA in the same vessels
in neuraminidase-treated and vehicle-treated vessels,
(r= −0.80,P<0.05 by Spearman’s correlation) but this
relationship was not linear (best fit: single one-phase decay
curve; depth=330 nm+607 nm×e−0.38×Ps) (Fig. 6D).
Over the same time course, disruption of sialic acids with neuraminidase treatment also significantly increased hydraulic conductivity by 1.9-fold (baseline:
(1.39±0.32)×10−7cm s−1 cmH2O−1; neuraminidase:
(2.68 ± 0.81) × 10−7 cm s−1 cmH2O−1; n = 7 pairs;
P < 0.05, Wilcoxon) (Fig. 6E) and significantly
reduced the reflection coefficient (baseline: 0.96± 0.01;
neuraminidase: 0.87±0.03;n=7 pairs,P<0.05, paired
ttest) (Fig. 6F).
Using measured and calculated parameter values (PsBSA,
Lp,σ,πBSA) from these experiments, and calculating the
Peclet number for these experiments, true diffusive BSA
solute permeability coefficient values (Pd) were 7-fold
and significantly increased by disruption of sialic acids by
neuraminidase treatment (3.38×10⁻⁶cm s−1under
base-line conditions; 2.41×10⁻⁵cm s−1 after neuraminidase
treatment;P<0.001, unpairedttest) (Fig. 6G).
Discussion
In this study we have successfully developed methods
for paired, real-time, direct in vivo assessment of
25
A B
D C
E
G
F
35 30 25 20 15 10
ns ns
ns ns
***
*
*
*
***
5 0
1000
800
600
400
200
0
1.0
0.9
0 10 20 30 40 50
20
15
ns
*
10
5
0
60 50 40
20
15
10
5
0
6
5
4
3
2
1
0
3 × 10⁵
2 × 10⁵
1 × 10⁵
0
Baseline
0.4 0.6 0.8 1.0
Baseline
baseline neuraminidase
baseline
vehicle neuraminidase
neuraminidase Neuraminidase
Vehicle
0-5 5-10 10-15 15-20 20-25
Vehicle Neuraminidase Treatment
Fractional coverage of glycocalyx by Peak to Peak
Treatment time (Minutes)
'
Ps
BS
A
(×1
0
−6 cm/s)
'
Ps
BS
A
(×1
0
−6 cm/s)
LP
(*1
0
7 cm.s
−1
.cmH
2
O
−1)
T
rue dif
fusive solute permeability
to alb
umin (
pd
)
(cm.s
−1)
'
Ps
BS
A
(×1
0
−6 cm/s)
Log
(gl
ycocal
yx depth) (nm)
reflection coef
ficient
Ps(×10−6 cm.sec−1)
0.8
[image:14.595.77.511.56.673.2]0.7 0.6 0.0
Figure 6. Disruption of sialic acids increases microvascular permeability to water and albumin
A, apparent solute permeability to albumin (PsBSA) was measured in microvessels before (baseline) and 20–25 min
with neuraminidase perfusion significantly increasedPsBSA (∗P<0.05, two-way ANOVApost hocBonferroni analysis), with no significant change inPsBSAin vehicle-perfused control vessels (ns,P>0.05, two-way ANOVA
post hocBonferroni analysis).B,PsBSAincreased progressively over time during neuraminidase perfusion (filled
triangles), but remained unaltered during vehicle perfusion (filled squares). A significant increase inPsBSA was
noted after 15–20 min treatment with neuraminidase, matching the time course of neuraminidase-induced end-othelial glycocalyx disruption (∗∗∗P<0.001, two-way ANOVA, Bonferronipost hocanalysis). A significant inverse correlation was noted betweenPsBSAand fractional coverage by resolvable endothelial glycocalyx determined with
the peak to peak method (C) (r= −0.73,P<0.05 Pearson correlation). A significant relation betweenPsBSAand
endothelial glycocalyx depth determined with the peak to peak method was best described by a single one-phase decay curve with a relationship of depth=330 nm+607 nm×e−0.38×Ps(D). Microvessel hydraulic conductivity
(LP) was significantly increased after sialic acid disruption with 20–25 min perfusion with neuraminidase (filled
triangles) compared with baseline measurements in the same vessel (filled circles) (∗P< 0.05, Wilcoxon) (E). Microvessel reflection coefficient to albumin was significantly reduced after sialic acid disruption with 20–25 min perfusion with neuraminidase (filled triangles) compared with baseline measurements in the same vessel (filled circles) (∗P<0.05, Wilcoxon) (F). There was a significant increase in true diffusive solute permeability to albumin after sialic acid disruption with neuraminidase (∗P<0.001, unpairedttest) (G).
an order of magnitude. Highest values are obtained by full-width half-maximum analysis of fluorescently labelled WGA-lectin binding to the endothelial glycocalyx, and lowest values are obtained from electron micrographs of Alcian Blue-labelled endothelial glycocalyx from the same vessel. Estimating the anatomical distance between peak signals from endothelial glycocalyx and endothelial cell membrane labels with distinct fluorescence emission spectra provides the most sensitive and reliable measure of endothelial glycocalyx depth. Sialic acid residues within the endothelial glycocalyx regulate glycocalyx structure, as well as the permeability of the vessel wall to both water and albumin. Neuraminidase-induced changes in glycocalyx structure (by fluorescence and electron micro-scopy) correlated with changes in transvascular solute flux. Sialic acids cap a range of glycoproteins within the end-othelial glycocalyx (e.g. Varki, 2008) and are present at high
density on the endothelial cell surface (<50×106μm−2,
Born & Palinski, 1989, including in human microvessels,
Tatsuzuki et al. 2009), and are potentially found at
increased density at the endothelial cell surface adjacent to the dominant route for water and solute flux across the vessel wall: interendothelial clefts (Bai & Wang, 2014). The current studies demonstrate that disruption of sialic acid residues within the endothelial glycocalyx reduces the degree of reflection of albumin by the microvessel wall, and increases the conductance of water, and therefore sialic acid residues within the endothelial glycocalyx are principal regulators of microvessel permeability.
These findings are in direct conflict with the only other investigation of the effect of sialic acid disruption on
true permeability coefficientsin vivo(Masonet al. 1977),
in which neuraminidase had no effect on mesenteric microvessel hydraulic conductivity. Whilst it is possible
that species differences (frog vs. rat) account for this
difference, the highly conserved nature of endothelial
sialic acid expression (Aamelfot et al. 2014) argues
against this possibility. We suggest that it is more likely
that temperature differences (frog 15°C; rat 37°C)
permit greater enzyme activity and hence greater degree
of sialic acid disruption in the current study, thereby revealing an important role of sialic acids in regulating permeability. The previous study in frogs did not perform paired labelling of glycocalyx or other ultra-structural components, and thus active changes in structure assumed to be brought about by neuraminidase were not confirmed
(Masonet al. 1977) as they have been here.
Other evidence supporting the concept of sialic acids regulating microvascular permeability arise from systems in which the measures of permeability coefficients are confounded by the model used or by unregulated variables. For example, disruption of endothelial glycocalyx sialic acids with neuraminidase was shown to increase permeability and reduce glycocalyx depth of
end-othelial cellsin vitro(Singhet al. 2007; Cioffiet al. 2012).
Whilst cultured endothelial cells display permeability coefficients that are orders of magnitude greater than those
observed in intact vesselsin vivo(Curry, 2005), and possess
an endothelial glycocalyx that differs substantially from
that observed on intact vessels (Chappellet al. 2009), these
findings are consistent with the demonstrated importance of sialic acids in regulating multiple permeability
coefficients in vivoin the current report. Investigations
into the effects of neuraminidase on water and albumin flux in other microvessel beds support our findings that true microvessel wall permeability coefficients are regulated by sialic acid residues. One such study observed alveolar oedema formation within isolated-perfused lungs
from rats treated with neuraminidase (0.5 U ml−1 for
30 min) demonstrating an 8-fold increase in
trans-vascular perfusate flux (calculated from the change in organ weight at different perfusion pressures) indicating that sialoglycoproteins expressed within the endothelial glycocalyx of pulmonary microvessel beds may influence
solute and water flux (Cioffiet al. 2012). Since sialic acids
also regulate glycocalyx-mediated mechanotransduction (Tarbell & Pahakis, 2006) and consequent vessel dilatation
(Kumagai et al. 2009), observed increases in solute or
vasodilatation-induced increase in the hydrostatic forces driving solute and water flux rather than a true change in the permeability of the vessel wall. The current studies confirm that, over and above regulating vessel diameter and hence the magnitude of Starling forces driving solute and fluid flux, sialic acids also regulate the permeability of microvessel walls.
There are a number of biophysical and biochemical mechanisms through which sialic acids may regulate microvascular permeability. The contribution of the end-othelial glycocalyx to hydraulic permeability is thought to be imparted largely through glycocalyx depth (Adamson, 1990), with a reduction in glycocalyx thickness sufficient to explain increased hydraulic conductivity, as observed in response to sialic acid disruption here. The endothelial glycocalyx has been calculated to contribute approximately 60% to the hydraulic resistance of the vessel wall (Adamson et al. 2004). The2-fold increase in hydraulic conductivity following neuraminidase treatment is comparable to the
2.5-fold increase in hydraulic conductivity following
pronase treatment of frog mesenteric microvessels
(Adamson, 1990), and also similar to the 2.3-fold
increase in hydraulic conductivity observed in rats with spontaneous proteinuric chronic kidney disease
and reduced glycocalyx depth (Salmon et al. 2012).
The relationship between glycocalyx depth and albumin permeability has been less clear: the non-linear relation
between these parameters indicated here (Fig. 6D)
illustrates one possible aspect of that relationship. The presence of glycocalyx after neuraminidase treatment with a reduction in thickness of a similar relative level (60% for confocal, 50% for electron microscopy) suggests that the glycocalyx needs to reach a minimal depth before being able to impede albumin flux. Alternative explanations include a potential change in glycocalyx coverage in critical permeability-determining regions, such as in microdomains overlying interendothelial clefts. Furthermore, since other structural and biological aspects of the glycocalyx (such as 3-D ultrastructure and electrical charge) have not been assessed with these techniques, parameters other than depth and spatial distribution may also impact on the relationship between glycocalyx structure and albumin permeability. This could be further investigated with more information on the structure of the glycocalyx, such as that generated using complex
staining techniques (Arkillet al. 2011) to be able to build
testable models of how the glycocalyx regulates albumin permeability.
The observed reduction in endothelial glycocalyx thickness is unlikely, however, to explain the observed reduction in reflection coefficient. Molecules are reflected back into the vessel lumen during convective drag because the functional pore aperture, determined by the combination of steric and electrochemical pore properties, is too small to allow large solute molecules (such as BSA) to
pass. The ordered lattice-like structure of the endothelial glycocalyx imparts efficient molecular sieving properties
(Arkillet al. 2011), with the arrangement, dimensions and
charge of the individual fibres of the lattice all dictating the efficiency with which solutes are reflected back into the vessel lumen under conditions of convective flux (Hu et al. 2000; Squire et al. 2001; Weinbaum et al. 2003;
Arkillet al. 2011). Membrane-bound components of the
endothelial glycocalyx display the necessary quasi-ordered arrangement to contribute to this ordered lattice (Squire et al. 2001), raising the possibility that sialic acid-capped, membrane-bound glycoproteins and/or proteoglycans may be important in regulating the molecular sieving and hence the reflection coefficient of microvessel walls. For example, sialic acid-depleted glycoproteins may form a pore that provides less resistance to the passage of albumin molecules because of reduced net negative charge on the fibres surrounding the pore, thereby facilitating the passage of negatively charged albumin molecules through the pore. However, removal of sialic acid residues did not significantly alter the surface charge of endothelial
cells (Vargas et al. 1989), and hence the neuraminidase
effect observed here may be steric rather than electro-chemical, through altering the shape, size or interactions between sialic acid capped molecules that comprise the pore. Combining the current structure–function studies with glycan-specific electron dense labels (e.g. gold particle-labelled lectins, Baldwin & Winlove, 1984) and Fourier transformation analysis to investigate changes to the ordered arrangement of sialic acid residues within the endothelial glycocalyx may be informative in this regard.
Sialic acid disruption might also (or alternatively) result in secondary changes within the endothelial glycocalyx, thereby altering permeability coefficients. For example, rearrangement or activation of glycocalyx-embedded receptors or interendothelial cleft molecules such as
VE-cadherin may follow sialic acid disruption (Geyeret al.
1999). However, reorganisation of the interendothelial cleft molecules occurs hours after sialic acid disruption
(Cioffi et al. 2012), more slowly than both the increase
in permeability and the change in endothelial glycocalyx measurements observed over minutes in these studies. Direct modification of the endothelial glycocalyx therefore appears to be a more likely explanation for the changes in permeability measured here. Disrupting the inter-action between sialoglycoprotein-based arginine residues and albumin molecules may have reduced the adsorbed fraction of albumin within the endothelial glycocalyx, reducing albumin-dependent sphingosine-1-phosphate signalling leading to active shedding of other glycocalyx
(Adamson et al. 2012, 2014; Curry et al. 2012; Curry
& Adamson, 2013; Zeng et al. 2013). However, these