Effect of venepuncture process design on efficiency and failure rates: a simulation model study for secondary care
Abstract
Background: Healthcare aims to deliver good patient outcomes. For many clinical procedures there are multiple alternative task sequences that can be performed. These deviations can influence procedure reliability, efficiency of usage of hospital resources and risk to staff and patient safety. Venepuncture is one of the most common invasive procedures in healthcare. Literature of clinical practice shows evidence of wide variability in the procedure order and the duration of each step, which can depend on attributes, such as patient health, sampling method and staff skills.
Objective: To use a computer simulation model based on Petri nets to evaluate the impact on outcomes of commonly practiced deviations from the guideline venepuncture procedure and variations in key dependent variables. The outcomes considered include the probability of successfully obtaining a blood sample and the procedure completion time.
Design: A computer simulation model was constructed using the Petri net technique which mimics the different variations of the venepuncture procedure. Qualitative and quantitative data for the model was collected from the literature and through interviews and questionnaire responses from doctors and phlebotomists. Statistics on the reliability and duration for different variations were then calculated from the model output.
Setting: A digital laboratory to model venepuncture in secondary care.
Results: The model showed that the common practice of applying the tourniquet prior to vein identification and releasing it after sample tubes are filled may result in a ten-fold increase in sample haemolysis, compared to the recommended guideline procedure. Equipment layout on wards and patient vein prominence were identified as the two most important factors influencing time efficiency of blood sample collection.
Keywords: Blood sample; Haemolysis; Simulation modelling; Venepuncture. What is already known about the topic?
Venepuncture is one of the most commonly performed clinical procedures and successful, efficient blood sample collection is important for both patients and staff.
There are many variations in how the venepuncture procedure is performed in practice and these may result in a suboptimal outcome.
Simulation modelling using Petri nets has been widely used in reliability engineering to analyse outcomes and efficiency of maintenance procedure designs, but has not previously been developed for clinical procedures.
What this paper adds
Deviations from venepuncture procedure guidelines, that are common in practice, can result in a significant increase in blood sample haemolysis and laboratory rejection.
1. Introduction
The World Health Organisation (WHO) report numerous studies showing that major complications due to preventable adverse events during clinical procedures are common (WHO, 2009). The ability to analyse the impact on the efficiency and probability of successful outcomes of a clinical procedure from deviations in the task sequence, variations in dependent variables and resource availability could reduce the risk of harm to patients and staff, and improve procedural outcomes. In addition, it would help healthcare providers use available money more efficiently and reduce patient waiting times through optimal use of resources and removal of process bottlenecks (Bayer, 2014).
According to the Institute to Healthcare Improvement applying reliability assessment techniques in healthcare can help to reduce failures, increase its consistency and improve patient outcomes (Nolan et al., 2004). These techniques have been widely applied for setting safety and reliability standards in system design, operation and maintenance (Amalberti et al., 2005). One of the traditional methods used in industry is the approach of probabilistic risk assessment, originally developed for improving safety of nuclear plants (Vesely, 1970), and later applied in many different settings ranging from aerospace (Frank, 1995) to process industry (Kelly and Lees, 1986). Such methods help the analyst to understand complex systems as a whole and they can be used to identify causes, severity and frequency of failures. Only a very limited number of publications appear on reliability analysis of clinical procedures, for example, estimating surgery risks (Zixian et al., 2011).
The objective of this study is to demonstrate the applicability of Petri net modelling (Wang, 1998) to the analysis of clinical procedures. Petri nets offer a graphical and mathematical notation for modelling stepwise procedures that include choice, random step outcomes, random step durations, iteration and concurrent execution. They enable task durations and outcomes to be simulated to efficiently analyse the procedure outcomes. Petri nets are widely used in reliability engineering (Schneeweiss, 1999) to model system failures and the application of maintenance procedures, for example, the authors in (Reed et al., 2013) used the technique to model maintenance procedures within the service support system of a functional product. Clinical procedures have many similarities with maintenance procedures performed on equipment in industry. They both consist of the application of often complex sequences of tasks by trained personnel to restore or maintain the physical condition of an object. Therefore, the Petri net modelling technique is potentially a useful tool for analysing clinical procedures. No publications demonstrating the use of Petri nets for modelling clinical procedures were found in the literature, although they have been used previously for modelling other aspects of healthcare, such as patient flows in medical services (Xiong et al., 1994).
practiced deviations from the guideline venepuncture procedure and variations in key dependent variables.
2. Methodology
The proposed methodology is described in this section.
Definitions
The reliability of a clinical procedure is defined as the probability that a blood sample is successfully obtained from a patient by a healthcare provider at the first attempt. The completion time of the procedure performance is defined as the duration of the procedure from initiation of the first task to completion of the last task.
Data Collection
To better understand the venepuncture process, a review of related literature, including practitioner guidelines and research papers, was conducted. Interviews with two secondary care doctors and two phlebotomists, each lasting around 30 minutes, were then carried out to obtain further qualitative data relating to the venepuncture procedure in practice. During the literature review, a total of 40 relevant documents were found and examined, which gave a general understanding of the procedure, factors influencing its reliability, and task durations.
The data from the interviews, together with the data from the literature review, was used to formulate appropriate questions for a questionnaire, suitable for obtaining quantitative data necessary for the model construction. The quantitative data that was sought for included task durations, the proportion of healthcare providers that in practice carried out specific deviations in the task sequence from the ones described in the guidelines, and task failure rates. A questionnaire that could be accessed through the internet consisted of 40 questions and it was distributed to doctors working at two UK hospitals (1688 and 96 doctors work in the two hospitals respectively). It contained questions about the average duration and its variation of each task, the order of tasks and the probability of failing the task of obtaining a blood sample in a single attempt. Further detail of the questionnaire can be found in Appendix 1.
The two secondary care staff categories, i.e. doctors and phlebotomists, were chosen due to their expression of interest in this study and availability to participate in the interviews and fill out the questionnaires. The doctors who were interviewed and participated in the study were junior doctors, who have been qualified for one year and they carry out around three venepunctures a day. The two phlebotomists had over ten years of experience and performed around 50 venepunctures a day.
Model Construction using Coloured Petri Nets (CPN)
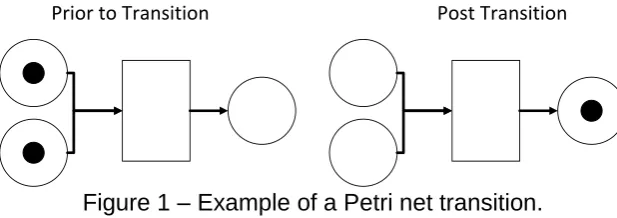
A simulation model was constructed using Petri nets, a graphical tool that can be used to model the dynamics of many types of system (Schneeweiss, 1999). A Petri net model represents the states that a system may be in and the transitions between these states using a directed bipartite graph in which nodes represent either a transition or place, shown in diagrams as unfilled rectangles and circles respectively. Directed arcs link places to transitions, known as input arcs, or transitions to places, known as output arcs. Places may contain 0 or more tokens, represented by filled circles. A transition is enabled when all of its input arcs have a separate token in their input place with which they can bind. When one or more transitions in a Petri net are enabled, one of the enabled transitions is selected randomly and fires. When a transition fires, the binding tokens associated with the input arcs are removed from their places and a token is deposited from each of the transition’s output arcs in the output places (see Figure 1). Timed Coloured Petri nets (Jensen and Kristensen, 2009) are an extension to Petri nets, where the tokens can have data (which may include a timestamp) attached to them, known as the token colour. This extension combines the primitives from the Petri net for describing process transitions with the expressive power of programming languages, also see Kristensen et al. (1998) for a practitioners guide to Timed Coloured Petri nets. A Timed Coloured Petri net model can be simulated using discrete event simulation (Leemis and Park, 2005), which moves the model through a sequence of transitions according to the probabilistic properties of the model. By performing a sufficient number of simulations, statistical properties on the behaviour of the system can then be determined.
[image:5.595.141.450.431.540.2]Prior to Transition Post Transition
Figure 1 – Example of a Petri net transition.
3. Model Development
In this section, the development of the Petri net model of the venepuncture procedure used in the study is described.
Venepuncture Procedure Analysis
The WHO guidelines for performing the venepuncture procedure (WHO, 2010) were chosen as the reference of best practice for the procedure tasks and sequence. According to these guidelines, the recommended tasks and sequence for the procedure are as follows:
1. Assemble the equipment
2. Prepare - complete paperwork, identify and prepare the patient. 3. Find vein and select entry site
4. Apply tourniquet 5. Perform hand hygiene 6. Disinfect the entry site
7. Insert needle and fill the sample tubes
8. Remove tourniquet. Note that the guidelines suggest removing the tourniquet as soon as the blood flow is established and always before it has been in place for two minutes or more
9. Post-sample - prepare samples for transportation, clean surfaces and complete patient procedure
From the literature review and interviews conducted in this study, three main types of procedural failure were identified: failure to obtain a sample from the patient in a single attempt, needle stick injury to the healthcare provider and rejection of a sample from the laboratory.
All of the interviewed healthcare providers stated that a piercing attempt during venepuncture could fail to initiate blood flow in a manner suitable for collection of a sample. The most common reasons for this were the vein being missed or the vein bursting at the point at which the needle is inserted. The main factors influencing the rate for this failure mode were stated by the interviewed healthcare providers, as being the prominence of veins of the patient and the skill of healthcare provider.
A needle stick injury occurs if a healthcare provider accidentally pierces themselves with a used needle and is considered very serious due to the risk of transmission of blood-borne diseases (Gaffney et al., 1992). Jagger et al. (1988) studied the number of needle stick injuries that were reported per 100,000 devices purchased and found that it depended on the device type used. For example, 6.9 injuries, 18.2 injuries and 25.4 injuries were reported per 100,000 disposable syringes, winged steel-needle intravenous sets and vacuum-tube phlebotomy assemblies that were purchased, respectively. Studies have also shown that needle stick injuries are often unreported, for example, Hamory (1983) found that 75% of injuries were unreported, whilst Gaffney et al. (1992) found that less than 5% of injuries were reported.
the most common reasons being haemolysis, insufficient sample quantity, contamination and incorrect labelling. Haemolysis (where red blood cells have ruptured and released their contents into the surrounding blood plasma) was found to be the most common reason in 60% of rejections. A study analysing prevalence of haemolysis in blood samples taken from adolescents (mean age of 17.3 years) (Vissers et al., 2008) found that 0.8% of samples were strongly (grade 2) haemolysed and concluded that more research into strategies for reducing haemolysis when taking samples is needed. A study by Saleem et al. (2009) showed that the duration with which the tourniquet is applied during blood sampling was the most significant factor in causing haemolysis, with times of over one minute resulting in an almost 20 times greater probability. Similar observations were published by Blazys (1999) and Becan-McBride (1999). A study by Barnard et al. (2016) found that the device type used to obtain a sample was a significant factor in the haemolysis rate, with sampling via an intravenous catheter associated with a significant increase in likelihood compared to sampling with a needle.
Responses to the questionnaire from a total of 17 individual healthcare providers (hospital doctors) were received. An analysis of the questionnaire responses identified the following deviations from the guideline procedure were commonly performed by the surveyed healthcare providers:
Performing hand hygiene prior to applying the tourniquet (52% of healthcare providers).
Application of tourniquet prior to finding the vein and selecting the entry site (71% of healthcare providers).
Skipping the disinfection step (14% of healthcare providers).
Release of tourniquet sometime after blood flow is established:
o During filling of last sample tube before it is full (14% of healthcare providers).
o When all sample tubes are full (72% of healthcare providers).
The collected data revealed that the success of collecting a blood sample in a given attempt depends primarily on the prominence of the veins of the patient. Veins were reported as being much less visible and prominent in patients who are elderly, with certain illnesses, such as alcoholism, or undergoing certain treatments, such as chemotherapy.
needle. However, since no statistically significant dependence between the probability and the type of needle was found, this variable was not considered further.
Based on the above analysis, three variations of the procedure were modelled:
A. Guidelines (normal case) - Remove the tourniquet when the blood flow is established, patients are not from the difficult patient group, and the healthcare provider is working on a familiar ward.
B. Guidelines (difficult case) - Same as variation A, but with patients from the difficult patient group, and the healthcare provider is working on an unfamiliar ward.
C. Common practice (normal case) - Same as variation A, but with step 4 performed before step 3 (common practice for 71% of healthcare providers in data collection) and the tourniquet released after all sample tubes are filled (common practice in 72% of healthcare providers based on collected data).
Task models
Task Durations: The uniform distribution was chosen to model the duration of each task when the minimum and maximum values were estimated during the data collection, with extreme outlier values excluded. The uniform distribution was deemed most appropriate since the data suggested that the time to complete a task was approximately equally probable for all values within a certain range. Table 1 gives the estimated minimum and maximum values for the duration. For example, the values for “Hand hygiene” were derived from the answers to the question “How long on average, in seconds, does performing the hand hygiene steps take?”, where most of the values were between 20 and 40 seconds. Note that for the task “Assemble Equipment” two sets of values are derived for the case when the healthcare provider has an equipment trolley or is working on a familiar ward, and for the case where they are working on an unfamiliar ward with a non-standardised layout. Similarly, for the task “Find Vein”, two sets of values are given depending on whether a patient has veins classified as normal or difficult. Such assumptions are described in the subsection above.
Task Minimum and maximum duration in seconds 1 – Assemble Equipment Familiar ward or trolley: 20 - 40,
Unfamiliar ward: 40 - 360
2 - Preparation 90 - 180
3 – Find vein Normal veins: 15 - 60
Difficult veins: 60 - 240
4 – Apply tourniquet 5 - 10
5 – Hand Hygiene 20 - 40
6 – Disinfect entry site 15 - 30
8 – Remove tourniquet 5 -10
9 – Post sample 60 -180
Table 1. Duration of the individual tasks in the venepuncture procedure
Task Failure: To avoid patient discomfort in non-emergency situations, a healthcare provider should limit the number of attempts made at piercing the patient to collect a blood sample. The modelling assumption was therefore made that after three failed attempts at collecting a blood sample from an individual patient, no further attempts will be made and no sample will be collected. A probabilistic model was used to select the outcome for the task of a single attempt to pierce a patient and collect a blood sample. Three mutually exclusive possible outcomes were considered, consisting of successful initiation of blood flow, failure to initiate blood flow and needle stick injury to the healthcare provider. A value of 0.001 was chosen for the probability that a needle stick injury occurs. This was estimated based on the studies into the number of incidents that are reported per device purchased (Jagger et al., 1988) and the proportion of incidents that are reported (Gaffney et al., 1992; Hamory, 1983).
If a needle stick injury does not occur, then the probability of the failure to initiate blood flow and collect a sample in an individual piercing attempt was modelled using a triangular distribution where the values for the minimum, maximum and modal probabilities are dependent on the patient group (normal or difficult) and the percentile of vein prominence for the patient within their patient group. For the difficult patient group the chosen values for the minimum, maximum and modal probabilities of failure were 0.15, 0.80 and 0.25 respectively; for the normal patient group, respective values of 0.01, 0.30 and 0.10 were used. These probabilities were estimated based on an analysis of the questionnaire responses that asked the healthcare providers to estimate the proportion of failed attempts for these two patient groups and using the answers to questions, such as “What percentage of attempts would you estimate that you fail to obtain a sample (e.g. missed or burst vein) with this device type for a patient with normal veins?”. Most of the answers were between 1% and 30% with the mode value of 10%, which have been derived using Microsoft Excel. No statistically significant dependence between the probability and the type of needle was found, therefore, the data from all three needle types was collated for the analysis.
Coloured Petri net model of the venepuncture procedure
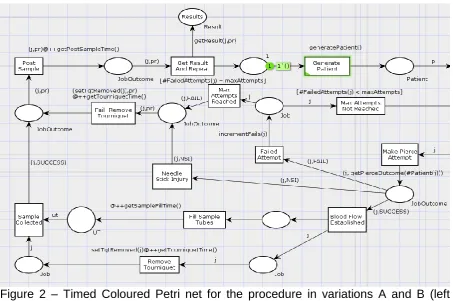
The Timed Coloured Petri net for variations A and B (i.e. the guideline procedure with normal and difficult case), split into left and right segments, is shown in Figures 2 and 3. The model for variation C, i.e. the common practice variation, is similar to this model but with a different task sequence that reflects the deviations from the guideline procedure, and is not presented in the paper .The Petri net model for these variations will now be described. A detailed code used in the CPN Tools software is presented in Appendix 2.
If the outcome variable on the token has the value “SUCCESS”, then the “Blood Flow Established” task is enabled and fires. This outputs a token in each of its output places, where one of the places receives a token, j, that is coloured and stores information on the job, and the other place receives an uncoloured token.. The “Fill Sample Tubes” and “Remove Tourniquet” transitions are enabled by these tokens and they fire simultaneously, simulating that these actions are performed in parallel.The firing of the “Remove Tourniquet” transition also results in the “setTqtRemoved” function setting the variable that records the time the tourniquet was last removed to the current simulation time. The model, therefore, records the duration of tourniquet application. Once both tasks are completed, the “Sample Collected” transition becomes enabled and it fires. The coloured token representing the job and the “SUCCESS” outcome is then deposited in the output place, which leads to the “Post Sample” transition After a delay in the simulation time equal to the time increment of the post sample, the token enables the “Get Result and Repeat” transition and causes it to fire. This causes the “getResult” function to generate a token representing the overall result of the procedure, which is deposited in the output place labelled “Results”. The result consists of the time taken to complete the procedure, the result of the final attempt at piercing (i.e. success, failure or needle stick injury) and whether haemolysis or laboratory rejection occurred. The “getResult” function uses random sampling with the failure mode models to determine whether haemolysis (where the probability is dependent on the tourniquet application time, which is stored on the input token to the transition) or laboratory rejection occur. The firing of the transition also deposits an uncoloured token to the other output place, which is also an input to the “Generate Patient” transition. The entire Petri net simulation process is then repeated in order to simulate the performance of the venepuncture procedure on a new patient.
If the outcome from the “Make Pierce Attempt” transition is “FAIL” (instead of SUCCESS), then the “Failed Attempt” transition is enabled. The firing of this transition also causes the “incrementFails” function to increase the value of the token variable, representing the number of failed attempts, by one. If the updated value equals to the maximum number of attempts allowed (three assumed in this model), then the “Max Attempts Reached” transition becomes enabled. The “Fail: Remove Tourniquet” transition is then enabled. If, after a failed piercing attempt, the maximum number of attempts has not been reached, and then the “Max Attempts Not Reached” transition is enabled. This causes the “Remove Tourniquet and Try Again” transition to become enabled and firing, depositing a token in its output place, as shown in Figure 3. The transition also results in the “setTqtRemoved” function setting the variable, that records the time the tourniquet was last removed, to the current simulation time, and a new tourniquet completion time is generated. After this process, the token enables the “Find Vein” transition, and the Petri net simulation process for simulating the procedure for the repeated attempt at collecting a blood sample follows in the same way, as for the first attempt.
Figure 2 – Timed Coloured Petri net for the procedure in variations A and B (left segment).
Figure 3 – Timed Coloured Petri net for the procedure in variations A and B (right segment).
4. Results obtained from the model
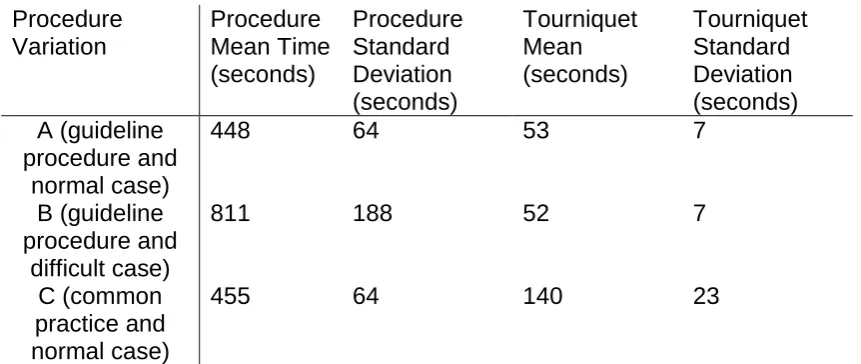
[image:12.595.72.526.411.642.2]Table 2, whilst the probability of occurrence for each failure mode is shown in Table 3. Procedure Variation Procedure Mean Time (seconds) Procedure Standard Deviation (seconds) Tourniquet Mean (seconds) Tourniquet Standard Deviation (seconds) A (guideline procedure and normal case)
448 64 53 7
B (guideline procedure and
difficult case)
811 188 52 7
C (common practice and normal case)
455 64 140 23
Table 2. Model outputs of durations in seconds.
Procedure Variation Failure to Collect Sample Needle Stick Injury Haemolysis Laboratory Rejection Other Laboratory Rejection Overall unreliability A (guideline procedure and normal case)
0.0022 0.0008 0.0002 0.0016 0.0048
B (guideline procedure and
difficult case)
0.0378 0.0024 0.0002 0.0014 0.0418
C (common practice and normal case)
0.0018 0.0010 0.0020 0.0012 0.0060
Table 3. Model outputs of failure mode probabilities.
The simulated mean duration of the procedure increased by over 75% for variation B, where patients from the difficult patient group on an unfamiliar ward are considered, compared to variations A or C. This significant increase shows that when planning resources consideration must be given to the types of patient and whether the procedure will be performed on unfamiliar wards (for example, allocating extra time when patients are elderly). Variations A and C, representing the guideline procedure and the commonly practiced procedure deviations respectively, have simulated durations that are almost identical. The model results, therefore, suggest that the commonly practiced deviations from the guideline do not result in reduced completion time.
[image:13.595.64.522.332.505.2]attempt is far greater for variation B, which also results in a higher needle stick injury probability due to a higher number of repeated attempts and needles used.
Figure 4 – Tourniquet time in procedure variations A and C.
5. Summary and Conclusions
It is important to understand the relationship between the execution of a clinical procedure, including the task sequence and values of key dependent variables, and the implications for success rates, completion times and the safety of patients and healthcare providers. The Petri net technique has been widely used in reliability engineering, including for the modelling of maintenance procedures which have many similarities to clinical procedures. It is a powerful technique that combines formal mathematical notation with the ability to simulate complex procedures that include probabilistic task outcomes, probabilistic durations, concurrent task execution and iteration. The objective of this work was to apply this technique to modelling the venepuncture procedure where a healthcare provider collects a blood sample from a patient. A detailed qualitative and quantitative understanding of the venepuncture procedure was gained through a literature review and obtaining details on current practice through interviews and questionnaire responses from healthcare providers who regularly perform the procedure. This research resulted in the identification of the commonly practiced deviations from the guidelines for the procedure task sequence. It also identified the common failure modes and safety risks and the key variables that influence the rate at which these can occur.
A model based on the Timed Coloured Petri net methodology was then developed to analyse the reliability and efficiency for three variations of the venepuncture procedure. Two important findings were that, (1) better organisation and standardisation of equipment locations in wards would improve the efficiency significantly; and (2) that deviations from procedure guidelines that are common in practice may be resulting in a significant increase in the risk of haemolysis and therefore the risk of laboratory rejection. The second point should be considered seriously, since such variations can significantly increase the time until patient blood
sample test results can be obtained due to the fact that it is only revealed some time later (i.e. once delivered to the lab).
A limitation of this study was that the sample size of the collected data was very small; therefore, further research would be needed to increase the level of confidence in these findings for the venepuncture procedure. However, the study was successful in its main objective of demonstrating that the Petri net technique is just as viable and effective as a method for analysing clinical procedures as it is for maintenance procedures. It would be of great value to collect further data, including live observations of healthcare providers performing the procedure. Areas in which additional data would be particularly useful are the analysis of vein prominence within various patient groups (e.g. illness, treatment and age) and the influence of vein prominence and needle type on the occurrence rates of the identified failure modes. Such data could be used to make further evidence-based recommendations on best practice, such as the sequence of the tasks in the procedure and the choice of needle based on patient attributes. The data collection could also be extended by following through samples to the lab.
Venepuncture was chosen for this study due to it being a relatively simple and commonly used clinical procedure. It would be worthwhile extending the study of the application of the Petri net simulation modelling technique to clinical procedures to more complex procedures, such as a surgery which is performed by a team of healthcare providers, so that further evidence of its suitability to clinical procedures in general could be obtained. Further developments in the methodology could include calculating importance measures to identify the critical areas of the procedure and evaluating the efficiency of resource usage. The methodology has the advantage of enabling the effects of potential changes in the medical practice to be evaluated before an investment in its implementation is required.
Acknowledgements
The authors would like to thank the healthcare providers who donated their time to take part in the interviews and questionnaires for their contribution to this research.
References
Amalberti, R., Auroy, Y., Berwick, D., Barach, P., 2005. Five System Barriers to Achieving Ultrasafe Health Care. Ann. Intern. Med. 142, 756–764.
doi:10.7326/0003-4819-142-9-200505030-00012
Barnard, E.B.G., Potter, D.L., Ayling, R.M., Higginson, I., Bailey, A.G., Smith, J.E., 2016. Factors affecting blood sample haemolysis : a cross-sectional study 143– 146. doi:10.1097/MEJ.0000000000000195
Bayer, S., 2014. Simulation modelling and resource allocation in complex services. BMJ Qual. Saf. 23, 1–3. doi:10.1136/bmjqs-2013-002742
Becan-McBride, K., 1999. Laboratory Sampling: Does the Process Affect the Outcome? J. Intraven. Nurs. 22, 137.
Blazys, D., 1999. Clinical Nurses Forum. J. Emerg. Nurs. 25, 529–530. doi:10.1016/S0099-1767(99)70021-8
NASA. Reliab. Eng. Syst. Saf. 49, 311–324. doi:10.1016/0951-8320(95)00048-7 Gaffney, K., Murphy, M., Mulcahy, F., 1992. Phlebotomy practices/needles stick
injuries/hepatitis B status/among interns in a Dublin hospital. Ir. Med. J. 85, 102– 4.
Hamory, B.H., 1983. Underreporting of needlestick injuries in a university hospital. Am. J. Infect. Control 11, 174–177.
Jagger, J., Hunt, E.H., Brand-Elnaggar, J., Pearson, R.D., 1988. Rates of Needle-Stick Injury Caused by Various Devices in a University Hospital. N. Engl. J. Med. 319, 284–288. doi:10.1056/NEJM198808043190506
Jensen, K., Kristensen, L., 2009. Coloured Petri Nets. Springer.
Jones, B.A., Calam, R.R., Howanitz, P.J., 1997. Chemistry specimen acceptability: A College of American Pathologists Q-Probes study of 453 laboratories. Arch. Pathol. Lab. Med. 121, 19–26.
Kelly, B.E., Lees, F.P., 1986. The propagation of faults in process plants: 2. Fault tree synthesis. Reliab. Eng. 16, 39–62. doi:10.1016/0143-8174(86)90071-5 Kristensen, M.L., Christensen, S., Jensen, K., 1998. The practitioner’s guide to
coloured Petri nets. Int. J. Softw. Tools Technol. Transf. 2, 98–132. doi:10.1007/s100090050021
Leemis, L., Park, S.K., 2005. Discrete Event Simulation: A First Course, 1st ed. Prentice Hall.
Nolan, T., Resar, R., Haraden, C., Griffin, F., 2004. Improving the Reliability of Health Care: IHI Innovation Series white paper. Inst. Healthc. Improv.
Ratzer, A.V., Wells, L., Lassen, H.M., Laursen, M., Qvortrup, J.F., Stissing, M.S., Westergaard, M., Christensen, S., Jensen, K., 2003. CPN Tools for Editing, Simulating, and Analysing Coloured Petri Nets, in: Applications and Theory of Petri Nets 2003: 24th International Conference. Springer Berlin Heidelberg, Eindhoven, The Netherlands, pp. 450–462. doi:10.1007/3-540-44919-1_28 Reed, S., Andrews, J., Dunnett, S., 2013. Simulation driven design of functional
products : a tool for evaluation of hardware reliability and maintenance. Int. J. Prod. Dev. 18, 48–67.
Saleem, S., Mani, V., Chadwick, M.A., Creanor, S., Ayling, R.M., 2009. A
prospective study of causes of haemolysis during venepuncture: tourniquet time should be kept to a minimum. Ann. Clin. Biochem. 46, 244–6.
doi:10.1258/acb.2009.008228
Schneeweiss, W.G., 1999. Petri Nets for Reliability Modeling, 1st ed. LiLoLe-Verlag. Vesely, W.E., 1970. A time-dependent methodology for fault tree evaluation. Nucl.
Eng. Des. 13, 337–360. doi:10.1016/0029-5493(70)90167-6
Vissers, D., Matthyssen, B., Truijen, S., Blommaert, S., Van De Velde, K., Van Gaal, L., 2008. Fainting and hemolysis during blood sampling in youngsters:
Prevalence study. Int. J. Nurs. Stud. 45, 760–764. doi:10.1016/j.ijnurstu.2006.12.014
Wang, J., 1998. Timed Petri Nets: Theory and Application, 1st ed. Springer. World Health Organisation, WHO guidelines for safe surgery, 2009.
World Health Organisation, WHO guidelines on drawing blood: best practices in phlebotomy, 2010.
Xiong, H., Zhou, M., Manikopoulos, C., 1994. Modeling and performance analysis of medical services systems using Petri nets, in: IEEE International Conference on Systems, Man, and Cybernetics. doi:10.1109/ICSMC.1994.400215
Saf. 96, 1591–1600. doi:10.1016/j.ress.2011.08.004
Appendix 1 Questionnaire About You
What is your job title? (doctor, phlebotomist, other) How many years since you qualified in the above role?
Which of the following types of training in venepuncture have you
undertaken? (workbook, classroom, examination, supervised practice, other) In a typical week, approximately how many patients do you perform
venepuncture on? Preparation steps
How long do you spend on average, in seconds, on administrative tasks (paperwork, computer data entry etc.) to prepare for performing the procedure on each patient?
How many seconds either side of that average would cover approximately 99% of cases?
For example, if you gave the average as 30 seconds and 99% of cases fall within 20 seconds of that average (i.e. between 10 and 50 seconds), then give your answer as 20. In other words, the maximum variation from the average excluding the extreme 1% of cases.
Where do you collect your equipment (needles, sample tubes, gloves etc)? (trolley, ward, other)
How long on average, in seconds, does it take you to collect and prepare the equipment?
How long do you spend on average, in seconds, finding a vein entry site for a patient with normal veins?
How many seconds either side of that average would cover approximately 99% of cases?
How long do you spend on average, in seconds, finding a vein entry site for a patient with difficult veins?
Indicate how often you put on gloves to perform the procedure? (between 1 (never) and 5 (always))
When do you perform hand hygiene (washing, putting on gloves)? (before applying tourniquet, after applying tourniquet)
How long on average, in seconds, does performing the hand hygiene steps take
When do you apply the tourniquet to the patient? (before finding the entry site, after finding the entry site)
How long on average, in seconds, does applying the tourniquet take? At what point during blood collection do you release the tourniquet? (when blood starts to flow, when first sample tube is full, when most sample tubes are full, when all samples tubes are full , other)
Please indicate how often you disinfect the chosen entry site on the patient? (between 1 (never) and 5 (always))
If yes, how long on average, in seconds, do you take to apply disinfectant and allow it to take affect before inserting the needle?
Obtaining the blood samples
Do you ever use hypodermic single-use needle and syringe? (yes, no) Do you ever use a vacuum-tube system? (yes, no)
Do you ever use a winged steel needle (butterfly)? (yes, no)
Note that the next four questions are repeated for the three types of needle. How long does it take on average, in seconds, between piercing and obtaining the blood samples with this device type?
What percentage of attempts would you estimate that you fail to obtain a sample (e.g. missed or burst vein) with this device type for a patient with normal veins?
What percentage of attempts would you estimate that you fail to obtain a sample (e.g. missed or burst vein) with this device type for a patient with difficult veins?
What percentage of attempts would you estimate that a needle stick injury would occur on average with this device type?
Do you have a maximum number of attempts to pierce a vein before you would pass it on to a colleague? (yes, no)
If yes to the previous question, please state the number of attempts. Post Sample Steps
How long on average, in seconds, do you spend on the procedure after the samples are collected (e.g. disposal of equipment, applying gauze to pierce site, paperwork etc.)?
How many seconds either side of that average would cover approximately 99% of cases?
Appendix 2
CPN Tools software code Declarations
Standard priorities
val P_HIGH = 100; val P_NORMAL = 1000; val P_LOW = 10000; Standard declarations
colset UNIT = unit; colset BOOL = bool; colset INT
colset INTINF colset TIME colset REAL colset STRING
colset Patient = record IsDifficult: BOOL * Percentile: REAL; colset UT = UNIT timed;
colset Job = record Patient: Patient * Created: REAL * FailedAttempts: INT * TqtLastApplied: REAL * TqtLastRemoved: REAL timed;
colset PierceOutcome = with SUCCESS | NSI | FAIL; colset JobOutcome = product Job * PierceOutcome timed;
colset Result = record TotalTime: REAL * Outcome: PierceOutcome * TqtTime: REAL * Hem: BOOL * LabRej: BOOL;
fun getAssembleTime() = uniform(20.0,40.0) fun getHHTime() = uniform(20.0,40.0)
fun getFindVeinTime() = uniform(15.0,60.0) fun getTourniquetTime() = uniform(5.0,10.0) fun getDisinfectTime() = uniform(15.0,30.0) fun getSampleFillTime() = uniform(20.0,80.0) fun getPostSampleTime() = uniform(60.0,180.0) fun incrementFails(j:Job) = {Patient=(#Patient(j)),
Created=(#Created(j)), FailedAttempts=(#FailedAttempts(j)) + 1), TqtLastApplied=(#TqtLastApplied(j)),
TqtLastRemoved=(#TqtLastRemoved(j))}; fun generatePatient() = {IsDIfficult=false, Percentile=uniform(0.0,100.0)};
fun setTqtApplied(j:Job)={Patient=(#Patient(j)), Created=(#Created(j)), FailedAttempts=(#FailedAttempts(j)), TqtLastApplied=time(),
TqtLastRemoved=(#TqtLastRemoved(j))};
fun setTqtRemoved(j:Job)={Patient=(#Patient(j)),
Created=(#Created(j)), FailedAttempts=(#FailedAttempts(j)), TqtLastApplied=(#TqtLastApplied(j)), TqtLastRemoved=time()}; val maxAttempts = 3;
var pr: PierceOutcome; var p: Patient;
var ut: UT; var j: Job;
fun triangularQuantile(q,a,b,c) = let
val U = q in
if U < ((c-a)/(b-a))
then a + Real.Math.sqrt(U*(b-a)*(c-a)) else b - Real.Math.sqrt((1.0-U)*(b-a)*(c-a)) end
fun getPierceOutcome(p:Patient) = let
val failPercent = if #IsDifficult(p) then triangularQuantile(#Percentile(p)/100.0, 15.0, 25.0, 80.0) else triangularQuantile(#Percentile(p)/100.0,1.0,10.0,30.0) val nsiOutcome = uniform(0.0, 100.0)
val outcome = uniform(0.0, 100.0) in
if nsiOutcome < 0.1 then NSI else if outcome > failPercent then SUCCESS else FAIL
end
fun getResult(j:Job, pr:PierceOutcome) = let
val tqtTime = #TqtLastRemoved(j) - #TqtLastApplied(j)
val hemOutcome = uniform(0.0,100.0)
val hemolysis = if pr = SUCCESS andalso hemOutcome <= hemProbability then true else false
val labRej = if uniform(0.0, 100.0) < 0.14 then true else false in
{TotalTime=time() - #Created(j), Outcome=pr,TqtTime=tqtTime, Hem=hemolysis, LabRej=labRej}