45
Journal of the Statistical and Social Inquiry Society of Ireland Vol. XXXVII
SECOND TIER CHILD INCOME SUPPORT: THE CASE FOR INNOVATION Dr. J. Sweeney
Secretariat, National Economic and Social Council
(read before the Society, 22 November 2007)
__________________________________________________________
Abstract: Total and per child spending on child income supports are at high levels, and so are child poverty and the proportion of children being reared in jobless households. While the role of child income supports in alleviating child poverty should not be exaggerated, it can be improved. Most of the per child support received by low income families now takes the form of universal payments. These create no employment disincentive but, by giving almost one euro to families in the top half of the income distribution for each euro going to the bottom half, effectively accord child poverty a low priority. There has been a long interest in a new form of targeting that would enable priority be given families on the basis of low income alone, create no employment disincentive and be slowly withdrawn as family income rises. The principal difficulties in paying what would, in effect, be a supplement to Child Benefit but received only by low income families are administrative. Identifying ‗family income‘ and delivering support to parents in work and those reliant on social welfare smoothly and equitably will entail significant innovations in the public administrative system. The requisite steps are identified in this paper. It should also be appreciated that achieving the necessary retooling of data and delivery systems would allow the new form of targeting to be applied to other supports as well (e.g., childcare subventions).
Keywords: Allocative efficency, Welfare, Poverty, Child welfare JEL Classifications: D61, H53, I32, I38, J13
1. INTRODUCTION
This paper examines the five current instruments which deliver child income support in order to assess the case for adopting a new form of targeting children in low income households. Sections 2 and 3 briefly invoke the origins of the current ‗system‘ of child income support and the wider context to combating child poverty1, while Section 4 summaries the evidence that levels of child income poverty continue at a high level. The heart of the paper is in Sections 5 and 6. Section 5 conducts a detailed examination of the strengths and weaknesses of each current instrument if further resources were to be channelled through it in a bid to reach the children still below the income poverty line. Section 6 addresses the question of reform, using some selected international examples to make the case for introducing a new form of targeting. It identifies the practical innovations required of public data and delivery systems in order to implement the new form of targeting.
1
46
2. THE RECURRING THEME OF A „SECOND TIER‟ TO CHILD INCOME SUPPORT
The effectiveness of Child Dependant Additions (CDAs) and Family Income Supplement (FIS) in functioning as a loosely coordinated second tier of child income support has been under discussion for quite some time. The 1986 report of the Commission on Social Welfare (CSW) endorsed what are still the essential contours of Ireland‘s child income support system. Child Benefit (CB) as a first tier reaches all families, while CDAs and FIS form a second tier for low-income families split into two groups – those reliant on social welfare receive CDAs along with their CB, and those on low earnings receive FIS along with their CB.
Ten years later, an Expert Working Group on the Integration of the Tax and Social Welfare Systems (1996) reviewed the system and explored some major alternatives. It was concerned that CDAs and FIS were creating significant work disincentives: CDAs create an ‗unemployment trap‘ because families only received them if they remain on social welfare; FIS creates a ‗poverty trap‘ because the withdrawal of the benefit as earnings rise adds to the onset of other tax obligations to absorb a potentially major part of any increase in earnings.
In the final analysis, the 1996 Report did not recommend fundamental reform but proposed instead (in an Interim and Final Report) a range of partial measures that could be implemented immediately to smooth the transition from welfare to work (e.g., retention of secondary benefits for a period, retention of CDAs for 13 weeks for the long-term unemployed, retention of part of the main welfare payment on a declining basis, higher earnings disregards, etc.). It made several pertinent observations on the balance to be struck between piecemeal and fundamental reform, however, that remain useful and relevant to the contemporary challenge of further improving Ireland‘s child income supports:
i. Benefit withdrawal rates cannot be avoided ‗in any social welfare system (where) earning money implies losing entitlement to benefit‘ (1996: 7). Either high benefit withdrawal rates are imposed on a relatively small part of the population, or lower tax/withdrawal rates are faced by a much larger section of the population.
ii. Making supports universal (like Child Benefit) avoids imposing benefit withdrawal rates on small or large subgroups in the population but only by imposing higher taxes on the whole of it. A society that provides an extensive range of supports and services, without either income testing or user charges, must levy taxes at a higher level to provide such ‗free‘ access.
iii. Effective social protection, which respects people‘s capacity and need for self-reliance, requires that its different strands develop in an integrated fashion and not in parallel. The 1996 Expert Group essentially wrestled with the unforeseen by-product of what, in isolation, were each a necessary social development, viz. the protection of the real incomes of people out of work and tax reductions for workers on low earnings: ‗several policy objectives being pursued in parallel on their own merits [contribute] to unemployment and poverty traps‘ (1996: 21).
47
In confirmation of this last point, there have been, since 1996, several major extensions and developments in the existing instruments. The calculation of FIS was changed to a net income basis in 1998 and its per-child payments to large families given particularly substantial increases in 2006. A major increase in the value of Child Benefit took place over the period 2001-03, and an Early Childcare Supplement for all children under the age of six was introduced in 2006. The freeze in the value of CDAs was rescinded in the 2007 Budget and they were given their first increase since 1994. The implication of these substantial improvements is, indeed, that it has become more difficult to propose and seriously explore fundamental alternatives to the present instruments.
3. CHILD INCOME SUPPORTS: NOT THE WHOLE ANSWER TO CHILD POVERTY Countries with low child poverty rates tend, in fact, not to have relied on a ‗magic bullet‘ but on the cumulative contributions of a range of policies: good services for children and good child income supports, high employment rates and good adult social welfare payments. They typically achieve low poverty rates for adults and children. The particular contribution of a remodelled second tier child income payment to alleviating child poverty, therefore, needs to be part of an integrated strategy that embraces the several channels through which public support is provided to households in which children are being reared.
In fact, as the level of spending on child income support is now high, it can be argued that Ireland‘s overall strategy for ending child poverty needs to bring complementary factors into sharper focus if we are to increase the effectiveness of any given level of spending on child income supports. While the focus of this paper is on the contribution a reform internal to the system of child income support can make, it is important not to lose sight of other factors with a major role to play.
Four propositions, in particular, can be advanced as central to advancing Ireland‘s overall strategy for reducing, even ending, child poverty.
i. Families on low incomes need to have access to quality services for their children even while – or if – they remain on low incomes.
ii. Parental well-being is a major mediating factor determining whether and how low family income impacts negatively on child wellbeing, it needs to be independently addressed.
iii. Ensuring parents can earn without sacrificing their caring responsibilities remains the single best route to keeping children from poverty.
iv. Adult welfare payments influence ‗children‘s incomes‘ as much, or more, than child income supports.
48
4. CHILDREN IN LOW INCOME HOUSEHOLDS IN IRELAND: THE EVIDENCE The picture, as sketched by EU-SILC, can be simply described: one in five children in Ireland were ‗at risk of poverty‘ in 2005 and one in ten living in households experiencing significant deprivation. Table 1 shows the ‗at risk of poverty‘ rate for children (at the 60 per cent line) from 1994 to 2005 and compares it with that of working age adults and older people.
Table 1: Percentage of Persons Below 60 per cent Median Income Poverty Line by Age, 1994-2005
Age Group 1994 1997 2000 2003
(revised)
2005
0-141 24.5 23.5 23.7 21.0 21.2
15-641 12.1 14.7 16.4 17.6 17.4
65+ 5.9 24.2 38.4 29.8 20.1
All 15.6 18.2 20.9 19.7 18.5
Source: Whelan et al. (2003); CSO (2005, 2006)
Note 1: Until2000 inclusive, the figures are for 0-17 year olds and 18-64 year olds.
From 1994 until the year 2000, almost one quarter of all children were estimated at any one time to be in households where equivalent disposable income was below 60 per cent of the median (Table 1). By 2005, a small improvement had been recorded but 21 per cent of children were still below this income line. The ‗at risk of poverty‘ rate for children had been double that for working-age adults in 1994 but the gap closed markedly, falling from 12.4 percentage points to 3.8 percentage points in 2005. Over the twelve years, children first ceded to older people, and then regained, the regrettable characteristic of being the age group most at risk of falling below the 60 per cent of median income line. The relative incomes of older people deteriorated particularly dramatically over the 1994-2000 period, but a major improvement took place after the year 2000, a tribute to the significant improvements in the rate of the state pension that occurred.
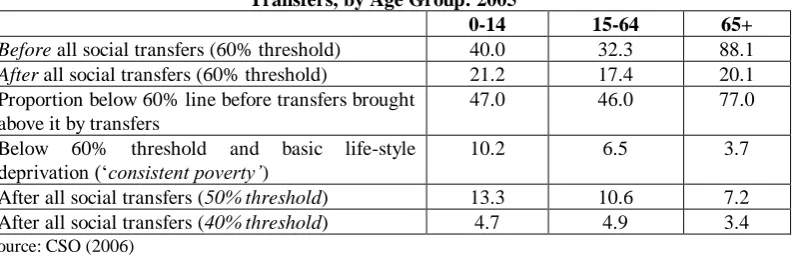
[image:4.595.106.504.613.741.2]The extent to which each age group is dependent on social welfare transfers to be pulled above the 60 per cent of median income line can be gauged by comparing the at-risk-of-poverty rates before and after social transfers (Table 2). Social welfare transfers of every type lifted 19 per cent of all children (0-14) above the 60 per cent line in 2005, or 47 per cent of the children whose household incomes from market sources alone would have left them below it. They had a similar impact on the circumstances of people aged 15-64 but a much more decisive impact for older people. Social welfare pensions raised two in every three people aged 65 or older above the 60 per cent of median line in 2005; almost 80 per cent of those who would have been below the line on the basis of market income alone were ‗rescued‘ by their social welfare pensions.
Table 2: Percentage of Persons below Different Poverty Lines, Before and After Social Transfers, by Age Group: 2005
0-14 15-64 65+
Before all social transfers (60% threshold) 40.0 32.3 88.1
After all social transfers (60% threshold) 21.2 17.4 20.1
Proportion below 60% line before transfers brought above it by transfers
47.0 46.0 77.0
Below 60% threshold and basic life-style deprivation (‗consistent poverty‟)
10.2 6.5 3.7
After all social transfers (50% threshold) 13.3 10.6 7.2 After all social transfers (40% threshold) 4.7 4.9 3.4
49
Where children are below the income threshold that signals a poverty risk, they are further below it than older people. Their greater ‗poverty gap‘ is confirmed when more stringent income thresholds are used. Over 60 per cent of children below the 60 per cent line were also below the 50 per cent line and 22 per cent of them below the 40 per cent line (extremely low incomes indeed); the same was true of only 36 per cent and 17 per cent of pensioners. It is not surprising, therefore, that the measure of ‗consistent poverty‘, which combines low incomes with evidence of enforced material deprivation, estimated that 10 per cent of all children in 2005 were in households with incomes so low that purchases protecting a basic lifestyle could not be afforded. This was almost three times the rate for older people, though the two age groups had similar ‗at risk of poverty‘ rates.
In the context of Ireland‘s strong economic and employment growth since 1995 and of major increases in Child Benefit and improvements to other child income supports since 2001, this outcome for children can only be judged unsatisfactory. Child poverty has stayed stubbornly high despite a buoyant labour market, rising earnings and steady improvements in what has become one of Europe‘s best national minimum wages. Ireland, in fact, ranked in the weakest third of EU 15 Member States in 2005.2 This outcome is doubly disappointing if one accepts that, far from being neglected or ignored, the issue of child poverty has been extensively highlighted and debated by NGOs, policy makers and politicians. In short, ‗the continuing high levels of child income poverty constitute a very poor return to the State and society from the major increase in spending on child income supports which has taken place‘ (NESC, 2005: 155). For some insight into what is going wrong, it is useful to recall key features of some analyses of child poverty carried out on data for the second half of the 1990s.
When the population in consistent poverty in the year 2000 was examined, it was clear that parental non-employment rather than family type had become the single most important factor associated with a high risk of child poverty (Table 3). For example, children of couples neither of whom were working ran a poverty risk four times higher than children of employed lone parents. At the same time, however, nearly one half of all children in consistent poverty had at least one parent in employment. This type of evidence was a clear invitation, even then, to develop policy responses to child poverty in a way that both encouraged parents to cross from non-employment to work and provided in-work support to parents with low earnings.
2
50
Table 3: Risk and Incidence of Consistent Poverty (Below 60 per cent Income Threshold and Basic Deprivation) for Children by Household Type and Labour Force Status Of
Parents
1994 2000
Risk of consistent poverty
At Work Two parents, both working 4.0 1.2
Lone parent, working 9.8 8.2
Two parents, one working 14.5 9.7
Not Working Two parents, none working 72.5 33.3
Lone parent, not working 69.3 44.0
Others 16.8 7.2
Total 25.2 8.2
Incidence of consistent poverty
At Work Two parents, both working 3.6 5.9
Lone parent, working 1.1 4.7
Two parents, one working 21.8 35.8
Sub-total (26.5) (46.4)
Not Working Two parents, none working 41.1 15.8
Lone parent, not working 23.3 22.8
Sub-total (64.4) (38.6)
Others 9.2 15.0
Total 100 100
Source: data supplied by ESRI for analysis in NESC (2003)
An ESRI team analysed the dynamics of child poverty, covering the 1994-2001 period.3 Though major policy developments affecting poor households with children have since taken place since, their analysis throws considerable light on the problem policy has, subsequently, been seeking to solve. Their research identified how often and for how long the same child was in a household below the 60 per cent of median income line. The picture that emerged was sobering (Table 4). Over the eight-year period, 1994-2001, more than one fifth of all children were below the ‗at risk of poverty‘ income threshold for a consecutive period of at least three years (termed ‗persistent poverty‘). A further ten per cent were below the 60 per cent line more than once but not for longer than two years at any one time (‗recurrent poverty‘). In fact, a sharply polarized picture was painted: one half of all children were never below the 60 per cent threshold during the eight-year period, while one fifth was below it for a continuous period of three eight-years or longer. Layte et al. (2006) also inquired into the characteristics of the households of the 21.4 per cent of children who experienced persistent poverty over this period. Two of their findings are particularly pertinent to this study. A child‘s risk of ‗persistent poverty‘ was strongly correlated with a high degree of welfare dependence in a child‘s household at the start of the period. 62 per cent of children in households that relied on social welfare for more than 75 per cent of their total income in 1994 experienced persistent poverty over the next eight years (these children accounted for 12 per cent of the children in the state)4. There was, also, a strong correlation between a child‘s risk of persistent poverty and the degree of attachment of the household reference person to the labour market. Where the household reference person was unemployed or inactive at the start of the period, a child‘s risk of persistent poverty was four to five times that of children of
3
Layte, R., B. Maitre, B. Nolan and C.T. Whelan (2006), Day In, Day Out: Understanding the Dynamics of Child Poverty, Institute of Public Administration and Combat Poverty Agency.
4
51
[image:7.595.100.503.185.411.2]employed household reference persons.5 Where the household reference person was unemployed and had been so for at least 6 months when first interviewed their children were almost six times more likely to experience persistent poverty than children where the household reference person was in steady employment (‗employed and no unemployment in last 5 years‘) (op. cit, Table 3.4). More recent evidence suggests that further reductions in the proportion of children living in jobless households have become even more difficult to achieve.
Table 4: Number of Years1 below the 60 per cent of Median Income Line, Children, Working-Age Adults and Older People, 1994-2001
Children Working-age Adults with
Children
Working-age Adults without
Children
Adults aged 65+
All
% % % % %
Never below the line 49.7 53.3 60.4 41.7 52.5
Below the line once but for less than 2 years at a time
19.3 18.2 21.4 19.2 19.4
Below the line more than once but never longer than 2 years at a time
9.7 10.7 5.4 6.9 8.6
Below the line for a consecutive period of at least 3 years
21.4 17.8 12.7 32.1 19.5
Total 100 100 100 100 100
Source: Layte, Maitre, Nolan and Whelan (2006: Table 3.2)
Note 1:The four classifications of years below the line are termed ‗persistent non-poor‘, ‗transient poor‘, ‗recurrent poor‘ and ‗persistent poor‘ respectively.
Table 5: Share of Children (0-17 years) Living in Households Where No One Works, EU-15, Selected Years
1994 1997 2000 2003 2006
Change‟94-„06 Unemployment rate, 2006
% % % % % %
Belgium 11.7 11.8 10.8 13.9 13.5 1.8 8.3
Denmark : : : 5.7 5.7 3.9
Germany 8.2 10.2 9.0 10.3 10.5 2.3 8.4
Greece 5.7 5.2 5.3 4.6 3.6 -2.1 9.8
Spain 12.5 10.6 6.5 6.0 5.1 -7.4 8.6
France 9.6 10.1 9.4 9.5 9.5 -0.1 9.0
Ireland 18.8 15.7 10.2 11.8 11.3 -7.5 4.4
Italy 7.8 8.5 7.6 7.0 5.4 -2.4 7.7
Netherlands 9.9 7.5 8.0 7.0 6.2 -3.7 3.9
Austria : 4.3 4.3 4.3 7.2 2.9 4.8
Portugal 4.5 5.2 3.9 5.0 4.7 0.2 7.4
Finland : : : 5.7 6.6 7.7
United Kingdom 20.6 18.9 17.0 17.0 16.2 -4.4 5.3
EU 15 : 11.2 9.8 9.9 9.4 -1.8 7.3
Source: Eurostat on-line (March, 2007)
5
52
For example, the proportion of children in Ireland living in jobless households fell by more than in any other EU 15 country over the period 1994-2000 (Table 5). There was no further improvement but a slight increase after the year 2000. Eleven per cent of Irish children were living in jobless households in 2006, the third highest proportion in the EU, even though Ireland was recording the area‘s third lowest unemployment rate.
Some of the parents of this 11 per cent of children probably have bright futures in the workforce, but need phased and systematic supports to move progressively from their current reliance on social welfare to decent employment. However, it is also the case that some currently non-employed parents are simply not in a position to take employment in, at least, the medium-term because of their poor health, exceptional level of caring commitments, or other difficulties. In their case, an income sufficient to raise their children with dignity remains the responsibility of the state. For both sets of non-employed parents — those who can become self-reliant in the medium-term and those who cannot — a higher adult payment has an important role to play in bringing their children above the income poverty lines.
5. CHILD INCOME SUPPORTS
5.1 Public expenditure on child income supports: an overview
[image:8.595.101.503.457.683.2]Five instruments transfer cash directly to households on behalf of children being supported in or from those households. Ranked in order of the public expenditure incurred, they are Child Benefit, the Early Childcare Supplement, Child Dependant Additions, Family Income Supplement, and the Back to School Clothing and Footwear Allowance (Table 6).6 In 2006, some €2.8bn was spent on these child-contingent cash transfers, the equivalent of approximately 6 per cent of tax receipts.
Table 6: Child Income Transfers - Public Expenditure And Child Beneficiaries, 2006
Instrument Which families? Annual Cost 2006 Estimated No. Children Benefiting Estimated Weekly Value per Child
Child Benefit All habitually resident families and those of EU workers
€ 2,040m 1,087,000 €34.61 (lower)
€42.69 (higher)
Early Childcare Supplement1
All above with a child aged under 6
€ 353m 350,000 €19.23
Child Dependant Additions
Families on social welfare
€ 295m 349,930 €16.80
Family Income Supplement
Families of low earners
€ 94.5m 43,788 €41.50
Back to School Clothing and Footwear Allowance
Families on social welfare
€ 25m 160,000 €2.31 (2-11 yrs)
€3.65 (12-22 yrs)
Note 1: Introduced mid-2006. Cost in a full year.
6
53
Table 7 illustrates how the scale and composition of state spending on child income support has evolved dramatically in recent years. For example, over the period 1994-2004, spending on child-contingent cash transfers more than doubled in real terms (though the child population of the State marginally declined). The proportion of total spending by the Department of Social and Family Affairs accounted for by child-contingent transfers rose from 16 to 20 per cent. Spending on CDAs, which had been greater than spending on CB in 1994, was equivalent to only 17 per cent of CB expenditure by 2004.
[image:9.595.101.513.350.630.2]While the purpose of this paper is to understand the strengths and weaknesses of each of these instruments in reducing child income poverty, several tax expenditures should also be noted as they, too, serve to boost the incomes of households with children. Four take the form of tax credits that reduce the tax-take from individuals as a direct consequence of their responsibility for rearing children — the One-Parent Family Tax Credit, the Home-Carer‘s Tax Credit, the Widowed Parent‘s Tax Credit and the Incapacitated Child Tax Credit — while the fifth is the exemption of Child Benefit from income tax. In 2004 (the latest year for which estimates are available), these child-contingent tax expenditures cost €570m. Between cash transfers and tax expenditures, therefore, a sum equivalent to 1.84 per cent of GDP or 2.15 per cent of GNI was given to parents/guardians in 2004 for their children.
Table 7: Public Expenditure On Child-Contingent Cash Transfers And Tax Expenditures, 1994 And 2004
1994 2004
INSTRUMENT
Child-contingent cash transfers €m €m
Child Benefit 337.15 1,765.12
Child Dependant Additions 1 362.68 300.89
Family Income Supplement 26.45 55.81
Back to School Clothing & Ft. Allowance 13.84 17.03
Total income transfers 740.11 2,138.85
…as % of GDP 1.59% 1.45%
…as % of GNI 1.73% 1.70%
…as % of total DSFA (net of admin.) 16% 20%
Child-contingent tax expenditures
Exemption of CB from income tax 84.45 375.00
One Parent Family Credit 23.88 101.20
Home Carer Tax Credit 2 n.a. 80.00
Widowed Parent Tax Credit 1.14 11.80
Incapacitated Child Tax Credit 2.41 3.70
Total tax expenditures 111.89 571.70
…as % of GDP 0.24% 0.39%
…as % of GNI 0.26% 0.45%
Sources: Statistical Information on Social Services (relevant years); Revenue Statistical Report 1996; TSG 05/14.
Notes:
1. The child dependants of the precursor to Disability Allowance (i.e., the Disabled Person‘s Maintenance Allowance, then administered by the Health Boards) are included in the 1994 figure. Note that expenditure on CDAs is not recorded separately in the DSFA‘s Annual publication, Statistical Information on the Social Services. The figures are NESC calculations, based on a 53-week year (i.e., including the ‗Christmas bonus‘).
54
5.2 Child Dependant Additions and the Back to School Clothing and Footwear Allowance
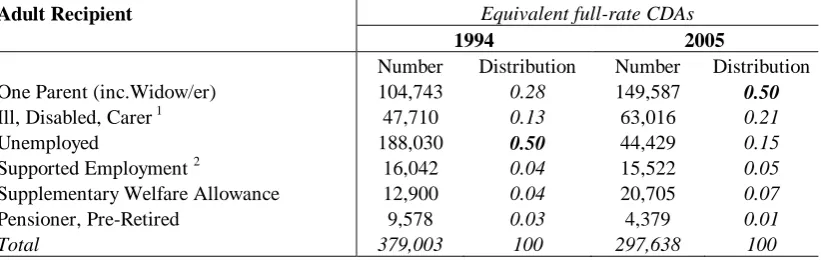
[image:10.595.101.512.292.422.2]Child Dependent Additions7 (CDAs) are supplements to the weekly social welfare payments of adults made on behalf of children living with them. They have long been an integral part of Ireland‘s contingency-based social welfare system and respond to the fact that a person with children to support needs more income than a person without children, other things being equal. In total, some 340,000 children benefited from them in 2005 (their parents received either a full-rate or half-full-rate CDA8), a reduction of 129,000 on twelve years previously (1994). One in three of the Child Benefit population, thus, were also beneficiaries of CDAs in 2005, down from 44 per cent in 1994. The steady decline in CDAs is not because fewer adults are in receipt of social welfare (the number of working-age adults in receipt of a weekly social welfare payment has increased since 1994) but because the population of welfare claimants in general has shared in the wider societal trend towards smaller families and more one-person households.9
Table 8: Number of Equivalent Full-Rate CDAs, and their Distribution by category of Adult Recipient, 1994 and 2005
Adult Recipient Equivalent full-rate CDAs
1994 2005
Number Distribution Number Distribution
One Parent (inc.Widow/er) 104,743 0.28 149,587 0.50
Ill, Disabled, Carer 1 47,710 0.13 63,016 0.21
Unemployed 188,030 0.50 44,429 0.15
Supported Employment 2 16,042 0.04 15,522 0.05
Supplementary Welfare Allowance 12,900 0.04 20,705 0.07
Pensioner, Pre-Retired 9,578 0.03 4,379 0.01
Total 379,003 100 297,638 100
Source: Statistical Information on Social Welfare Services
Notes:
1. 1994 figure includes Child Dependants of DPMA.
2. Child Dependants of Smallholders are the only Supported Employment category for 1994. Back-to-Work Allowance, Back-to-Enterprise Allowance and Back-to-Education Allowance are additional categories for 2005.
There has been a notable shift in the composition of welfare recipients with child dependants (Table 8). A massive drop has occurred in the significance of unemployment as the reason parents have recourse to CDAs.10 By 2005, only 20 per cent of CDAs were paid to parents with a status inside the workforce (either as unemployed members of it or in employment and still qualifying for support) as against 54 per cent in 1994. By 2005, CDAs paid with the One-Parent Family Payment accounted for one half of all CDAs, while those paid with Unemployment Benefit or Assistance accounted for only 15 per cent (down from one half in 1994). In addition to
7
The technically correct term is ‗Qualified Child Increases‘. In deference to past practice, we continue with ‗Child Dependent Additions‘. Sometimes, ‗Allowance‘ is used instead of ‗Addition‘ (as in the text of
Sustaining Progress). However, ‗Addition‘ communicates more accurately that they are supplements to
payments to adults.
8 They are paid at a half rate where the adult claimant has a spouse or partner earning above a certain threshold (€250 a week in 2006) after which they begin to be withdrawn. If both spouses/partners are claiming social welfare in their own right, each may also receive a half-rate CDA.
9
The introduction of a lower earnings disregard for spouses and partners of UB and DB claimants in 2003 affected a significant once-off reduction in the number of half-rate CDAs associated with those payments.
10
55
the large increase in children of lone parents on welfare since 1994, significant increases also took place in the CDAs paid to parents in two other types of situation; 15,000 more CDAs were associated with parental receipt of a welfare payment for illness, disability or caring (a 32 per cent increase) and 8,000 more child dependants associated with Supplementary Welfare Allowance receipt (a 60 per cent increase).
This shift in composition of the CDA population invites a re-examination of the extent to which the potential labour market disincentive effect of CDAs should be as strong a consideration for policy makers now as in the mid-1990s. Several characteristics of the adults currently receiving CDAs suggest a significant proportion of them are unlikely to enter the labour market — because of the severity of their illness or disability, the number of children for whom they have responsibility, additional caring responsibilities they have in the home, or their age. For example, if receiving CDAs for three or more qualifying children is considered an indicator that a person is unable to participate in the labour market, then at least 32 per cent of the child dependants of recipients of the One-Parent Family Payment and 46 per cent of the child dependants of the recipients of Illness, Disability and Caring Payments had parents in this position in 2004. A conservative estimate would suggest that at least 30 per cent of all children on whose behalf CDAs were paid in 2004 had parents who could not be expected to take employment.11
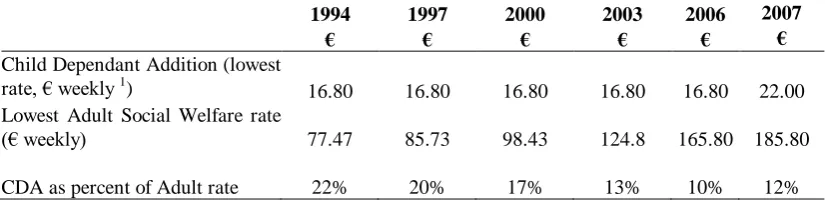
In 1994, the lowest value CDA was equivalent to 22 per cent of the lowest adult welfare payment. This fell to 10 per cent by 2006 as a consequence of the decision to freeze their value in 1994 (Table 9). The decision was taken out of a concern that CDAs created a disincentive for social welfare dependants with large families and weak earning power to take employment, and in the context of a major increase in Child Benefit (35%) plus commitment to move towards a ‗Child Benefit Supplement…that would be paid to social welfare recipients and low to middle income families‘ (Budget Speech, February 199512
). In the event, increases in Child Benefit alone compensated recipients of CDAs for the erosion in their value. Budget 2007 broke the policy freeze on CDAs and raised their value by over 30 per cent to €22, making them equivalent to 12 per cent of the lowest adult welfare payment.13
The 1986 Commission on Social Welfare believed that CDAs and Child Benefit (then Children‘s Allowance) combined ‗should provide the full cost of rearing children for families dependent on social welfare payments‘. In this combined package, a diminishing role for CDAs and a growing role for CB were widely endorsed as the direction to take (e.g., CSW, 1986; NESC, 1990; TWIG, 1996). No clear policy was enunciated, however, as to how far the process should be taken and the initial intention eventually to introduce a second-tier payment to Child Benefit in lieu of CDAs (and FIS) was not acted on.
11
To children whose parents are claiming for three or more children, can be added children whose parents/guardians are receiving a pension, pre-retirement allowance, carer‘s allowance or blind pension. In addition, it is assumed that one-half of the CDAs paid with SWA will see the parents in question transfer to a status outside the labour force.
12
Minister for Finance, Mr. Ruairí Quinn, T.D.
13
56
Table 9: The Child Dependant Addition as a Percentage of the Lowest Adult Welfare Payment
1994 1997 2000 2003 2006 2007
€ € € € € €
Child Dependant Addition (lowest rate, € weekly 1
) 16.80 16.80 16.80 16.80 16.80 22.00
Lowest Adult Social Welfare rate
(€ weekly) 77.47 85.73 98.43 124.8 165.80 185.80
CDA as percent of Adult rate 22% 20% 17% 13% 10% 12%
Note 1: Until 2006, there were two higher rates, also frozen in 1994: recipients of the One-Parent Family Payment, Old-Age Contributory Pension and Invalidity Pension received CDAs of €19.30 (42 per cent of all CDA children in 2005); recipients of the Widow/er‘s Contributory Pension and Deserted Wife‘s Benefit received CDAs of €21.60 (6 per cent of all CDA children in 2005). The 2007 Budget completed the rationalisation of CDA rates that had been strongly advocated by the 1986 Commission on Social Welfare.
The Back-to-School Clothing and Footwear Allowance (BSCFA) is a further cash-transfer for children paid once a year on behalf of a large subset of the CDA population. It is intended to support families on low incomes with the cost of their children‘s clothing and footwear at the start of the school year. Its title and timing indicate the purpose for which the payment is intended but, in effect, it functions as an end-of-summer, lump sum supplement for a large subset of families receiving CDAs. This subset must have incomes below specified thresholds and children aged 2-17 (‗school going‘, though 18-22 year olds in full-time education also qualify). In expenditure terms, the BSCFA is a minnow; its €25m accounted for around 1 per cent of total spending on child income support in 2006 (Table 6). However, its weekly value (at the higher rate for children aged 12-17) climbed from 7 per cent to 25 per cent of the lowest CDA between 1994 and 200714 as the two rates of payment of the BSCFA increased by 170 per cent (2-11 year olds) and 200 per cent (12-17 year olds) over the period that CDA rates were frozen. The BSCFA is now, therefore, a significant supplement to CDAs for a large subgroup among the CDA population (approximately 46 per cent in 2005, down from 57 per cent in 1994).
The following observations can be made about CDAs. Several of them will serve, later on, to point to features that are desirable in any new instrument that would subsume them.
It can be assumed that practically all the poorest children in the state have CDAs paid on their behalf. A large part of the expenditure on CDAs, therefore, is effectively targeted. Not all families who receive CDAs have low incomes. CDAs paid along with
insurance-based benefits (35 per cent of all CDAs in 2003, [DSFA, 2004: 58]) are not means-tested.15 This means there is some deadweight effect in using even CDAs as an anti-poverty instrument.
The BSCFA is received only by families on low incomes and functions, in effect, as a lump sum, annual boost to the CDA families with the lowest incomes.
Children on whose behalf CDAs are paid must have their ‗usual abode‘ in the state. This means there is little or no ‗leakage‘ produced by migration in so far as the contribution of CDAs to reducing poverty within the state is concerned.
Expenditure data on CDAs are not provided separately in the DSFA‘s annual report, Statistical Information on Social Welfare Services (though data on the numbers of children are). The CSO, for EU-SILC purposes, classifies them under the adult payment
14
As of June 2007 when the increase announced in Budget 2007 took effect. 15
57
they are paid with and not as child-related income. This contributes to the instrument‘s relatively low profile as a child income support.
CDAs are only paid when an adult responsible for a child qualifies for a social welfare contingency. If the qualifying adult leaves social welfare for employment, the CDAs are withdrawn (more often in a tapered manner where the adult avails of the BTWA). There is no automatic transition to FIS or to any other form of in-work child income support.
A significant number of children benefiting from CDAs have parents who cannot reasonably be expected to take employment in, at least, the medium term. In their case at least, the concern that more generous CDAs would create a disincentive effect does not apply.
Despite the gradual decline in the significance of CDAs as a source of overall household incomes, there is some evidence that they may still create a disincentive to taking employment: UA claims with CDAs have a duration twice as long as claims without them.16
5.3 Family Income Supplement (FIS)
[image:13.595.98.506.446.546.2]FIS is a weekly payment supplementing the take-home pay of employees with children where disposable family income falls below a specified threshold. Employees must be working at least 19 hours a week, though this can be in conjunction with hours worked by their spouse or partner.17 Its primary purpose is to provide an incentive to low-earning parents to take up or remain in employment in circumstances where they might only be marginally better off than if they were claiming unemployment benefit. While essentially an employment support, the fact that the amount of FIS paid rises with the number of an employee‘s children means it is also considered a child income support.
Table 10: Family Income Supplement: Expenditure, Recipients and Child Beneficiaries, 1994 and 2005
1994 2005
Expenditure (€m annual) 26.448 72.146
Children 32,078 33,956
Actual expenditure per child (€ weekly) 15.86 40.86
Recipient Families 10,671 17,448
... % One-Parent 15% 64%
... % with 3+ children 58% 25%
Some 34,000 children were beneficiaries of FIS in 2005, a number that corresponded to eight per cent of the CDA population that year. This was seven per cent less than 11 years earlier (Table 10). Annual expenditure on FIS almost tripled over the same period to reach €72m, and weekly expenditure per qualifying child rose from €15.86 to €40.86. Lone parents accounted for almost
16
The disincentive effects of CDAs were not accepted by the Commission on Social Welfare (1986: 298). It found that the level and duration of unemployment at that time owed little to the structure of social welfare payments. Analysis of UA claim closures in 2004, however, reveals that claims with CDAs had an average duration of 509 days as against 245 days for claims without. The latter outnumbered the former by a ratio of almost 9:1. The monthly numbers being closed were in the region of 5,500 - 6,000 (no CDAs) and 600 - 700 (with CDAs).
17
58
two thirds of recipients by 2005—up from 15 per cent in 1994—while the proportion of recipients claiming for three or more children fell from 58 per cent to 25 per cent.18
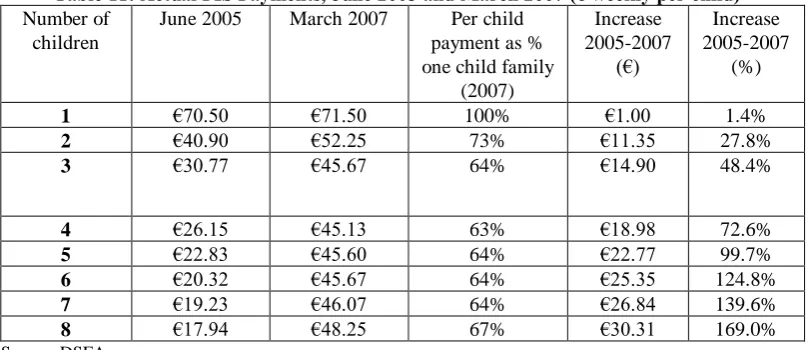
[image:14.595.99.504.277.452.2]The amount of the FIS payment a family is entitled to is 60 per cent of the gap between the actual family income and a threshold that — until 2005 — was set at a level approximately two thirds higher than what the family would receive on unemployment assistance. 19 This link to a payment package dominated by adult entitlements means that FIS support was, and still is, particularly generous for the one-child family (Table 11). It is also particularly attractive to the one-parent family which still benefits from the mark-up having been based on a couple‘s welfare entitlements. Significant recalibrations of the income thresholds took place in 2006 and 2007 that have reduced this bias considerably. For example, before the recalibrations, a three-child family typically received, per child, 44 per cent of the payment made to the one child family; after them, it typically received 64 per cent (Table 11).
Table 11: Actual FIS Payments, June 2005 and March 2007 (€ weekly per child) Number of
children
June 2005 March 2007 Per child payment as % one child family
(2007)
Increase 2005-2007
(€)
Increase 2005-2007
(%)
1 €70.50 €71.50 100% €1.00 1.4%
2 €40.90 €52.25 73% €11.35 27.8%
3 €30.77 €45.67 64% €14.90 48.4%
4 €26.15 €45.13 63% €18.98 72.6%
5 €22.83 €45.60 64% €22.77 99.7%
6 €20.32 €45.67 64% €25.35 124.8%
7 €19.23 €46.07 64% €26.84 139.6%
8 €17.94 €48.25 67% €30.31 169.0%
Source: DSFA
‗Family income‘, for the purposes of FIS, is the joint income of the spouses/partners, net of tax and PRSI. This is established on the basis of earnings details supplied by applicants‘ employers for a period just prior to the application. Payment of the supplement then normally continues for a full year without formal review. The birth of a further child increases the payment but, otherwise, assuming the qualifying conditions remain, the amount paid does not change with changes in the level of earnings during the course of a year. Employees must take the initiative to apply for FIS, and reapply after each 52 week period. Applying needs the cooperation of one or two employers (where a spouse/partner is also earning) in furnishing earnings details. The withdrawal rate as family income rises is inherent in FIS‘s intention to close 60 per cent of the gap between actual income and the income level considered appropriate to their circumstances; it is, therefore, also 60 per cent. This is a peculiar structural feature to FIS; the more of the income gap it seeks to close, the higher its withdrawal rate.
For most of its lifetime, FIS has been considered to have a low take-up. Since 2003, however, there has been a strong rise in the number of children benefiting from it (Chart 1). The reasons underlying this are not yet clear. Previous improvements in the programme‘s generosity, for
18
This is partly the consequence of the falling minimum hours requirement (see footnote 31) ‗meeting‘ the generous earnings disregard associated with the introduction of the One Parent Family Payment.
19
59
example, (including its shift to a net income basis in 1998) did not lead to such a sustained rise in the numbers of children benefiting; employment growth was as rapid in years prior to 2003 as subsequently; the increased generosity of FIS to large families in 2006 and 2007 have come after, rather than preceded, the onset of the rise. The large in-migration after the 2004 EU enlargement has played a part; for example, 46 per cent of the new recipients between July 2005 and March 2007 have been foreign nationals (which this begs the question why an application process which Irish workers have found complex and potentially off-putting appears to offer fewer difficulties to migrant workers).
Chart 1: Child Beneficiaries of FIS, 1994 to 2006
FIS enjoys a high profile as the state‘s main in-work income support for families with children. At the same time, the numbers of children benefiting from it remain small (compared, for example, to the numbers of CDAs) and its undoubted effectiveness in ensuring that employment is a route out of poverty for its recipients (witness its generous levels of payment, Table 11) sits uneasily with continuing evidence that a significant number of children are still in the households of a ‗working poor‘.
Observations can also be made about FIS that serve to draw attention to some of the features that should be looked for in any new instrument that would subsume it.
FIS may still have a low take-up, though a significant rise in the number of recipients and child beneficiaries has been occurring since 2003.
Payment of FIS is not automatic. The initiative lies entirely with the employee who must enlist their employer—and their spouse or partner‘s employer when s/he is also employed—to complete an extensive application form.20
20
60
Where a new work relationship is tentative on both sides, and employees in particular may be anxious to please a new employer, the application process may be off-putting. In effect, an employer and employee have to agree that the latter‘s pay is insufficient for their family‘s needs. An ambitious employee may be unwilling to accept they will be on low earnings (or in the same job) for sufficient time to make application for FIS worthwhile; others may lack the self-confidence and degree of personal organisation successful application requires. The issue has certainly been little researched.
While FIS is intuitive on one level (the earnings of low-paid workers need to be supplemented if they are to be able to support large families), the amount people stand to receive is difficult to communicate. The basis to the calculation of the thresholds has become even less transparent since 2005.
FIS feeds complexities. For example, its availability to employees working at least 19 hours a week sharpened the search for complementary in-work supports to people not qualifying. Hence, unemployment benefit/assistance can be paid partially to people who work 3 days or less (with no number of hours specified); formerly unemployed people working less than 24 hours a week may be entitled to part-time Job Incentive; self-employed people with low household means may be entitled to unemployment assistance (and its CDAs) regardless of their hours worked.
FIS has a high withdrawal rate (60 per cent). This improves its targeting and reduces the number of people higher up the earnings ladder who receive a partial payment. However, in reapplying for a further year, people may experience a significant drop in their recalculated FIS payment.
FIS is particularly generous towards Lone Parents as its thresholds were originally calculated as a multiple of what a couple, not a single person, would receive on unemployment assistance.
FIS attempts only a limited responsiveness in its level of payment to changes in a family‘s circumstances. This both increases income security for recipients and reduces administration costs. Once granted, FIS is paid for 52 weeks and remains the same even if weekly earnings increase (or decrease). If another child is born, the FIS payment is increased as soon as the DSFA is notified.
Loss of employment or a severe curtailment in regular hours worked (to below 19 hours a week), means a person no longer meets the qualifying conditions and ceases to receive FIS. They then become entitled to Unemployment Benefit or Assistance and their associated CDAs.
FIS is based on ‗family income‘, which is defined for the programme‘s purposes and ascertained on the basis of the application form as validated by an employer.
FIS can be paid in respect of children not resident in the state. It is only necessary that children are supported by employees who meet the other qualifying conditions, not that they reside with them. The large numbers of migrants entering lower paid jobs, since 2004 in particular, make it likely that a growing number of the children being supported by FIS are outside the state.
5.4 Child Benefit (CB) and the Early Childcare Supplement (ECS)
Child Benefit is a monthly cash transfer to households with children from which practically every child in the state benefits.21 Third and further children receive a higher payment (22 per cent higher in 2007) than first and second children, and multiple births also attract higher support.
cohabiting and, if ever married, the date of the marriage; they are required to give full details of all their own income sources and of all income sources of their spouse or partner.
21
61
Any person legitimately present in the state and with responsibility for a child can apply for Child Benefit. The payment is exempt from income tax and is usually applied for by, and paid directly to, the mother. It is the main instrument through which the state socialises the costs of rearing children. As such, it is, primarily, an exercise in horizontal redistribution — from households without children to households in which children are being reared.
Comparing 2005 with 1994, the number of families receiving Child Benefit rose 12 per cent, though the total number of children benefiting was only marginally higher (Table 12). Until 2001, a fall in average family size more than offset the growing number of families so that the number of child beneficiaries fell; since 2001, the number of families has continued to grow at about 1 per cent a year but family size appears to have stabilised or marginally increased and the child population has been rising. The proportion of families with only one eligible child rose from 34 per cent to 41 per cent over the period, 1994-2005, while those with 3 or more eligible children declined from 33 to 25 per cent. One third of all benefiting children were aged under 6 in 2005.
The rate of payment of Child Benefit was significantly increased in 1995 but truly substantial increases did not occur until 2001 and 2002 (Table 13 and Chart 2). Expenditure on Child Benefit over the five year period, 2001-2005, almost doubled and accounted for 22 per cent of the increase in total spending by DSFA. This does not include the cost of its exemption from income tax, estimated at €343m for the tax year 2004 (up from €127.4m in 1999/00).22
[image:17.595.98.513.396.558.2]This was approximately the same as total expenditure on CDAs that year.
Table 12: Number of Families receiving Child Benefit, by Number of Eligible Children, 1994 and 2005
1994 2005
% %
Total number of recipient families 482,592 100 547,540 100
Per cent with 1 eligible child 0.34 0.41
2 eligible children 0.33 0.34
3 or more eligible children 0.33 0.25 Total number of eligible children 1,055,156 100 1,060,740 100
Eligible children under 6 301,202 0.29 347,019 0.33
Eligible children 6-12 432,226 0.41 385,631 0.37
Source: Statistical Information on Social Welfare Services
A further policy development occurred in 2006 that can be viewed as part of the unfolding story of Child Benefit. Budget 2006 introduced a new payment of €1,000 annually to be made on behalf of every child under 6. Though termed an ‗Early Childcare Supplement‘, the payment is not conditional on parents incurring formal childcare costs. It is, in effect, distinguishable from Child Benefit only in its restriction to children aged under 6 and being paid quarterly rather than monthly.
22
62
Table 13: Child Benefit Rates, Current € Monthly, 1994-2007
Lower Higher
1994 25.40 31.75
1995 34.29 40.64
1996 36.83 43.18
1997 38.10 49.53
1998 40.01 53.34
1999 43.82 58.42
2000 53.98 71.12
2001 85.73 109.22
2002 117.60 147.30
2003 125.60 157.30
2004 131.60 165.30
2005 141.60 177.30
2006 150.00 185.00
2007 160.00 195.00
Chart 2: Child Benefit Rates, Current € monthly, 1994-2007
There are significant features of Child Benefit from which a new instrument seeking to assist children in low-income families exclusively might usefully learn.
CB is easy for people to understand. It is easily grasped that support is available and how much that support is. The qualifying condition (rearing a child) has no stigma attached to it.
CB is the same for people in employment and people on social welfare, for people parenting alone and for couples. It provides uniform support independently of the circumstances of a child‘s parents and of the choices they make.
Its direct payment, in most instances, to the mother is regarded as a significant contribution to ensuring that children benefit from the internal sharing of household income.
63
Arrangements are under way whereby the registration of a first child's birth will result in the DSFA automatically sending an application form without waiting for a parent to request it. No new application will be needed for second or subsequent children but the registration of the child‘s birth will trigger payment of CB on its behalf.
As a poverty-alleviation measure, CB is inefficient. It is paid wherever children are present and irrespective of children's actual needs. It has helped reduce the poverty gap experienced by poor children but is insufficient on its own to impact significantly on the child poverty rate.
The alignment of CB with all children in the state has been blurred by two recent developments. The large numbers of EU nationals working in the Irish economy mean it is now paid on behalf of a non-negligible number of children not resident in Ireland.23 The introduction of the Habitual Residency Condition for application has made its payment on behalf of the children of ‗third country‘ nationals living in Ireland no longer automatic.
Because CB is paid on behalf of almost every child in the state, or being supported by an EU national at work in the state and regardless of parental income, it is an expensive programme. For example, the payment of a 10 per cent increase on its 2006 rates would, in three years, pay for a doubling the five-year National Childcare Investment Programme.
5.5 Child Income Supports and the Income Distribution
It is interesting to examine where in the income distribution the principal child income supports are received. The distribution of Child Benefit and the Early Childcare Supplement simply reflect the presence of children in households and it is difficult, in principle, to say whether one should expect their distribution across families to follow a progressive or regressive pattern. Large families have become less prevalent in Ireland today and, even though still more associated with poverty than small families, can be expected to be pulling a lower proportion of total CB/ECS spending into the lower income deciles.24 By contrast, spending on the other child income supports — CDAs, BSCFA and FIS — can be assumed to adopt a largely progressive pattern and to be received in almost their entirety in the bottom half of the income distribution. These expectations are largely confirmed by Table 14 and Chart 3, which show the distribution across family income deciles of spending on the four principal child income supports as estimated by the ESRI SWITCH model for 2006.25 We see that practically all spending on CDAs and FIS (98 per cent) went to the bottom half of the income distribution, as against just over one half (56 per cent) of spending on Child Benefit and the Early Childcare Supplement. Of the latter two non-means tested payments, CB is more progressive than the ECS—27 per cent of spending on it went to the poorest 30 per cent of families as against 20 per cent of ECS spending. In fact, over one half of spending on the ECS (52 per cent) goes to the top half of the income distribution (as against 41 per cent of CB spending).
23
The value of Ireland‘s CB is significant from the perspective of several of the new Member States also. For example, its value for two children in 2006 (€150 * 2), was greater than the monthly earnings on the minimum wage—adjusted for purchasing power—in Latvia (€240) and Lithuania (€292). (Eurostat, 2006). 24
It would be particularly interesting to know if the distribution across income deciles of spending on the higher rate CB differs significantly from the distribution of spending on the lower rate.
25
64
Table 14: Distribution of Child Income Supports, 2006
Chart 3: Distribution of Spending on Child Income Supports, 2006
5.6 The Adequacy of Child Income Supports
The adequacy of child income supports refers, almost always, to their anti-poverty objective. The adequacy of Child Benefit, however, has an additional and – arguably – more important meaning; it refers to the extent to which society believes the costs of children in general should be socialized. As such, there is no accepted yardstick against which to measure it. In the words of the 1986 Report of the Commission on Social Welfare, CB is how the state makes ‗a contribution‘ to the cost of rearing each child. Subsequently, three interrelated but different
Decile ECS CB CDA FIS Total Per Cent
of ECS+CB
Per Cent of CDA+FIS
Per Cent of Total
€m €m €m €m €m % % %
Bottom 22.0 313.9 89.1 6.9 431.8 14% 28% 16%
2 30.5 59.8 39.6 4.0 133.9 4% 13% 5%
3 19.8 165.7 29.2 8.0 222.8 8% 11% 8%
4 59.2 373.3 93.4 25.6 551.6 18% 35% 21%
5 42.9 245.6 20.4 17.4 326.3 12% 11% 12%
6 53.3 245.9 6.6 0.5 306.4 13% 2% 11%
7 33.2 177.8 1.5 0.0 212.5 9% 0% 8%
8 33.2 131.1 0.6 0.0 164.9 7% 0% 6%
9 27.0 123.5 1.2 0.0 151.7 6% 0% 6%
Top 39.5 141.7 0.0 0.0 181.1 8% 0% 7%
65
objectives have variously been cited in support of increasing its rates: (i) an antipoverty objective or, more specifically the transformation of support for poor families in a way that minimises employment disincentives, (ii) support for working parents with the cost of childcare, and (iii) recognition of the value of women's work caring for children in the home (an objective that assumed larger prominence with the removal of children's tax allowances from the income tax code). While these several objectives have been given in support of the decision to prioritise CB, a clear target level for the rate of CB has not been adopted. As noted already, it is not clear what proportion of the costs of rearing a child it is intended that the state should socialise.
As also noted above, since 1986 at least, there has been an acceptance that child income support from the state — from all sources — should be sufficient to meet the full costs of rearing a child in families reliant on social welfare. This is a more difficult proposition than may appear at first sight. In the first place, one cannot lift children out of poverty without lifting their families and households out of poverty. In second place, sums greater than what is potentially needed to cover the ‗cost‘ of a child will be needed in an indeterminate number of cases, as when households have crippling debts or extra-ordinary needs arising from illness or other household conditions. Nevertheless, several benchmarks have been adopted by which the adequacy of the combined child income support package received by low income families can be judged.
The most widely used is that the combined support should be equivalent to a set proportion of what the state considers a minimally adequate income for an adult. This was the approach taken in 1986 (see page 4 above). In a direct continuation of this approach, the Revised National Anti-Poverty Strategy (2002) undertook to raise the combined value of CB and CDAs to 33–35 per cent of the minimum social welfare rate.
A related but similar approach is to apply the same weighting (that accorded a child in an equivalence scale), not to the lowest adult social welfare payment, but to the income poverty line below which people in general are considered to be ‗at risk of poverty‘. For example, 0.33 of the 60 per cent of median equivalised income is then interpreted as the marginal addition a child makes to the income needs of a household and a valid benchmark for assessing the adequacy of child income supports.26 A third approach, little used in Ireland, is to establish the direct costs associated with rearing a child at a point in time and see how much of them child income supports cover. This last approach needs not just a tailored price index to capture changes in the price of a ‗child‘s basket of goods and services‘ over time but regular reviews of the products and services considered essential for rearing children.
26
66
Table 15: The Adequacy Of Combined Child Income Support (Cb And Cda), 1994-2005
1994 1997 2000 2003 (r) 2005
€ € € € €
1. Child Dependant Addition (lower rate) 16.80 16.80 16.80 16.80 16.80 2. Child Benefit (lower rate, weekly value) 5.86 8.79 12.46 28.98 32.68
3. Lowest Combined Support (rows 1 & 2) 22.66 25.59 29.26 45.78 49.48
4. Child Dependant Addition (Lone Parent rate)
19.30 19.30 19.30 19.30 19.30
5. Child Benefit (higher rate, weekly value)
7.33 11.43 16.41 36.28 40.92
6. Highest Combined Support (rows 4 & 5) 26.63 30.73 35.71 55.58 60.22
7. Lowest Adult Social Welfare Payment 77.47 85.73 98.43 124.8 148.80
Combined Support (as %: lowest/highest) 29 / 34 30/ 36 30 / 36 37 / 45 33/ 40
8. Child's imputed marginal addition to income needs of household 1
25.36 33.80 47.38 58.00 63.60
Combined Support (as %: lowest/highest) 89 / 105 76 / 91 62 / 75 79 / 96 78 / 95
9. Cost of a child (Basic Minimum Standard, Carney et al, 1994) 2
38.10 40.28 44.25 50.26 52.65
Combined Support (as %: lowest/highest) 59 / 70 64 / 76 66 / 81 91 / 111 94 / 114
Consumer price index (1994=100) 100.0 106.6 112.6 130.5 133.8
Notes:
1. 0.33 of 60 per cent of median equivalised household disposable income.
2. Carney et al estimated both a Basic Minimum Standard and a Modest-but-Adequate Standard in 1992 terms for children in three age groups respectively (0-6, 7-12, and 13-18). The Basic Minimum Standard for the three age groups is averaged here.
3. The revised NAPS (2002) proposed that CB and CDA should sum to 33-35 per cent of the lowest adult social welfare payment.
67
with the rise in median income. The least onerous benchmark is that provided by up-rating what was considered a ‗basic minimum standard‘ for children in 1994 in line with inflation (Row 9). The combined income support package for children was between 94 and 114 per cent of this standard in 2005, up from between 59 and 70 per cent in 1994. The most used benchmark, however, is that set by the evolution in the lowest adult social welfare payment (Row 7). This shows the income support package for children at between 29 and 34 per cent in 1994 but 33 to 40 per cent in 2005.
[image:23.595.102.513.355.519.2]Table 15 also illustrates the major shift in composition of the combined child income support package. The weight of CB in the package grew from one-quarter to two-thirds; conversely, the weight of CDA fell from some three-quarters in 1994 to one-third by 2005. This makes it interesting to examine what the combined income support package for children would have looked like in 2005 had the freeze on CDAs had not been implemented and their value increased in line with the lowest adult welfare rate.27 CDAs would, then, be 92 per cent higher in 2005 than in 1994 and the lowest rate amount to €32.27 weekly (Table 16). The combined income support package would be evenly composed of CDAs and CB. In the least favourable circumstances (lowest CDA and CB rates), it would have fully covered the income needs of a child as implicit in the equivalence scale.
Table 16: The Evolution of Basic Child Income Support if CDAs had Increased in line with the Lowest Adult Welfare Payment
1994 1997 2000 2003 2005
€ € € € €
1 Child's imputed marginal addition to income needs of household
25.36 33.80 47.38 58.00 63.60
2 Child Dependant Allowance (lowest rate)
16.80 18.60 21.34 27.06 32.27
3 Child Benefit (lower rate, weekly value)
5.86 8.79 12.46 28.98 32.68
4 Total Child-Contingent Income Support (2+3)
22.66 27.39 33.80 56.04 64.95
2 as per cent of 4 74% 68% 63% 48% 50%
4 as per cent of 1 89% 81% 71% 92% 102%
Table 17: Child Income Supports as percentage of Lowest Social Welfare Rate, Post Budget 2007
Child‟s Age Source of support (€ weekly) Until 2
years
2 to 6 years 7 to 11 years
12 years plus
€ € € €
Child Benefit 36.92 36.92 36.92 36.92
Early Childcare Supplement 19.33 19.23 0 0
CDA 22.00 22.00 22.00 22.00
BSCFA 0 3.46 3.46 5.48
Total 78.15 81.61 62.38 64.40
Lowest Personal SW rate 185.80 185.80 185.80 185.80 Total Child Income Support (%) 42.06% 43.92% 33.57% 34.66%
Source: Department of the Taoiseach (2007: 83).
27