Estimation of water infiltration in heavy soils and their subsequent water saturation is very im-portant for assessment of slope stability of newly designed or existing reclaimed landfills. Usually applied methods and numerical models often significantly underestimate the total amount of infiltrated water since they assume equilibrium water flow, and use the Richards equation and soil hydraulic properties determined for the entire flow domain. It has been indicated in many studies (for instance in Valla et al. 2000) that in reality the infiltration rate in such soils is much higher due to the presence of macropores and fractures. Models that allow consideration of non-equilibrium water flow must be used to obtain more precise estimates of amounts of infiltrated water and water saturation of the soil profile.
Mathematical description of the equilibrium water flow and solute transport assumes a single continuum approach. To describe the
non-equi-librium water flow and solute transport in soils, numerical models that assume two continuum approach have been developed. Soil porous sys-tem is in such models divided into two domains. Each domain is characterized with its own set of transport properties and equations describ-ing transport processes. Dual-porosity approach defining a water and solute transport in systems consisting of domains of mobile and immobile water was presented by Phillip (1968) and Van Genuchten and Wierenga (1976). The dual-porosity formulation for water flow and solute transport is based on a set of partial differen-tial equations describing water flow and solute transport in the mobile domain and mass bal-ance equations describing moisture dynamics and solute content in the immobile domain. On the other side, dual-permeability approach assumes water flow and solute transport in both domains. The dual-permeability formulation for water flow
Supported by the Ministry of Education, Youth and Sports of the Czech Republic, Project No. MSM 6046070901, by the Ministry of Agriculture of the Czech Republic, Project No. QF3250, and by the Czech Science Foundation, Project No. GACR 103/05/2143.
Numerical Study of Macropore Impact on Ponded
Infiltration in Clay Soils
Radka Kodešová
1, Josef KozáK
1and Jiří šimůneK
21
department of Soil Science and Geology, Faculty of Agrobiology, Food and natural
Resources, Czech University of Agriculture in Prague, Prague, Czech Republic;
2
department of environmental Sciences, University of California Riverside, CA, USA
Abstract: The single-porosity and dual-permeability models in HYDRUS-1D (Šimůnek et al. 1998, 2003) were
used to simulate variably-saturated water movement in clay soils with and without macropores. Numerical simulations of water flow for several scenarios of probable macropore compositions show a considerable impact of preferential flow on water infiltration in such soils. Preferential flow must be considered to predict water recharge in clay soils.
Keywords: ponded infiltration; macropores and fractures; preferential flow; single-porosity system;
and solute transport is based on a set of equa-tions describing water flow and solute transport separately in each domain (matrix and macropore domains). Different equations may be used to simulate water flow in the mobile and macropore domains. A kinematic wave approach was used by Germann (1985), Germann and Beven (1985) and Jarvis (1994) to describe flow in macropores. The Richards equation was used by Gerke and Van Genuchten (1993, 1996) to describe flow
in both matrix and macropore domains. Other approaches can be based on Poiseuille equation (Ahuja & Hebson 1992), and Green-Ampt or Philip infiltration equations (Ahuja & Hebson 1992; Chen & Wagenet 1992).
[image:2.595.98.499.224.734.2]Single-porosity and dual-permeability models in HYDRUS-1D (Šimůnek et al. 1998, 2003) based on the numerical solution of the Richards equa-tion in all domains, as was proposed by Gerke and Van Genuchten (1993, 1996), were applied
Macropore origin is usually associated with transformation of pores between and inside ag-gregates. While neglecting dynamic changes in the pore structure and assuming capillary behavior in both matrix and macroporous domains, the dual-permeability model may describe the impact of macropores on water flow in the soil profile.
Concepts of single-porosity and dual-permeability models
Water flow in the soil profile is in this study simulated using the single-porosity and dual-permeability models (Gerke & Van Genuchten 1993, 1996) implemented in HYDRUS-1D. While the single-porosity model describes a uniform flow in soil porous media, the dual-permeability model can represent a non-equilibrium/preferential flow in a complex system of soil aggregates (matrix) and intermediate spaces (fractures or macropores). The Richards equation, describing the one-dimensional isothermal Darcian flow in a variably saturated rigid porous medium is used in both models.
The single Richards equation is used for the sin-gle-porosity system:
(1)
where:
θ – volumetric soil water content (l3/l3)
h – pressure head (l) K – soil water content (l/T) S – sink term (T-1)
t – time (T) z – vertical axes (l)
Equation (1) is solved for the entire flow domain using one set of soil water retention and hydraulic conductivity curves.
In the case of the dual-permeability model, the Richards equation is applied separately to each of the two pore regions – macropore (fracture) and matrix domains:
(2)
where:
θf , θm – volumetric soil water contents in the macropore and matrix pore domains (l3/l3), respectively
S h K z h h K z t Ό ¸¸ ¹ · ¨¨ © § w w w w w w in this study. The same approach was also used for instance by Vogel et al. (2000). Different sce-narios were designed to simulate one-hour pon-ded infiltration into heavy soils with and without macropores. The aim of this study was to show the effects of different volume, configuration and shape of macropores on the infiltration rate and saturation of the soil profile.
MAterIAl ANd MethodS Impact of macropores and fractures
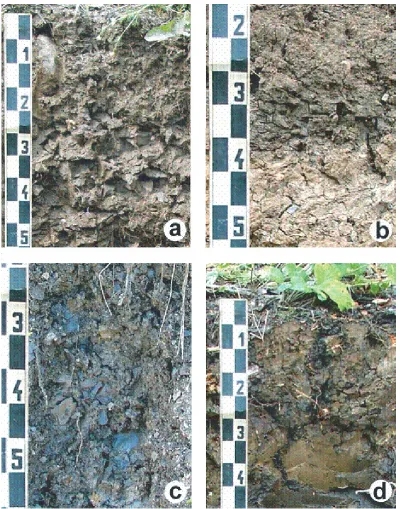
Water flow in soils is traditionally described using the Richards equation that solves the equilibrium water flow in variably saturated rigid soil porous media. Soil hydraulic properties are defined by soil water content retention and unsaturated hydraulic conductivity curves for the whole flow domain. Water regime in the soil profile is described by values of soil water contents and pressure heads, that are defined as average values of water contents or pressure heads in different pore domains (matrix soil porous system and macroporous system). The impact of macropores and fractures, which exist due to soil particle aggregation, volume changes, influence of living organisms, non-consolida-tion of soils and so on, on flow and transport is neglected. The impact of macropores is greater in clay soils, where the hydraulic conductivity is expected to be very low and where macropores may transfer a bulk of water and solute, than in loams and sands. Water in clay soils penetrates deep into the soil profile mostly due to preferential flow in macropores and fractures. Shapes and sizes of aggregates, and consequently of macropores and fractures, are different in different soils. They depend on the mineralogical composition, stage of disintegration, soil water content, way of soil deposition, consolidation and so on. Soil structure in clay soils at four locations in Tušimice and Bílina is documented on Figure 1:
(a) angular blocky structure in consolidated moist soil,
(b) angular blocky structure with appearance of cubic-shape segregates and fractures in dry soil,
(c) clay disintegration under extreme conditions into the plate-like structure and following reclamation,
(d) fractures in non-consolidated soil or in soil disturbed by plant roots.
hf,, hm – pressure heads in both domains (l) Kf, , Km – hydraulic conductivities (l/T) Sf , Sm – sink terms (T–1)
Γw – mass exchange between the matrix and macro-
pore regions (T–1)
fw – ratio between volume of the macropore domain
and the total flow domain (–)
Equations (2) are solved using two sets of soil water retention and hydraulic conductivity curves that are defined for each domain.
Analytical expressions proposed by Van Ge-nuchten (1980) for the soil water content reten-tion curve, θ(h), and the hydraulic conductivity function, k(θ), are:
θe = 1 h ≥ 0 (3)
K(θ) = Ks θeλ [1 – (1 – θ
e1/m)m]2 h < 0
K(θ) = Ks h ≥ 0 (4)
where:
θe – effective soil water content (–) Ks – saturated hydraulic conductivity (l/T)
θr , θs – residual and saturated soil water contents(l3/l3)
λ – pore-connectivity parameter (–) (λ = 0.5 in this case)
α (l–1), n,m (= 1 – 1/n) – empirical parameters (–)
Parameters describing aggregate shapes are the shape factor β (–) (= 15 for spherical aggregates, = 3 for cubic aggregates), the characteristic length of aggregate a (l) (sphere radius or half size of the cube edge), and the dimensionless scaling factor
γw (–) (= 0.4). The mass exchange between the matrix and macropore regions, Гw, is calculated using following equation:
(5)
where:
Ka – the effective saturated hydraulic conductivity of the interface between the two pore domains (l/T)
Scenarios of one-hour ponded infiltration in soils without and with macropores
The impact of macropores on water flow in the soil profile is demonstrated on the simulation of
the one-hour ponded infiltration with the ponded depth of 1 cm on the top of the soil profile. The initial conditions were given by the pressure head of –200 cm in all domains. The bottom boundary condition was defined as free drainage. Sink terms representing the root water uptake were assumed to be equal to zero. Parameters characterizing hydraulic properties were set such to study the impact of macropore from the following points of view:
(a) shapes and sizes of aggregates,
(b) quality of macropore (described by variable soil water retention curves and saturated hydraulic conductivities), and
(c) the ratio of the macropore domain to the whole pore domain.
The basic assumption was that the soil water retention and hydraulic conductivity curves ob-tained for the mono-modal soil porous system also define hydraulic properties of the matrix domain of the dual-permeability system. Van Genuchten parameters were as follows: θr = 0.09 cm3/cm3,
θs = 0.408 cm3/cm3, α = 0.012 cm–1, n = 1.28 and
Ks = 0.0043 cm/min.
Soil hydraulic parameters of the macropore domain were estimated assuming aggregate de-velopment and hydro-physical properties. Soil porosities at observed locations varied between 40% and 55% and maximum capillary adsorptions varied between 34% and 44%. Experimentally determined values of the saturated hydraulic conductivity in clay soils may vary by two or more orders of magnitude (Kočárek et al. 2005).Two limiting cases of aggregate shapes were studied. Shapes of aggregates were defined as either spheri-cal or cubic. Spherispheri-cal aggregates may correspond with the angular blocky structure and cubic ag-gregates may represent the cubic seag-gregates. Flow in fractures may be approximated by using the greater characteristic length of cubic aggregates. Ratios of the macropore domain to the total soil volume were assumed to be 0.05, 0.1 and 0.15. Parameters of the soil water retention curve were set to ensure that the total saturated soil water content of the dual-permeability system was higher than for the single-porosity system and that macropores were filled with water only for pressure heads close to zero (step-shaped soil water retention curves). The saturated hydraulic conductivities of the macropore domain were set to be 100 and 500 times greater than for the matrix domain.
+|΅h| h<0
= Ό Ό
Ό h Ό = Ό
n m r
s r e
1 1 )
(
2
w Ka w hf hm a
E J
The following nine scenarios were studied. Sce-nario A1 represents a soil without macropores. Scenarios B1, B2, B3 and B4 were designed to asses the impact of the size and shape of aggregates. The Van Genuchten parameters in all macropore domains were defined as follows: θr = 0 cm3/cm3,
θs = 0.7 cm3/cm3, α = 0.07 cm–1, n = 3 and K
s =
0.43 cm/min. The ratio of the macropore domain,
fw , was 0.05, the shape factor, β,was 3 (B1 and B2) and 15 (B3 and B4) and the characteristic length of an aggregate, a, was 1 (B1 and B3) and 2.5 cm (B2 and B4). Scenarios C1, C2 and C3 were designed to assess macropore quality. The Van Genuchten parameters in the macropore domain were define as follows: θr = 0 cm3/cm3, θ
s = 0.7 cm3/cm3, α =
0.07 cm–1, n = 3 and K
s = 0.43 cm/min (C1), θr = 0
cm3/cm3, θ
s = 0.9 cm3/cm3, α = 0.15 cm–1, n = 3 and Ks = 0.43 cm/min (C2), and θr = 0, θs = 0.7, α = 0.07 cm–1, n = 3 and K
s = 2.15 cm/min (C3). The ratio
of the macropore domain, fw , was 0.1, the shape factor, β, was 3 and the characteristic length of an aggregate, a, was 1 cm. Scenario D1 together with scenarios B1 and C1 were designed to assess the impact of the ratio of the macropore domain. All parameters in the D1 scenario were the same as in scenarios B1 and C1, with the exception the ratio of the macropore domain, fw , that was equal to 0.15. The effective saturated hydraulic conductiv-ity, Ka, was same for all scenarios and equaled to 0.0001 cm/min. The total soil hydraulic properties of the dual-permeability system are given by the sum of the properties for each domain multiplied by its fraction in the system. Soil water retention curves, θ(h), for the single-porosity system (A1) and the dual-permeability systems (C1 or C3) are shown in Figure 2. Hydraulic conductivity curves,
K(h), may be plotted similarly.
reSultS ANd dISCuSSIoN
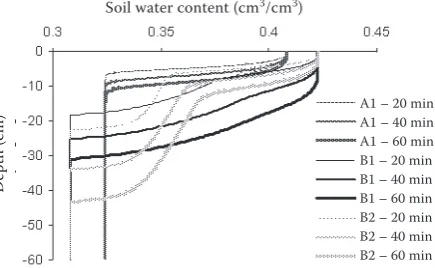
Cumulative infiltrations and infiltration rates versus time for all scenarios (except for B3 and B4) are shown in Figures 3 and 4. Shapes of the wetting front in the soil profile 20, 40 and 60 min after the beginning of the ponded infiltration for scenarios A1, B1 and B2 are shown in Figure 5. While in the soil profile without macropores the
Soil water content (cm3/cm3)
Pr
es
su
re
h
ea
d
(c
m
[image:5.595.305.532.221.346.2])
Figure 2. Soil water retention curves for single-porosity model (scenario A1) and dual-permeability models (sce-narios C1 and C3)
Single-porosity – – Dual-permeability
matrix pores - - - Dual-permeability
macropores Dual-permeability
both
Time (min)
C
um
ul
at
iv
e
in
fil
tr
at
io
n
(c
m
[image:5.595.305.530.406.531.2])
Figure 4. Infiltration rate at the top of the soil profile Figure 3. Cumulative infiltration at the top of the soil profile
Figure 5. Soil water content distributions in the soil profile – wetting fronts 20, 40 and 60 minutes after the beginning of the ponded infiltration for scenarios A1, B1 and B2
Time (min)
In
fil
tr
at
io
n
ra
te
(c
m
/m
in
)
D
ep
th
(c
m
)
Soil water content (cm3/cm3)
[image:5.595.64.296.571.711.2] [image:5.595.309.527.579.713.2]wetting front after 60 min was only in the depth of 12 cm, in the case with macropores the wetting front was in the depth of 30 and 43 cm for scenarios B1 and B2, respectively. The total cumulative in-filtration was 0.70 cm in the soil profile without macropores, and 2.72 (B1) and 2.61 (B2) cm in the soil profiles with macropores. The wetting front in the scenario with bigger aggregates moved to the greater depth than in the scenario with smaller aggregates. However, the total cumulative infiltra-tion was slightly lower due to the irregularity of the wetting front. Simulated results correspond with the probable type of water flow in soils with the cubic segregates and fracture system. Shapes of the wetting front for scenarios B3 and B4 (not shown) exhibited the same trends as those for B1 and B2 scenarios. The wetting front moved only to the depth of 20 and 32 cm for scenarios B3 and B4, respectively, due to round shape of soil aggregates that represent the soil porous system with angular blocky structure. The total cumula-tive infiltration was similar to those in scenarios B1 and B2, i.e., 2.71 and 2.71 cm for scenarios B3 and B4, respectively.
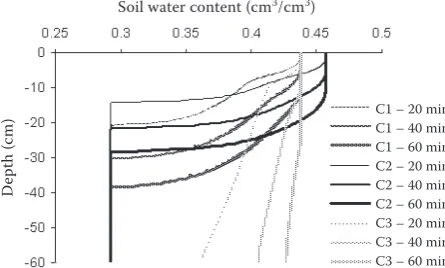
Shapes of the wetting front in the soil profile 20, 40 and 60 min after the beginning of the ponded infiltration for scenarios C1, C2 and C3 are shown in Figure 6. A comparison of scenarios C1 and C2 shows that, in spite of the higher total saturated water content in scenario C2, the wetting front moved to smaller depths than in scenario C1 due to the less gradual shape of the soil water retention curve. The total cumulative infiltration (4.54 and 4.12 cm for scenarios C1 and C2, respectively) was also smaller. A comparison of scenarios C1 and C3
shows that the saturated hydraulic conductivity has the greatest impact on water flow in the soil profile. The soil profile for scenario C3 is at the end of the simulated infiltration almost completely saturated. The total cumulative infiltration was 16.01 cm.
Shapes of the wetting front in the soil profile 20, 40 and 60 min after the beginning of the pon-ded infiltration for scenarios B1, C1 and D1 are shown in Figure 7. Higher ratios of the macropore domain caused progress of the wetting front into greater depths and increased total cumulative infiltrations as follows: 2.72 (B1), 4.54 (C1) and 6.31 (D1) cm.
The presented results show that water flow in clay soils may be predominantly affected by char-acteristics of macropores and fractures. Water is transported downwards mainly through macro-pores and fractures and then redistributed into the matrix pores. As a result, at the end of the infiltration event, the saturation of a soil with macropores is higher than would be expected in a soil without macropores and fractures.
CoNCluSIoNS
Macropores and fractures play an important role in water transport. The impact of macro-pores is greater in clay soils where the hydraulic conductivity is expected to be very low. Results of numerical simulations showed that the cumu-lative infiltration into the soil with and without macropores may differ by two or more orders of magnitude. The appropriate models must then be used to describe non-equilibrium flow in such
D
ep
th
(c
m
)
Soil water content (cm/cm)
C1 – 20 min C1 – 40 min C1 – 60 min C2 – 20 min C2 – 40 min C2 – 60 min C3 – 20 min C3 – 40 min C3 – 60 min
D
ep
th
(c
m
)
Soil water content (cm/cm)
[image:6.595.307.526.83.222.2]B1 – 20 min B1 – 40 min B1 – 60 min C1 – 20 min C1 – 40 min C1 – 60 min D1 – 20 min D1 – 40 min D1 – 60 min
[image:6.595.62.285.85.219.2]Figure 7. Soil water content distributions in the soil profile – wetting fronts 20, 40 and 60 minutes after the beginning of the ponded infiltration for scenarios B1, C1 and D1 Figure 6. Soil water content distributions in the soil profile
soils. Since the water in dual-permeability sys-tems is predominantly influenced by properties of macropores and fractures, suitable methods must be used to determine characteristics of the macropore domain.
Acknowledgement.Thanks are due to l. Borůvka, K. Němeček, M. Rohošková and V. Penízek for their help with the field and laboratory work and help with photographic documentation.
references
Ahuja l.R., Hebson C. (1992): Root Zone Water Quality Model. GPSR Technical Report No. 2, USDA, ARS, Fort Collins, CO.
Chen C., Wagenet R.J. (1992): Simulation of water and chemicals in macropore soils. Part 1. Representation of the equivalent macropore influence and its effect on soil water flow. Journal of Hydrology, 130: 105–126. Gerke H.H., Van Genuchten M.Th. (1993): A
dual-po-rosity model for simulating the preferential movement of water and solutes in structured porous media. Water Resources Research, 29: 305–319.
Gerke H.H., Van Genuchten M.Th. (1996): Macroscopic representation of structural geometry for simulating water and solute movement in dual-porosity media. Advances in Water Resources, 19: 343–357.
Germann P.F. (1985): Kinematic wave approach to in-filtration and drainage into and from soil macropores. Transactions of the ASAE, 28: 745–749.
Germann P.F., Beven K. (1985): Kinematic wave approxi-mation to infiltration into soils with sorbing macropores. Water Resources Research, 21 (7): 990–996.
Jarvis J. (1994): The MACRO model. Technical descrip-tion and sample simuladescrip-tion. Reports and dissertadescrip-tions 19. Department of Soil Science, Swedish University of Agricultural Science, Uppsala, Sweden, 51.
Kočárek M., Kodešová R., Kozák J., Drábek O., Vacek O. (2005): Chlorotoluron behaviour in five varying soil types. Plant, Soil and Environment, 51: 304–309. Phillip J.R. (1968): The theory of adsorption in aggregated
media. Australian Journal of Soil Research, 6: 1–19. Šimůnek J., Šejna M., Van Genuchten M.Th. (1998):
The HYDRUS-1D Software Package for Simulating the One-dimensional Movement of Water, Heat and Mul-tiple Solutes in Variably-saturated Media. Version 2.0. IGWMC-TPS-53. International Ground Water Modeling Center, Colorado School of Mines, Golden, CO. Šimůnek J., Jarvis N.J., Van Genuchten M.Th.,
Gär-denäs A. (2003): Review and comparison of models for describing non-equilibrium and preferential flow and transport in the vadose zone. Journal of Hydrology,
272: 14–35.
Valla M., Kozák J., Ondráček V. (2000): Vulnerabi-lity of aggregates separated from selected anthrosols developed on reclaimed dumpsites. Rostlinná Výroba,
46 (12): 563–568.
Van Genuchten M.Th. (1980): A closed-form equation for predicting the hydraulic conductivity of unsatura-ted soils. Soil Science Society of America Journal, 44: 892–898.
Van Genuchten M.Th., Wierenga P.T. (1976): Mass transfer studies in sorbing porous media: I Analytical solutions. Soil Science Society of America Journal,
40: 473–480.
Vogel T., Gerke H.H., Zhang R., Van Genuchten M.Th. (2000): Modeling flow and transport in a two-dimensional dual-permeability system with spatial variable hydraulic properties. Journal of Hydrology,
238: 78–89.
Received for publication November 14, 2005 Accepted after corrections February 15, 2006
Corresponding author: