Accepted Manuscript
Experimental and computational analysis of a tangent ogive slender body at incompressible speeds
Janine Schoombie, Sean Tuling, Laurent Dala
PII: S1270-9638(16)31277-9
DOI: http://dx.doi.org/10.1016/j.ast.2017.06.011 Reference: AESCTE 4067
To appear in: Aerospace Science and Technology
Received date: 15 December 2016 Revised date: 8 June 2017 Accepted date: 10 June 2017
Please cite this article in press as: J. Schoombie et al., Experimental and computational analysis of a tangent ogive slender body at incompressible speeds,Aerosp. Sci. Technol.(2017), http://dx.doi.org/10.1016/j.ast.2017.06.011
Experimental and computational analysis of a tangent ogive
slender body at incompressible speeds
Janine Schoombie1
Council for Scientific and Industrial Research, Pretoria, Gauteng, South Africa
Sean Tuling2
University of the West of England, Bristol, United Kingdom
and Laurent Dala3
Northumbria University, Newcastle, United Kingdom
A combined computational and experimental analysis was performed on a tangent ogive
body with very low aspect ratio wings in the '+' (plus) orientation at Mach numbers 0.1, 0.2
and 0.3, with the aim of developing a database of global force and moment loads. Three
different span to body diameter ratios were tested with aspect ratios of 0.022, 0.044 and
0.067. Aerodynamic loads were obtained and flow visualization was performed to gain an
understanding of the lee side flow features. It was found that the global loads were
independent of Mach number as is expected at incompressible speeds. The numerical
centre-of-pressure predictions were validated experimentally for angles of attack higher
than 6 degrees. The correlation below 6 degrees was only reasonable due to the relative
higher balance uncertainties. Vortex separation was observed for all three span to body
diameter configurations, whose locations did not correlate to that of an impulsively started
flow for a flat plate. This indicated possible configuration specific phenomena or body-wing
interactions.
Nomenclature
AR = Aspect ratio
D = Body diameter (m)
1 Aeronautical Engineer, CSIR, Defense Peace Safety and Security, Pretoria, South Africa
2Senior Lecturer, Faculty of Engineering and Technology, University of the West of England, Bristol, United Kingdom, BS16 1QY, Member of AIAA
CN = Normal force coefficient
Cm = Pitching moment coefficient
FS = Full-scale
h = Strake height (m)
M = Mach number
N = Normal force (N)
s = Wing span (m)
sm = Semi-span (m)
XCp = Centre-of-pressure position (calibers)
Į = Angle of attack (degrees/º)
ɒ୵ = Wall shear (Pa)
I.Introduction
HE aerodynamics of missiles have been the topic of many studies since the early 1940's and have since been
improved by the development of analytical and computational models for aerodynamic analyses.
For engineering level predictions, used in the conceptual and preliminary design phases, many prediction models
exist (1)(2) (3) (4) (5) (6)(7) (8)for estimating the aerodynamic loads on various missiles. For engineering level codes, the
primary theoretical foundation is the linearised potential equation and slender body theory (SBT)(2). SBT is limited
to very low angles of attack because it is a linear theory, whereas the flow topologies at any higher angles of attack
are non-linear. The earliest heuristic formulation to overcome this limitation was proposed by Allen and Perkins (9)
and has been the basis for almost all engineering level codes. The formulation sums the potential attached flow
slender body component with a non-linear separated flow cross-flow drag component. The non-linear component
utilises experimental data resulting in these codes being semi-empirical in nature (10). The semi-empirical nature of
the methods also limits some of the codes to specific configurations such as circular or square cross sections.
Much of the pioneering work on slender configurations was performed for bodies with wings of aspect ratios
varying from 0.5 to 4. The increase in normal force of wings, with aspect ratio of order 1, with angle of attack is
linear allowing SBT to be applied to higher angles of attack and have been successfully applied to angles of attack
of 20 to 25 degrees. The use of the equivalent angle of attack method has allowed the original linear methods to be
have been used more extensively than in the past. These strakes demonstrate a wing-to-body carryover factor, ܭೈ,
which has a strong dependence on angle of attack which contrasts to the commonly used derivation (13). Previous
work by Tuling et al (1)(14)(15) to model these effects has been limited to supersonic speeds and span to body diameter
(s/D) ratio of 1.25. The same configuration has been investigated at subsonic speeds by Arevalo-Campillos et al
(16), having the same span to body diameter ratio of 1.25, but only measuring lee side vortex positions as a function
of axial locations with no further flow field analysis.
The current investigation extends the existing database of information by obtaining validated CFD data for the
same tangent-ogive body with cruciform strakes at low Mach numbers i.e. M<0.3, and two other span to body
diameter ratios namely 1.5 and 1.75.
II.
Configuration
The configuration is a circular body with a tangent ogive nose of three diameter lengths, an aft body of three
diameter lengths and a centre section with cruciform strakes. The configuration parameters are listed in Table 1.
Table 1: Generalised wing-body model parameters
Parameter Value Unit
Total Length 19 D (calibers)
Nose length 3 D (calibers)
Strake length 11.25 D (calibers)
Aft body length 3 D (calibers)
Moment reference centre (mrc) 0 (Nose tip) D (calibers) Model Diameter (full scale) 80 mm
The strakes have a leading edge sweep of 45 degrees and leading edges are located at 4.25 diameters (D) from
the nose tip. The following strake sizes were considered:
• s/D = 1.25; AR = 0.0222
• s/D = 1.50; AR = 0.0444
• s/D = 1.75; AR = 0.0667
The full-scale configuration with a span to body diameter ratio of 1.25 is illustrated in Fig. 1, but also include the
strake dimensions for the span to body diameter ratios of 1.5 and 1.75. For the experimental tests, a body diameter
Fig.1:Configuration dimensions for s/D of 1.25, 1.5 and 1.75 (in mm).
III.Experimental Setup
The tests were conducted in the low speed wind tunnel (LSWT) facility at the Council for Scientific and Industrial
Research (CSIR) which is a closed loop subsonic facility with a 2.2m by 1.5m test section with corner fillets. The
56% scaled model was used in the experimental simulations and is shown in Fig.2. With a body diameter of 45mm
Tests were conducted at three different incompressible Mach numbers, namely 0.1, 0.2 and 0.3 respectively. The
test conditions at each Mach number are given in Table 2. The dynamic viscosity was calculated using Sutherland’s
law and the velocity was measured using the facility pitot static probe. The aerodynamic loads of interest are the
normal force and centre-of-pressure positions. The loads were measured using a 12mm strain-gauge balance
[image:6.612.105.511.319.677.2]attached to a sting extension which was mounted to the movable C-strut as shown in Fig.3.
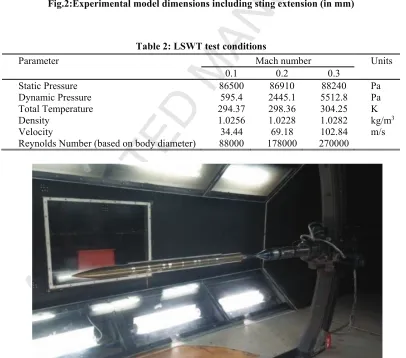
Fig.2:Experimental model dimensions including sting extension (in mm)
Table 2: LSWT test conditions
Parameter Mach number Units
0.1 0.2 0.3
Static Pressure 86500 86910 88240 Pa
Dynamic Pressure 595.4 2445.1 5512.8 Pa
Total Temperature 294.37 298.36 304.25 K
Density 1.0256 1.0228 1.0282 kg/m3
Velocity 34.44 69.18 102.84 m/s
Reynolds Number (based on body diameter) 88000 178000 270000
Each configuration was tested at all three Mach numbers with an upright and inverted scan: the model is in the
upright position at a 0 degree roll angle and inverted at a 180 degrees roll angle. The upright scan pitch range was
from -4 to 17 degrees whilst the inverted scan was from -20 to 4 degrees. The two scan results for each test
configuration was then used to correct for flow angularity and zero coefficient offsets. No wall interference
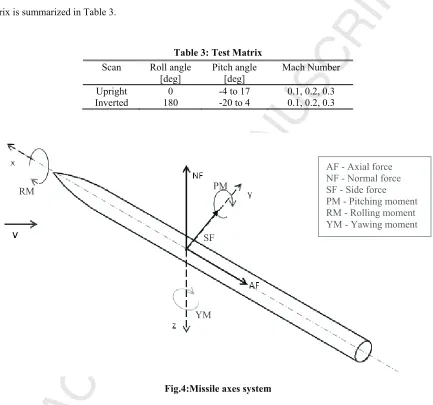
corrections were applied due to the low blockage i.e. < 0.1%. The test axes system is given in Fig.4and the test
[image:7.612.88.521.197.602.2]matrix is summarized in Table 3.
Table 3: Test Matrix
Scan Roll angle
[deg] Pitch angle [deg] Mach Number Upright 0 -4 to 17 0.1, 0.2, 0.3 Inverted 180 -20 to 4 0.1, 0.2, 0.3
Fig.4:Missile axes system
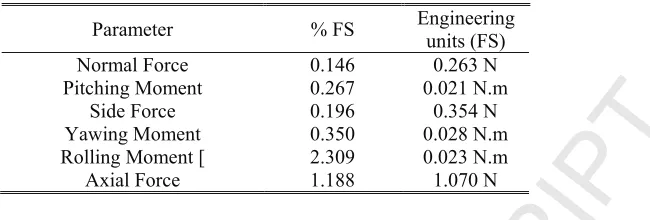
The balance uncertainties, calculated according to the AIAA uncertainty standard (17) and based on a coverage
factor of k=2 for the aerodynamic loads, are listed in Table 4. PM
SF RM
YM
Table 4:Balance Loads Uncertainties
Parameter % FS Engineering units (FS) Normal Force 0.146 0.263 N Pitching Moment 0.267 0.021 N.m
Side Force 0.196 0.354 N Yawing Moment 0.350 0.028 N.m Rolling Moment [ 2.309 0.023 N.m Axial Force 1.188 1.070 N
In this study the coefficients of interest are limited to the normal force and pitching moment coefficients (and the
centre-of-pressure location by extension). The resulting coefficient uncertainties are listed in Table 5 for each Mach
[image:8.612.173.498.104.214.2]number.
Table 5:CoefficientUncertainties
Parameter Mach number
0.1 0.2 0.3
ࡺ 0.278 0.0677 0.0300
0.502 0.1220 0.0542
The centre-of-pressure uncertainty, ¨XCp, is dependent on the values of the normal force and pitching moment,
and therefore varies with the angle of attack.
IV.Numerical Simulations
A global loads and flow field database was generated using the ANSYS Fluent v15 RANS finite volume
computational fluid dynamics (CFD) solver. A symmetric three-dimensional computational model was constructed
since the airframe is axisymmetric and no asymmetric vortices are expected at the angles of attack relevant to this
study (18)he experimental tests also did not show any appreciable side loads at the angles of attack of interest.
Utilising a full model would have unnecessarily increased the computational cost. The fluid domain is illustrated in
Fig.5. A pressure-far-field boundary condition was used for the inlet boundary, a pressure outlet for the outlet
boundary with a symmetry plane to simulate a half model. The fluid domain was sized to be a minimum of 100
Fig.5: Computational fluid domain
A mesh independence analysis was performed, resulting in the use of a structured mesh of 22million cells. The
resulting GCI was no more than 1.3% between 0o and 4o angle of attack, and no more than 0.3% at moderate angles
of attack.In order to accurately capture the nature of the vortices and their effects on the aerodynamic loads, the
meshed volume containing the lee side flow and shed vortices was refined so that the vortex core consisted of at
least 8 cells (in the cross-flow plane). The boundary layer was simulated with near-wall treatment such that at least
three cells were present in the viscous sub-layer. The resulting y+ values were less than 1 as reported by the Fluent
code.
The simulations implemented a coupled pressure-velocity algorithm with a second order upwind spatial
discretization scheme. No unsteady or transient simulations were performed due to the predominant steady state
nature of the expected flow features in the lee side of body-strake combination. Subsequent inspection of the flow
field confirmed this assumption. The Spalart-Allmaras turbulence model was used as it is more robust and less
costly than two equation models.
The simulations were run at Mach numbers of 0.1 and 0.2 and angles of attack from 0 to 25 degrees. For each
angle of attack the flow angle is changed in the inlet and outlet boundary conditions, so that only one mesh was
required for each configuration. The simulations were started with the 0° angle of attack case which was initialized
by setting the whole flow domain to the inlet conditions. The Fluent supplied full multi-grid (FMG) initialization Inlet
Symmetry plane
Outlet
solver was applied before the final solution was iterated to convergence, typically in 10 000 steps without any
convergence acceleration, using a CFL number of 5. Convergence was achieved when the residuals reduced by at
least three orders of magnitude, and the residuals and global force and moment loads asymptoted to constant values.
The subsequent angles of attack utilized the previous angle of attack solution, i.e. the previous lower angle of attack,
as its initial conditions.
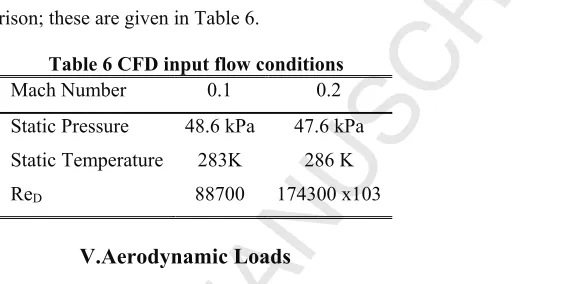
The inlet and outlet conditions for the relevant Mach numbers were determined to be the same as that of the
[image:10.612.208.498.223.365.2]wind tunnel conditions for comparison; these are given in Table 6.
Table 6 CFD input flow conditions
Mach Number 0.1 0.2 Static Pressure 48.6 kPa 47.6 kPa Static Temperature 283K 286 K
ReD 88700 174300 x103
V.Aerodynamic Loads
The loads of interest, normal force and pitching moment coefficients, for the three configurations are shown in
Figures 6 to 8. The CFD simulations were found to correlate well with the available experimental data. However, for
s/D of 1.25, there is a noticeable discrepancy between the experimental and CFD normal force coefficient () at
20 degrees angle of attack, though this difference is small and still falls within the estimated balance uncertainties.
From these results it was established that the CFD simulations predicted the lee side flow sufficiently to be used as a
reference for comparisons with the engineering prediction methods. It should be noted that the experimental normal
force did not show any Mach number dependence, which corresponds with slender body theory predictions.
The centre-of-pressure positions (XCp) also show no dependence on Mach number above angles of attack of
6 degrees. The discrepancies below 6 degrees have been attributed to the increase in uncertainty at very low loads.
The uncertainty in centre of pressure (¨XCp) was calculated to be below 0.3 for angles of attack above 6 degrees.
The increase in uncertainty at angles of attack below 6 degrees is due to the balance uncertainty being a constant
value with the normal force and pitching moment being in the lower 10% of the load range of the balance. Since the
pressure is dependent on both normal force and pitching moment, the level uncertainty of
centre-of-pressure at these low angles of attack increases correspondingly.
From these results it was established that the CFD simulations predicted the lee side flow accurately and can be
(a) (b)
Fig.6: Validation of CFD (a) CN and (b) XCp results for s/D=1.25
(a) (b)
Fig.7:Validation of CFD (a) CN and (b) XCp results for s/D=1.5
-1 0 1 2 3 4 5 6 7 8 9
-5 0 5 10 15 20 25
CN
ɲ[deg] LSWT - M0.1 LSWT - M0.2 LSWT - M0.3 CFD - M0.1
0 1 2 3 4 5 6 7 8 9 10
-5 0 5 10 15 20 25
XCp
ɲ[deg]
LSWT - M0.1 LSWT - M0.2 LSWT - M0.3 CFD - M0.1
-2 0 2 4 6 8 10 12 14
-5 0 5 10 15 20 25
CN
ɲ[deg] LSWT - M0.1 LSWT - M0.2 LSWT - M0.3 CFD - M0.1
0 1 2 3 4 5 6 7 8 9 10
-5 0 5 10 15 20 25
XCp
ɲ[deg]
(a) (b)
Fig.8:Validation of CFD (a) CN and (b) XCp results for s/D=1.75
For the computational simulations the centre-of-pressure positions were not calculated below 1 degree angle of
attack. It was observed that the experimental uncertainty for the centre-of-pressure position was below half a caliber
for angles of attack above 3 degrees.
Even though the uncertainty for the centre-of -pressure is below 3 degrees is greater than half a caliber, the
experimental and numerical simulations show similar trends. Also, the centre-of-pressure moves forward towards
the nose because the contribution of the body reduces to only that due to the nose below angles of attack of
4 degrees since no aft body vortices form with only the nose and strakes contributing to the centre-of-pressure. The
trend is also similar to that reported in reference (21) for supersonic flows.
The consolidated numerical results, which are independent of Mach number for the three span to body diameter
ratios (s/D),are shown in Fig.9. As expected, the data indicates an increase in the lift curve slope with increasing
wing span, whilst no specific trend is observed in the centre-of-pressure positions particularly below 10 degrees
angle of attack. -2
0 2 4 6 8 10 12 14 16
-5 0 5 10 15 20 25
CN
ɲ [deg] LSWT - M0.1 LSWT - M0.2 LSWT - M0.3 CFD
0 2 4 6 8 10 12 14
-5 0 5 10 15 20 25
XCp
ɲ [deg]
(a) (b)
Fig.9:Comparison of CFD (a) CN and (b) XCp results for three span to body diameter ratios (s/D)
VI. Vortex Positions
The vortex positions of the rolled up vortex sheet were measured from the numerical simulations at various axial
stations by inspecting the flow field and locating where the cross-sectional in-plane velocity was zero, which was
the same procedure applied to the experimental observations. They were compared to experimental results obtained
for the s/D=1.25 configuration. The vertical and lateral locations for the angles of attack of 6, 10, 15, 20 and
25 degrees are shown in Figures 10 to 14.
(a) (b)
Fig.10:(a) Vertical and (b) lateral vortex position comparison for angle of attack of 6 degrees
0 2 4 6 8 10 12 14 16
0 5 10 15 20 25
CN
ɲ[deg] s/D = 1.25
s/D = 1.5 s/D = 1.75
3 4 5 6 7 8 9 10
0 5 10 15 20 25
XCp
[calibers]
ɲ [deg]
s/D = 1.25 s/D = 1.5 s/D = 1.75
0 0.2 0.4 0.6 0.8 1 1.2 1.4
0 5 10 15 20
z/a x/D CFD s/D=1.25 CFD s/D=1.50 CFD s/D=1.75 LSWT s/D=1.25 0 0.2 0.4 0.6 0.8 1 1.2 1.4 1.6 1.8 2
0 5 10 15 20
(a) (b)
Fig.11:(a) Vertical and (b) lateral vortex position comparison for angle of attack of 10 degrees
(a) (b)
Fig.12:(a) Vertical and (b) lateral vortex position comparison for angle of attack of 15 degrees
(a) (b)
Fig.13: (a) Vertical and (b) lateral vortex position comparison for angle of attack of 20 degrees
0 0.5 1 1.5 2
0 5 10 15 20
z/a x/D CFD s/D=1.25 CFD s/D=1.50 CFD s/D=1.75 LSWT s/D=1.25 0 0.2 0.4 0.6 0.8 1 1.2 1.4 1.6 1.8
0 5 10 15 20
y/a x/D CFD s/D=1.25 CFD s/D=1.50 CFD s/D=1.75 LSWT s/D=1.25 0 0.5 1 1.5 2 2.5
0 5 10 15 20
z/a x/D CFD s/D=1.25 CFD s/D=1.50 CFD s/D=1.75 LSWT s/D=1.25 0 0.2 0.4 0.6 0.8 1 1.2 1.4 1.6 1.8
0 5 10 15 20
y/a x/D CFD s/D=1.25 CFD s/D=1.50 CFD s/D=1.75 LSWT s/D=1.25 0 0.5 1 1.5 2 2.5 3
0 5 10 15 20
z/a x/D CFD s/D=1.25 CFD s/D=1.50 CFD s/D=1.75 LSWT s/D=1.25 LSWT body vortex
0 0.2 0.4 0.6 0.8 1 1.2 1.4 1.6 1.8
0 5 10 15 20
(a) (b)
Fig.14:(a) Vertical and (b) lateral vortex position comparison for angle of attack of 25 degrees
Good correlation in the lateral direction was obtained, whilst the trends for the vertical direction correlated well
with the exception of a constant offset of a quarter body diameter. Not captured were the separate body and strake
vortices at the angles of attack of 20 degrees and 25 degrees. This was due to the inability to discern two separate
vortices even with the use of vortex identification criteria such as the Q-, ߣଶ- and ȟ-criterion.
At angles of attack above 15 degrees, the change in characteristics of the vertical vortex position after 12 body
diameters is probably due to the interaction of the body with the strake, pointing towards a change in the rolled up
vortex characteristics from AR=0.044 to AR=0.022.
The location of the vortex in the lateral direction, when compared to the vertical location, is constant as the
vortex evolves along the length of the airframe. For the span to body diameter ratio of 1.25 the vortex does move
towards the centreline. It appears that the interaction with the body on the evolution of the lateral location of the
rolled up vortex sheet is less significant for the two higher span to body diameter ratios.
VII.On-Surface Flow Visualisation
In addition to the aerodynamic loads, surface flow visualization by means of oil flow was also carried out during
the wind tunnel tests. A titanium dioxide-oil (TDO) mixture was applied to the surface of the body and the body was
covered with a black coating. This dark background is necessary to provide contrast between the body and the white
of the TDO mixture for clear visual indications of the surface flow. The flow over the model surface was
photographed for selected angles of attack. 0 0.5 1 1.5 2 2.5 3 3.5
0 5 10 15 20
z/a x/D CFD s/D=1.25 CFD s/D=1.50 CFD s/D=1.75 LSWT s/D=1.25 LSWT body vortex
0 0.2 0.4 0.6 0.8 1 1.2 1.4 1.6 1.8
0 5 10 15 20
The flow visualization tests were limited to an airspeed of Mach 0.2 as the load results were already shown to
have no Mach number dependence. In Fig.15 the top view of the experimental oil flow is compared to the CFD wall
shear stress (ɒ୵) for 15 degrees angle of attack and s/D of 1.5. In the experimental top view photographs the
perspective of the model is significantly different from the top view plane of the CFD images. However the expected
flow features are observed in both the experimental and CFD surface flow. On the leading edge of the strakes a
pattern of separation lines are observed in the experimental photographs that correspond to the CFD shear stress
(ɒ୵) contours. These observations are typical of what was observed at s/D of 1.25 and 1.75 and at all angles of
(a)
߬௪ሺܲܽሻ
(b)
(c)
Fig.15: Top view comparison of (a) experimental surface flow and (b) CFD wall shear stress (Pa) with (c) CFD pathlines for s/D = 1.5 and 15 degrees angle of attack
In the side view of the experimental flow visualization (Fig.16), a prominent stagnation line is observed
extending from the wing tip to the base of the body as indicated by the gathering of the titanium dioxide-oil (TDO)
mixture (white contour). Again this correlates reasonably well with the flow patterns observed in the CFD
(a)
߬௪ሺܲܽሻ
(b)
(c)
Fig.16: Side view comparison of (a) experimental surface flow and (b) CFD wall shear stress (Pa) with (c) CFD pathlines for s/D = 1.5 and 15 degrees angle of attack
VIII.Vortex Separation
It was observed that, for the experimental surface flow, the separation lines originating at the leading edge
migrate to the strake tip after the swept leading edge and continues along the length of the strake at the edge for a
distance before thickening and moving inward toward the root of the strake. The interpreted flow fields resulting in
the various oil ridges are now described using the s/D=1.5 configuration at 15 degrees as illustrated in Fig.17, which
Fig.17:Reattachment and separation zones for s/D=1.5 at 15 degrees
Starting at the leading edge of the strake, the leading edge vortex results a cleared section at the tip of the strake
(see Fig.17 region A). This vortex has a stagnation point on the body resulting in a small recirculation zone at the
strake body junction. Moving downstream along the strake, the leading edge vortex merges with the side edge
vortex with the subsequent movement of the stagnation point toward the wing body junction, then onto the upper
surface of the strake and towards the tip edge; leaving the observed oil ridge aft of the leading edge. At this stage
the vortex is aligned with the freestream flow. This vortex remains attached to the strake as we progress down the
length of the strake. At a certain stage, the vortex separates from the strake. This is evidenced by the thick oil ridge
band and is due to the growing body-wing recirculation vortex (see Fig.17 region B). Once the body-wing junction
establishes itself an oil ridge develops at the body-wing junction because of the tertiary vortex at the body-wing
junction.
The location at which the vortex separation occurs (Fig. 17 region B) was determined for the experimental tests
for angles of attack of 10 degrees and above, for all three configurations. The separation locations are given in
Fig.18 in semi-spans (sm) from the wing leading edge.
A B
Fig.18: Vortex separation locations for experimental tests
The vortex separation in the CFD simulations show similar results. By observing the vortex in the vertical plane
before and after the separation location, it was confirmed that there is good correlation with the experimental
observations. In Fig.19 the in-plane velocity vectors are plotted for s/D=1.5 at 15 degrees angle of attack and at
locations before and after the separation point to demonstrate the vortex separation. This dependency on the strake
to body diameter is probably because the body behaves less as a pure reflection plane as the ratio increases, which
effectively increases the span or aspect ratio.
(a) (b)
Fig.19: In-plane velocity vectors for s/D=1.5 at 15 degrees angle of attack at (a) 10 spans and (b) 25 semi-spans.
5 10 15 20 25 30
10 12 14 16 18 20
Separatio
n
Lo
catio
n
[1/s
m
]
The effect of the recirculation bubble as it grows in size can be observed such that by 25 semi-span widths the
recirculation bubble dominates the complete strake semi-span with the vortex effectively separated from the surface
of the strake.
If it is assumed that the steady three dimensional flow over the slender body can be reduced to an impulsively
started two-dimensional unsteady problem (22), it was observed that the location of the separated vortex is different
to that report by Sarpkaya (23) regarding impulsively started flows for a flat plate who indicated that the first vortex
is released into the freestream flow at 24 semi-span widths. At an angle of attack of 15 degrees this would
correspond to 90 semi-span widths. Even if the location for the initial vortex separation is assumed to occur when
the drag coefficient first peaks, this would occur at 2 semi-span widths for an impulsively started rectangular flat
plate. Again for the angle of attack of 15 degrees, this would correspond to 8 semi-span widths. The observed
separation locations (Fig.18) for none of the span to body diameter ratios of this study correspond to any of the flow
features reported by reference (23), indicating possible configuration specific flow phenomena and/or body wing
interactions of which the mechanism is not known.
As shown in Fig. 17 the vortex separation point was observed to change with increasing s/D and angles of attack
with the following trends:
• For a given angle of attack, the secondary separation point will move further downstream with
increasing s/D and further upstream with decreasing s/D.
• For a given s/D, the secondary vortex point will move forward with increasing angle of attack.
The mechanism causing the differences in separation location compared to a flat plate is recommended as a topic for
further investigation.
IX.Conclusions
Global force and moment loads, and flow features database was generated using both experimental and
computational analyses for three slender body configurations with cruciform wings and circular bodies in the ‘+’
orientation. The configurations differed in wing span with span to body diameter ratios of 1.25, 1.5 and 1.75
respectively. Regarding the analysis, the following conclusions can be drawn:
• The numerical simulations sufficiently represent the aerodynamic loads and lee side flow features of
• Despite large uncertainties in the experimental centre-of-pressure positions at low angles of attack, the
CFD and experimental centre-of-pressure positions showed very similar trends and good correlation of
data at angles of attack above 6 degrees for a significant portion of the test range.
• The lateral vortex positions do not vary significantly for the span to body diameters ratios of 1.5 and
1.75
• Vortex separation of the side edge vortex occurs due to the growth of the body-wing junction secondary
vortex and is dependent on the span to body diameter ratio
Acknowledgments
The authors would like to thank the CSIR for providing the resources and funding for the wind tunnel tests and
computational simulations. A special thanks to Mr. Mauro Morelli for his guidance as well as Mr. Robert Mokwebo
and Mr. Cannon Mkhwanazi for assisting with the wind tunnel tests.
References
1. Tuling, S, Dala, L. and Toomer, C.An Engineering Method for Modeling the Interaction of Circular Bodies and Very Low Aspect Ratio Cruciform Wings at Supersonic Speeds. AIAA Conference Proceedings, 2013.
2. Nielsen, J. N.Missile Aerodynamics. USA : NEAR, Inc., 1988.
3. Spahr, J. R..Theoretical Prediction of the Effects of Vortex Flows on the Loading, Forces and Moments of Slender Aircraft. 1961. NASA TR R-101.
4. Marshall, F. J. and Deffenbaugh, F. D. Separated flow over bodies of revolution using an unsteady discrete-vorticity cross wake. 1974, NASA CR-2414.
5. Mendenhall, M. R. and Perkins, S. C., Jr. Vortex Cloud Model for Body Vortex Shedding and Tracking. [ed.] Micheal J. Hemsch and Jack N. Nielsen. Tactical Missile Aerodynamics. AIAA, 1986, Vol. 104 of Progress in Astronautics and Aeronautics.
6. Jorgensen, L. H..Prediction of Statc Aerodynamic Characteristics for Slender Bodies Alone and with Lifting Surfaces to Very High Angles of Attack. Ames Research Center. 1977. NASA-TM-X-73,123.
7.Hemsch, M. J.Semi-empirical methods for conventional and unconventional missiles. PRC Kentron. Hampton, Virginia.
8. Mendenhall, M.R. and Lesieutre, D.J. Predicted Vortex Shedding from Circular and Noncicular Bodies in Supersonic Flow. NASA CR-3754, 1984.
9. Allen, H. J. and Perkins, E. W. A Study of Effects of Viscosity on Flow over Slender Bodies of Revolution.
NACA Technical Reports 1048, 1951.
10. Hopkins, E. J. A semiempirical method for calculating the pitching moment of bodies of revolution at low Mach numbers. 1951, NACA RM A51C14.
11. Hemsch, M. J. and Nielsen, J. N. Equivalent Angle of Attack Method for Estimating Nonlinear Aerodynamics of Misile Fins. Journal of Spacecraft and Rockets, 1983, Vol. 20.
12. Hemsch, M. J. and Nielsen, J. N.Equivalent Angle of Attack Concept. Tactical Missile Aerodynamics. New York : American Institute of Aeronautics and Astronautics, 1986, pp. 487-518.
13. Simpson, G. M. and Birch, T. J..Some Aerodynamic Characteristics of Missiles Having Very Low Aspect Ratio Wing. AIAA, AIAA 2001-2410, 2001.
14. Tuling, S., Dala, L. and Toomer, C. Two-dimensional potential method simulations of a body-strake configuration. Journal of Spacecraft and Rockets, 2013.
15. Tuling, S..An Engineering Method for Modeling the Interaction of Circular Bodies and Very Low Aspect Ratio Cruciform Wings at Supersonic Speeds. Faculty of Environment and Technology, University of the West of England. Bristol, 2012. PhD. Thesis.
16. Arevalo-Campillos, M. A., et al. Experimental study of very low aspect ratio wings in slender bodies. Nantes : Proceedings of ASME 2012 11th Biennial Conference on Engineering Systems Design and Analysis, 2012.
17. Assessment of Experimental Uncertainty With Application to Wind Tunnel Testing. American Institue of Aeronautics and Astronautics, AIAA-S-071A-1999.
18. Ericcson, L.E. and Reading, J. P. Asymmetric Vortex Shedding from Bodies of Revolution. Tactical Missile Aerodynamics. American Institue of Aeronautics and Astronautics, Inc, 1986.
19. Degani, D. Numerical investigation of the origin of vortex asymmetry. AIAA Paper90-0593, 1989.
20. Degani, D., Schiff, L. B. Numerical Simulation of the Effect of Spatial Disturbances on Vortex Asymmetry.
21. Tuling, S., Dala, L. and Toomer, C.Lee Side Flow Structures of Very Low Aspect Ratio Cruciform Wing-Body Configurations. Journal of Spacecraft and Rockets, 2013, Vol. 50.
22. Mendenhall, M. R. Predicted vortex shedding from noncircular bodies in supersonic flow. Journal of Spacecraft and Rockets, 1981, Vol. 18, pp. 385-392.