Supplemental Material
Table S1. Descriptive Characteristics of Parents from SALSA and NLDS (n=286) and Their Non-Pregnant Adult Offspring in NLDS (n=395) with Metabolic Syndrome and Obesity Information, Stratified by Parental Location of Education
Overall US-Educated
Parent
Foreign-Educated Parent
Parents N Mean (SD) or % N Mean (SD) or % N Mean (SD) or %
Covariates Age (years) 286 68.9 (7.8) 165 68.5 (8.2) 112 69.0 (7.0)
Gender 286 165 112
Male 36.4 34.6 39.3
Female 63.6 65.5 60.7
Country of Birth 286 165 112
United States 53.5 92.7 -
Mexico 41.6 7.3 88.4
Other 4.9 - 11.6
Location of Education 286 165 112
United States 59.6 100 -
Both/uncertain 2.9 - 7.1
Mexico 37.6 - 92.9
Socioeconomic Position
Educational Attainment (years) 286 165 112
≤ 4 24.1 7.9 48.2
5-10 34.6 33.9 33.9
11-12 17.1 24.9 6.3
13-14 12.2 16.4 6.3
≥15 11.9 17.0 5.4
Adult Children N Mean (SD) or % N Mean (SD) or % N Mean (SD) or %
Covariates Age (years) 392 53.1 (11.8) 239 53.8 (11.8) 145 51.6 (11.4)
Gender 395 239 145
Male 37.0 34.7 41.4
Female 63.0 65.3 58.6
Country of Birth 395 239 145
United States 76.0 96.2 46.9
Mexico 21.3 3.8 46.2
Other 2.8 - 6.9
Location of Education 395 239 145
United States 80.3 97.1 55.6
Both/uncertain 9.7 2.9 20.4
Mexico 10.0 - 23.9
Socioeconomic Position
Educational Attainment (years) 395 239 145
≤ 4 2.0 0.8 4.1
5-10 9.9 3.8 17.9
11-12 21.8 24.7 17.9
13-14 28.6 30.5 25.5
≥15 37.7 40.2 34.5
Intergenerational Educational
Mobility
395 239 145
Stable High 26.8 26.4 26.2
Upwardly Mobile 16.7 15.9 19.3
Downwardly Mobile 27.6 27.2 27.6
Stable Low 28.9 30.5 26.9
Health Outcome Metabolic Syndrome 395 239 145
MetS
*51.1 50.6 51.0
Abdominally Obese and 0-1
Elevated Subcomponents 32.4
36.4
25.5
Not Abdominally Obese 16.5 13.0 22.8
Obesity (BMI ≥ 30) 395 239 145
Obese 51.7 52.7 51.0
Not Obese 48.4 47.3 49.0
*
MetS, metabolic syndrome, defined by the IDF as having abdominal obesity and at least two elevated subcomponents
†
Elevated per the IDF definition of MetS
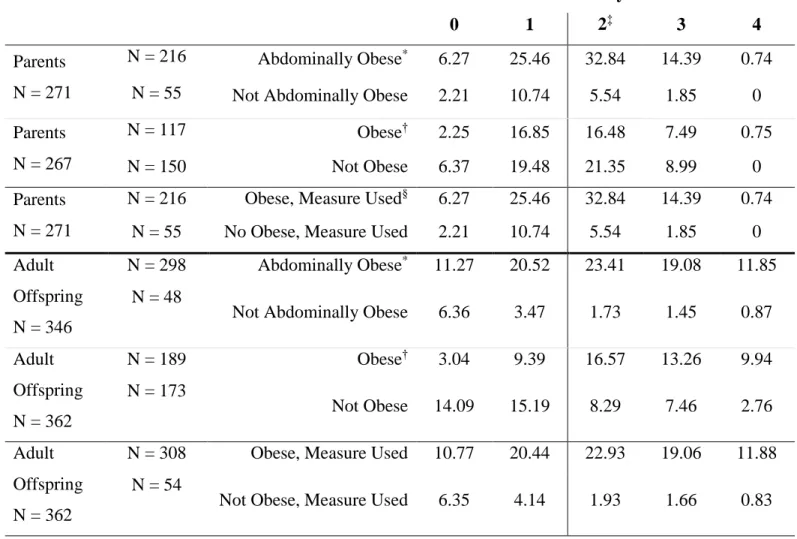
Table S2. Distribution of Elevated Subcomponents by Obesity Measure for Parents and Adult Offspring
*
Waist circumference ≥ 80 cm for women or ≥ 94 cm for men
†
Body Mass Index ≥ 30 kg/m
2‡
At least two elevated subcomponents required for classification of metabolic syndrome
§
Measure of obesity used in analysis; obesity (BMI ≥ 30) used if no waist circumference measurement available.
Number of Elevated Subcomponents of Metabolic Syndrome
0 1 2
‡3 4
Parents N = 271
N = 216 Abdominally Obese
*6.27 25.46 32.84 14.39 0.74 N = 55 Not Abdominally Obese 2.21 10.74 5.54 1.85 0 Parents
N = 267
N = 117 Obese
†2.25 16.85 16.48 7.49 0.75
N = 150 Not Obese 6.37 19.48 21.35 8.99 0
Parents N = 271
N = 216 Obese, Measure Used
§6.27 25.46 32.84 14.39 0.74 N = 55 No Obese, Measure Used 2.21 10.74 5.54 1.85 0 Adult
Offspring N = 346
N = 298 Abdominally Obese
*11.27 20.52 23.41 19.08 11.85 N = 48
Not Abdominally Obese 6.36 3.47 1.73 1.45 0.87 Adult
Offspring N = 362
N = 189 Obese
†3.04 9.39 16.57 13.26 9.94
N = 173
Not Obese 14.09 15.19 8.29 7.46 2.76 Adult
Offspring N = 362
N = 308 Obese, Measure Used 10.77 20.44 22.93 19.06 11.88 N = 54
Not Obese, Measure Used 6.35 4.14 1.93 1.66 0.83
Table S3. Percent Change Compared to the Stable Low Referent and 95% Confidence Intervals for Quantitative Measures of Metabolic Syndrome Subcomponents by
Intergenerational Educational Mobility Category and Sex
Intergenerational Educational Attainment MetS
Subcomponents
Stable High Upwardly Mobile Downwardly Mobile Model 1
*BMI -8.38 (-13.62, -2.81) -8.01 (-14.28, -1.28) -2.25 (-8.14, 4.00) Female -11.49 (-17.24, -5.32) -10.74 (-18.78, -1.89) -4.31 (-11.48, 3.43)
Male -5.44 (-12.98, 2.76) -5.58 (-14.66, 4.46) 0.14 (-8.40, 9.47) WC
‡-6.52 (-10.34, -2.52) -6.23 (-11.17, -1.00) -1.05 (-5.18, 3.26) Female -8.46 (-13.06, -3.62) -9.93 (-16.38, -2.98) -1.90 (-7.03, 3.52) Male -4.25 (-9.77, 1.62) -1.99 (-8.52, 5.01) 0.18 (-6.21, 7.00) SBP -5.29 (-8.82, -1.64) -5.17 (-9.09, -1.09) -0.56 (-4.17, 3.20) Female -4.43 (-8.86, 0.21) -5.71 (-10.65, -0.49) -0.24 (-4.74, 4.49) Male -7.13 (-13.47, -0.33) -4.26 (-11.57, 3.66) -1.12 (-7.87, 6.12) DBP -3.04 (-7.17, 1.26) -3.82 (-7.81, 0.35) 1.43 (-2.75, 5.80) Female -0.86 (-6.18, 4.76) -3.00 (-7.96, 2.21) 1.92 (-3.10, 7.19) Male -6.29 (-12.79, 0.68) -4.30 (-10.97, 2.87) 0.44 (-6.40, 7.79) HDL
‡5.14 (-1.64, 12.38) 9.79 (2.21, 17.93) -4.31 (-10.68, 2.51)
Female 8.31 (-0.50, 17.89) 13.36 (2.56, 25.31) -4.03 (-11.52, 4.09) Male 0.96 (-8.97, 11.99) 4.67 (-5.70, 16.17) -4.72 (-15.24, 7.43) FG -6.18 (-13.58, 1.86) -8.03 (-17.05, 1.96) 0.49 (-8.68, 10.58)
Female -2.62 (-7.91, 2.97) -3.26 (-12.13, 6.51) 7.07 (1.81, 12.59) Male -9.77 (-20.44, 2.33) -16.72 (-25.70, -6.67) -8.05 (-19.63, 5.21) TG -10.93 (-22.93, 2.95) -12.42 (-27.52, 5.83) -1.68 (-16.10, 15.25)
Female -5.11 (-19.94, 12.46) -2.71 (-23.28, 23.54) 8.51 (-9.43, 30.02) Male -22.02 (-40.69, 2.54) -17.91 (-37.71, 8.19) -12.02 (-34.35, 17.90)
Model 2
†BMI -9.25 (-14.58, -3.59) -8.52 (-14.85, -1.72) -2.90 (-8.89, 3.49)
Female -11.49 (-17.24, -5.32) -10.74 (-18.78, -1.89) -4.31 (-11.48, 3.43)
Male -7.65 (-15.18, 0.54) -5.34 (-14.61, 4.92) -1.28 (-9.69, 7.91) WC
‡-7.13 (-11.03, -3.07) -6.67 (-11.62, -1.44) -1.75 (-5.90, 2.58) Female -8.42 (-13.16, -3.44) -10.08 (-16.58, -3.08) -1.93 (-7.23, 3.68) Male -5.99 (-11.32, -0.35) -2.41 (-8.80, 4.41) -1.29 (-7.44, 5.26) SBP -6.43 (-10.08, -2.63) -5.58 (-9.53, -1.46) -0.62 (-4.28, 3.16) Female -5.22 (-9.94, -0.25) -5.85 (-10.93, -0.48) 0.00 (-4.74, 4.98) Male -8.74 (-15.21, -1.77) -4.29 (-11.64, 3.67) -1.06 (-7.88, 6.27) DBP -4.09 (-8.30, 0.30) -4.43 (-8.38, -0.30) 1.18 (-2.94, 5.46) Female -2.07 (-7.58, 3.78) -3.63 (-8.59, 1.59) 1.51 (-3.44, 6.72) Male -2.42 (-8.56, 4.13) -0.70 (-7.65, 6.79) 0.44 (-6.40, 7.79) HDL
‡7.09 (0.16, 14.50) 10.89 (3.18, 19.20) -3.83 (-10.21, 2.99)
Female 8.89 (-0.31, 18.94) 13.55 (2.72, 25.5) -4.33 (-12.03, 4.03) Male 4.19 (-5.68, 15.08) 6.07 (-4.32, 17.59) -4.47 (-15.24, 7.68) FG -5.83 (-13.34, 2.34) -8.27 (-17.01, 1.38) 0.07 (-9.09, 10.16) Female -1.52 (-6.96, 4.23) -3.09 (-11.33, 5.91) 5.36 (0.51, 10.43)
Male -12.47 (-22.89, -0.65) -17.57 (-26.38, -7.72) -8.70 (-20.20, 4.45) TG -13.15 (-24.81, 0.32) -15.48 (-29.74, 1.67) -5.15 (-19.08, 11.17)
Female -5.12 (-20.51, 13.24) -4.58 (-24.02, 19.83) 6.39 (-11.88, 28.44) Male -25.71 (-42.08, -4.72) -21.24 (-39.32, 2.22) -15.37 (-36.42, 12.66)
*
Adjusted for age, age
2, and sex
†
Adjusted for age, age
2, sex, and the location of education of parents and adult children
‡