-The
Economic and Social
Research Institute
IRISH PUBLIC DEBT
RICHARD BRUTON
THE ECONOMIC AND SOCIAL RESEARCH INSTITUTE COUNCIL 1977- 1978
*T. K. WHITAKER, M.SC. (ECON.), D.ECON.SC., LL.D., President of the Institute. *J. F. MEENAN, M.A., B.L., Chairman of the Council.
R. D. C. BLACK, PH.D., Professor, Department of Economics, The Queen’s University, Belfast.
F. B. CHUBB, M.A., D.PHI L.. Professor, Department of Political Science, Trinity College, Dublin.
N. J. GIBSON, B.SC. (ECON.), PH.D., Professor, Department of Economics, The New University of Ulster, Colemine.
PATRICK A. HALL, B.E., M.S., DIP. STAT., Director of Research, Institute of Public Administration.
*W. A. HONOHAN, M.A., F.I.A.
THE MOST REV. JAMES KAVANAGH, M.A., S.T.L., Bishop of Zerta.
*KIERAN A. KENNEDY, M.ECON.SC., B.PHIL., PH.D.,Director of the Institute. IVOR KENNY, M.A., Director General. Irish Management Institute.
MICHAEL J. KI LLEEN, B.A. (MOD.), B.COMM., D.P.A., Managing Director. Industrial Development Authority.
T. P. LINEHAN, B.E., B.SC., Director, Central Statistics Office.
*P. LYNCH, M.A., M.R.I.A., Professor of Political Economy, University College, Dublin. CHARLES MCCARTHY, B.L., Chairman, Human Sciences Committee.
EUGENE MCCARTHY, M.SC. (ECON.), D.ECON.SC., Federated Union of Employers. *M. D. MCCARTHY, M.A., PH.D., D.SC.
G. A. MEAGHER, B.COMM., D.P.A., Secretary, Department of the Environment. *C. H. MURRAY, LL.D., Governor, CentralBank.
J. C. NAGLE, M.COMM.
D. NEVIN, Assistant General Secretary, Irish Congress of Trade Unions. THE MOST REV. J. NEWMAN, M.A., D.PH., Bishop of Limerick. TADHG (5 CEARBHAILL, Secretary, Department of Labour.
REV. E. F. O’DOHERTY, M.A., B.D., PH.D., Professor, Department of Logic and Psychology, University College, Dublin.
D. P. O’MAHONY, M.A., PH.D., B.L., Professor, Department of Economics, University College, Cork.
LABHRAS 6 NUALLAIN, D.ECON.SC., Professor of Economics, University College, Gahvay.
*W. J. L. RYAN, M.A., PH.D., Professor of Political Economy, Trinity College, Dublin. REV. L. RYAN, M.A., D.D., L.PH., Professor, St. Patrick’s College, Maynooth.
T. WALSH, D.SC., Director, An Foras Tal6ntais.
*REV. C. K. WARD, B.A., S.T.L., PH.D., Professor, Department of Social Science, University College, Dublin.
*NOEL WHELAN, B. COMM., M.ECON.SC., PH.D., Secretary, Department of Economic Planning and Development.
IRISH PUBLIC DEBT
Copies of this paper may be obtained from The Economic and Social Research Institute (Limited Company No. 18269) Registered Office:
4 Burlington Road. Dublin 4.
Price £4.50
IRISH PUBLIC DEBT
RICHARD BRUTON
©THE ECONOMIC AND SOCIAL RESEARCH INSTITUTE DUBLIN, 1978
ISBN0 70700016 5
Acknowledgements
Many people have helped me along in preparing this paper. I would like to thank them all. 1 should particularly mention Richard Vaughan, Eamon Henry and Brendan Dowling of the ESRI; and Michael Casey, Ciaran Cassidy and Padraig McGowan of the Central Bank; who gave painstaking comments on earlier drafts. My greatest debt of all is due to Professor Kieran Kennedy of
Chapter I Chapter 2 Chapter 3 Chapter 4 Chapter 5 Chapter 6 CONTENTS General Summary Introduction
Public Borrowing and Long-term Development
Public Borrowing and Private Investment 11 Saving Investment and Foreign Inflow
111 Public Investment - Financing and Distribution IV Conclusion
Public Borrowing and Stabilisation
The Principles of Stabilisation Policy 11 The Irish Experience
111 Conclusion
The Stock of Public Debt
Public Borrowing and Public Debt I1 The Level of Debt and of Assets
I11 The Effect of Inflation on Public Debt IV The Structure of Public Debt
V Foreign Debt
VI Holders of Public Debt VII Summary
The Service of Public Debt
hlterest and Repayment of Debt 11 Debt Service and Public Finance
111 The Cost of Foreign Debt
IV Service of External Liabilities and the Balance of Payments
V Summary
Management of the Public Debt
Short-run Management of the Economy I1 Financing the Exchequer and Fostering Irish
Financial Markets
Recent Developments
Public Borrowing II Debt and Debt Service
Chapter 7
Appendix
Concluding Remarks
The Goals of Public Borrowing 11 Reliance on Overseas Capital
111 Carrying the Public Debt
Comparative Debt Situations
Page
73
73 74 75
79
Selected Bibliography
Table l.] 1.2(a) 1.2(b) 1.3(a) 1.3(b) 1.4 1.5 3.1 3.2 3.3 3.4 3.5 3.6 3.7
LIST OF TABLES
Resources for Domestic Physical Capital Formation, Public Foreign Borrowing and Capital Spending: Average of Annual Ratios to GNP, Various Periods.
Ratio of Net Capital In flow and of the Deficit in the Current Balance of Payments to Gross Physical Capital Formation.
Composition of the Net Capital Inflow.
Public Capital Spending: its Annual Average Real Rate of Growth; Average Ratio to Gross National Product, and Average Share in Gross Domestic Physical Capita[ Formation.
Distribution of Public Capital Spending by Type.
Functional Distribution of Public Capital Spending.
Sources of Finance for Public Capital Spending.
Public Net Borrowing: its Distribution among Various Sources, and its Ratio to Gross National Product.
Total Public Debt: its Annual Average Growth Rate; its Absolute Level; its Ratio to Gross National Product.
Outstanding Public Debt in 1975 and the Accumulated Real Value of Public Capital Spending over Twenty Years.
Composition of Total Public Debt.
Maturity Structure of Domestic Marketable Debt.
Ratio of Public Foreign Debt at Current Exchange Rates to Total Debt; Gross National Product; and the Irish Pound Value of Official Foreign Exchange Reserves.
Page 22 24 24 28 29 30 32 39 41 43 45 45 47
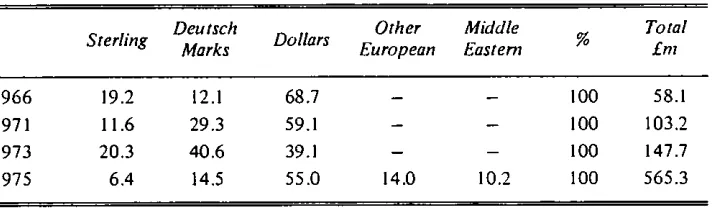
Currency Composition of Outstanding Public Foreign Debt
Table Page
3.8
3.9
4.1
Distribution of the Sterling Value of Exchequer Foreign Debt at Current Exchange Rates According to the Period it Falls Due for Repayment.
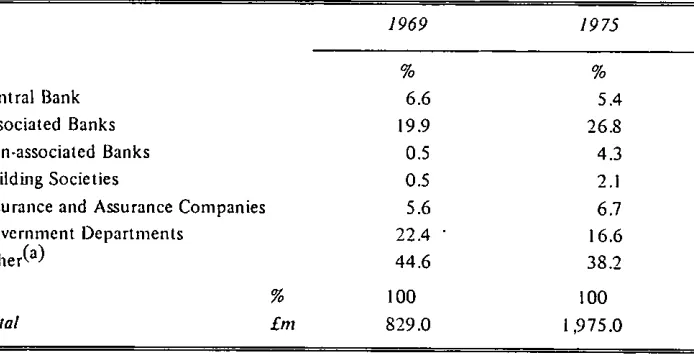
Holders of Domestic Debt.
Nominal Rate of Interest and Rate of Redemption of the Total Public Debt; Nominal and Real Rate of Interest of
Domestic Debt.
49
49
52
4.2
4.3
4.4
4.5
4.6
6.1(a)
6.1(b)
6.2
6.3
6.4
Ratio to Public Current Tax Revenue of(a) Nominal Interest on Total Debt; (b) Net Trading and Investment Income and Interest Chargeable to Taxation; (c) Redemptions; (d) Depreciation and RedemptiQns
Chargeable to Taxation. 55
Ratio to Gross National Product of Nominal Interest less Net Trading and Investment Income; Redemptions less
Depreciation; and of Total Taxation. 56
Foreign Debt: Nominal Rate of Interest, Ratio of Annual Exchange Loss and of Total Real Annual Cost to Outastanding Foreign Debt. 58
Cumulative Unrealised Exchange Loss since Issue on the
Outstanding Public Foreign Debt Various Years. 59
Foreign Debt: Ratio of Interest and Repayments to
Exports of Goods and Services. 60
Resources for Domestic Physical Capital Formation:
Ratios to GNP. 67
Total Net Inflow of Foreign Capital: Ratio to Gross and to Net Domestic Physical Capital Formation. 68
Central Government Capital Spending: Sources of Finance for it; its Share in Gross Domestic Physical Capital
Formation. 68
Ratio of Foreign Debt (at Current Exchange Rates) to Official External Reserves and Ratio of Foreign, Domestic and Total Public Debt to GNP.
Financial Costs of Public Debt and its Components.
70
Table
A.I
A.2
A.3
APPENDIX TABLES
Central Government Debt Ratios.
Ratio of Government Net Borrowing and of Government Capital Spending to Total Government Spending. Ratio of Public Debt Interest to Government Revenue (Averages
1969-74).
Ratio of Net Foreign Disinvestment (-) to Gross Fixed Capital Formation (1969/74) Incremental Capital Output Ratio (I 970/74).
Page
80
81
General Summary
F
~OR long, public debt was a topic of debate only among financial experts. From time to time, bankers came out with stern warnings about govern-ment borrowing, but these were usually tucked out of sight on an inside page of the newspaper. However, in the general election campaign of 1977, ¯ the public were confronted with opposing arguments about the degree to which the government could safely borrow and expand the public debt. Many people found it difficult to form an independent view of the merits of the opposing arguments. This paper seeks to shed light on the whole issue of public borrowing and debt.Borrowing and Debt
There are three ways in which the government can pay for its spending: by taxation, by charging prices for the services it provides, or by borrowing¯ Public debt is simply the accumulation of past borrowing net of repayments. When the government increases its borrowing, the economy will generally have to lean that much more heavily on foreign funds. This happens even if the government borrows at home. In that case, the banks bring in money from abroad to prevent its prime borrowers having to go short.
The amount a government can safely borrow ultimately depends on the use made of the funds. The spending should raise the economy’s productive capacity by at least enough to pay interest and principal to the foreign financier.
Although this seems a quite straightforward rule, successive governments since 1972 have failed to abide by it. During those years, governments borrowed to finance consumption of one sort or another. This form of spending created deadweight debt in the sense that the cost of servicing it was not matched by a contribution to national product.
In the last year there has been an intensification of this practice¯ Urgent demands for jobs persuaded the government to increase current spending, financed temporarily from borrowing. However, the taxpayer may not be in a comfortable position to shoulder the full cost of this spending in the near future¯ Tax increases and cut-backs in public spending seem to be in prospect. The brunt of spending cuts will probably be felt most in private sector em-ployment and living standards as the government tries to sustain employ-ment and pay levels in the public service.
Of course, much government borrowing has been for capital purposes. This spending continues to yield a benefit to the community, and in this
12 THE ECONOMIC AND SOCIAL RESEARCH INSTITUTE
sense it is self-financing. In the last thirty years, the state has played a major role in encouraging and financing capital formation. The public capital programme has been at the centre of economic plans. Nevertheless, the whole approach to public investment has been haphazard. Too often, invest-ment was ruthlessly cut in reaction to fears of excessive demand. No govern-ment has evaluated the prospective returns from its investgovern-ments systematically, even though this is the very least t’hat a prudent bank manager would ask of any ordinary borrower.
Debt Service
All borrowing carries an obligation to pay interest and ultimately repay the debt. Public investment usually yields little direct revenue to the govern-ment because much of it goes in grants or in the building of roads, hospitals, schools and houses. The government has seldom tried to earn income by charging prices for these services. It means that payment to the government’s creditors must be found from taxation. Thus, public debt is a redistributive factor in society touching on those who pay the servicing costs and on those who hold the debt. Resistance to the redistributive effects of debt is one
force that could constrain the government’s borrowing.
Since debt has now climbed to over three-quarters of Gross National Product, the charge on taxation has become quite formidable. Debt service as a proportion of central government tax revenue now amounts to 20 per
cent. It brings it home to the taxpayer that public borrowing is by no means a painless system of financing government. Borrowing lifts troubles from the taxpayer’s mind for a time, but the charge for the debt returns to plague him shortly afterwards.
None the less, inflation has greatly lightened tile real burden of servicing the debt over the years. It has inflicted serious loss on people who put their savings into government debt. Slower inflation becomes a mixed blessing for governments. It may be popular with many sections of the electorate, but it creates some headaches for public finance. The cheapness of debt almost certainly tempted governments to borrow more and to use borrowing less prudently during the past ten years of rapid inflation.
Foreign Debt
IRISH PUBLIC DEBT 13
has now become a debtor nation for the first time. A better watch on its own investment and debt policy is the first step in carrying out this respon-sibility. Government foreign borrowing has the particular feature that cur-rency depreciation can raise the burden on domestic resources. This feature is examined in some detail in the text.
Debt in Perspective
The paper devotes considerable space to tracing the evolution of public foreign and domestic debt, and of the cost of carrying the debt in post-war Ireland. It describes the events surrounding this development, and looks at what may happen ill the years ahead. Some of this discussion will be of greater interest to the student of public finance. However, many of the problems are perennial and of mounting public concern. Public debt is now larger relative to income in Ireland than in almost any other western country. At the same time, rapidly growing population will put very heavy demands on all types of government service in the years ahead. The way tile government uses borrowing to finance tile public sector will have a big influence on tile economy’s ability to cope.
Introduction
SINCE the war, the State has played a major role in promoting capitalformation in Ireland. This has been one of the main forces behind the
growth of public debt. In more recent years, new forces have been at work: a concern to provide public goods to a wider section of the community and the government’s response to external deflation have added impetus to the growth of debt. A study of public debt policy will inevitably become inter-twined with much broader objectives of policy. However, close examination appears to be timely in view of the growing public concern about Ireland’s external liabilities and the government’s current budget deficits.
Public borrowing has a particular beating on the allocation of resources for development and the short-run stabilisation of the economy. The first and second chapters discuss these issues in turn. The first chapter addresses the questions: how much should the government borrow; what should bor-rowed funds be used for; and should the government borrow at home or abroad? The present over-riding concern to provide employment opportunities for a growing population makes the answers all the more urgent. The second chapter explores whether these answers should be modified during a recession or boom in order to stabilise the economy.
The following three chapters pass from borrowing (the flow addition to debt) to the stock of debt itself. The third chapter gives an overview of the existing public debt. The fourth chapter focuses on the financial cost of carrying domestic and foreign debt; and the fifth chapter looks at manage-ment of the structure of public debt. Recent developmanage-ments in public borrow-ing and debt are reviewed in the sixth chapter. Then in a final chapter, the various strands of argument are brought together and some conclusions are drawn.
Chapter 1
Public Borrowing and Long-term Development
T
HIS chapter is divided into three sections. The first looks at the impact on the economy of public borrowing as an alternative to taxation. Following on from this, the second examines what bearing public borrowing policy has on long-term development strategy. Finally, the third section de-scribes the reasons public action to influence investment is necessary and studies the composition and the finance of pubfic capital spending. Each section has separate parts dealing with the principles involved and then examining the actual experience over the last thirty years.1 PUBLIC BORROWING AND PRIVATE INVESTMENT
In a fully-employed and closed economy, government borrowing will reduce private investment at least in the short run. Taxation and borrowing both force private demand to make room for government spending. Taxation hits private disposable income and an immediate fall in consumption follows. Borrowing reduces loanable funds available to private borrowers and invest-ment feels the immediate impact. The ultimate effects of borrowing rather than taxing are less clear. They hinge on the general public’s attitude to the future tax liability implied by borrowing. If it does not foresee the tax liability thus regards government bonds on all fours with real wealth -then the impact effect on private investment remains. If the public does foresee the taxes, then the immediate drop in investment will be compensated to the extent that extra saving is undertaken to meet the liability in the future. In principle, if capital markets worked perfectly, the form of govern-ment finance would have no effect on the composition of private demand.
However, in practice even if foresight is clear, full provision will not be made for future tax liabilities. Many people would prefer to worry about the taxes when the future comes, or would be quite happy to have their heirs pay the taxes. By and large, therefore, borrowing instead of taxing reduces private investment in a closed economy but probably by less than an equal amount.
In a pure example of a small open economy - facing fixed foreign ex-change prices in goods and capital markets - the impact of borrowing
18 THE ECONOMIC AND SOCIAL RESEARCII INSTITUTE
stead of taxing is to increase the current account deficit of the balance of payments. Private borrowers have no difficulty getting funds and so private investment is not affected. The counterpart of a biggerpayments deficit is a rise in the country’s net external liabilities. The ultimate effect again hinges on wbether provision is made for the future external liability. Usually little provision will be made and so the effect on net external liabilities remains. So long as private investors have easy access to funds from abroad the story is no different whether or not the government directly borrows abroad itself.
The difference between open and closed economies lies in the sort of asset displaced by public borrowing. The private capital stock takes the knock in the closed economy; in the open economy it is the country’s external credit position. The effects will be mixed in economies falling between the two extremes.
Ireland fits the description of a small open economy quite closely. Goods flow without restriction to and from the outside world. The tradeables sec-tor amounts to roughly 40 per cent of GNP. The foreign exchange price of traded goods is largely beyond domestic control. Financial flows are also largely unrestricted and interest rates follow those prevailing in London money markets. Accordingly, borrowing to finance government spending should not greatly impair private investment. It should be sustained by an inflow of real resources causing a current balance of payments deficit and matched by an inflow of foreign capital to provide the extra Ioanable funds.
Dowling (1974) found evidence supporting this belief. He fitted the equation :
[G - TI = /31 [1 - S] + t32 IX -MI
government borrowing private sector surplus external surplus
IRISH PUBLIC DEBT 19
both private and public borrowing froln the banks outran the growth of the latter’s domestic assets throughout the 1960s. As a result, the banks moved
from a net external asset holding equal to 38 per cent of domestic assets at the beginning of the 1960s to a net liability of 8.7 a decade later. It has plateaued at about this level during the 1970s.
In the years ahead, the economy will probably continue the trend towards greater trading openness. However, there is a danger that if the government continues to rely on domestic banks for funds to the extent it has in the past, then small native enterprises may be starved of funds. They rely almost exclusively on the banks for finance, neither borrowing abroad directly nor raising finance by equity issue. The banks may be unable or unwilling to increase their net external liability much further to facilitate them. More-over, because of the lower risks involved, tile Irish banks would be more likely to satisfy large companies or state boards in tight domestic credit conditions. Thus, to avoid impairing private investment in the future the government will have to exercise care in the form its borrowing takes. This explains and offers some justification for the step-up in direct public borrowing abroad in the recent past.
11 SAVING, INVESTMENT AND FOREIGN INFLOW
Background
The level of current investment decides future consumption. In tile fully-employed closed economy, saving and investment are equal. An optimal social savings programme is one where the resulting path of consumption can-not be improved upon according to some yardstick of welfare. Forsimplieity, consumption in all periods (generations) is often equally valued but dis-counted by a rate that represents "social" impatience. The optimal savings plan then depends on the social discount rate and on how sensitive the bene-fit of increased consumption is to changes in tile overall level of consumption. This focuses social choice on two key variables (impatience and the desire for stability in consumption) but tile need to make a choice is not eluded. Tile theoretical approach to optimum saving emphasises that the question "Is saving too low?" can only be answered when distributional choices between generations as well as an assessment of returns to investment are made.
The question of how the optimal level of social saving is chosen will be passed over here. However, if saving is too low the government can take direct action to increase it by raising taxes in excess of public consumption spend-ing. If saving is deemed too high, public borrowing to finance government current spending is appropriate.
20 THE ECONOMIC AND SOCIAL RESEARCH INSTITUTE
marginal cost of borrowing funds abroad. However, this is not an easy guide
to the optimum net capital inflow. The marginal costs of foreign capital include the disadvantage of further foreign ownership or foreign influence as well as direct investment incomes that must be paid. The pattern of these costs differ among the different forms of capital inflow (e.g., direct private foreign investment versus public borrowing abroad). It is often hard to assess other matters that also bear on the optimal flow. Foreign capital inflow may dampen domestic savings effort. Foreign investment may be completely different in kind to domestic investment and its marginal returns to the economy as a whole hard to reckon. Appraising all the costs and benefits is a complicated task. It is quite likely that private decisions will produce the wrong volume of net capital inflow, or strike the wrong balance between different types of inflow. In that event, government action restraining or promoting foreign inflows are appropriate. The government’s own borrowing policy plays an important part in carrying this out. Its influence has already been seen in Section 1, and will become clearer in Section I11 when the use of borrowed funds is discussed.
Irish Experience
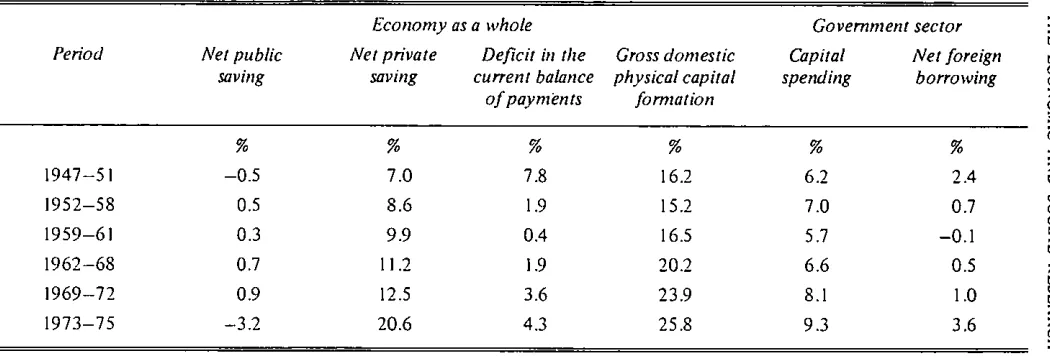
Table 1.1 focuses on the level of investment and the resources that finan-ced it in various sub-periods since 1947. After the war, the government welcomed a net inflow of foreign capital to expand domestic investment. Much of it was secured on easy terms by public borrowing under the Marshall Aid Reconstruction Programme. The rate of investment rose sharply from
13.5 per cent of GNP in 1947 to 21 per cent in 1951 (public capital spending rising from 3 per cent to 9.4 per cent of GNP). The resources were substan-tially provided through running a balance of payments deficit. The level of private saving remained low and the government reduced domestic contri-bution to investment resources by dissaving.
When Marshall Aid stopped flowing in 1951, the government became distinctly hostile to reliance on foreign finance. The foreign contribution to investible resources was cut sharply. The growth of investment ended abruptly, even though private saving had stepped up by then and the public sector was no longer dissaving. Public capital spending was pruned, and the rate of over-all investment in the economy stagnated until the end of the decade. This reversal does not fully show up in the table, because averaging over the period 1947-51 conceals the high investment rates achieved by 1951. The government bore a considerable measure of responsibility for the stagnation of investment. The slump wrought severe hardship, incomes grew slowly and heavy emigration occurred in search of work. Public policy came adrift in these years. The lack of some form of programme of priorities and targets for development was sorely felt.
IRISH PUBLIC DEBT 21
saving was believed undesirable, instead, tax concessions to encourage volun-tary privatesaving were envisaged. The attitude towards reliance on foreign resources relaxed. Direct investment by foreigners was seen as the most desirable form of inflow but an average reduction in official external reserves of £3.5 million per annum, and limited public foreign borrowing from inter-national institutions were more acceptable than sacrificing productive invest-ment opportunities for lack of resources. The programme showed recognition of the role of public capital spending in sustaining private demand. Although the need for public infrastructural investment was said to be on the decline, a switch of funds to support private productive capital spending was planned so that the level of public capital spending would be maintained.
As it turned out, the recovery of investment and income got under way in 1959-61 without any net support of foreign funds as Table 1.1 illustrates. Private saving expanded but public saving still remained tiny. In fact, the central government aimed at zero net saving by balancing the current budget in all years before 1972. The public savings which occurred were incidental rather than a deliberate, attempt to use the tax weapon to raise national saving. Public capital spending grew during the period of the programme, but it is not easy to know how important public measures were in stimulating
private investment.
A second Economic Programme was published in 1964. It envisaged a gentle rise in the rate of investment by 1970. Private domestic saving was to provide the bulk of the resources needed. An external contribution of 1.6 per cent of GNP was also planned as a temporary supplement. Direct foreign investment was actively encouraged through grants and tax relief. It was expected that direct foreign investment or external subscriptions to govern-ment loans would cover planned deficits, but if necessary direct governgovern-ment borrowing overseas or a run-down of official reserves would make up the short-fall. The programme emphasised the need for adequate demand and planned substantially higher public capital spending than during the first program me.
The table shows what actually occurred. The rate of investment, in fact, rose considerably higher than expected. More reliance was placed on foreign resources, some of it provided by direct public borrowing overseas. Even though there was no change of policy as regards public saving, it began to make a more noticeable contribution to investment resources. Despite heavy investment the target for employment (and to some degree for output) was not met affd the programme had to be abandoned in 1968.
Table 1.1 : Resources lbr domestic physical capital formation, public foreign borro wing and capital spending." average of annual
ratios to GNP, various periods
Economy as a whole Government sector
rn Period Net public Net private Deficit in the Gross domestic Capital Net foreign rn
¢3
saving saving current balance physical capital spending borrowing o
of payments formation z0
~e
% % % % ~ >
1947-51 -0.5 7.0 7.8 16.2 6.2 2.4
1952-58 0.5 8.6 1.9 15.2 7.0 0.7
~ J
1959-61 0.3 9.9 0.4 16.5 5.7 -0.1
t"
1962-68 0.7 11.2 1.9 20.2 6.6 0.5
r~
1969-72 0.9 12.5 3.6 23.9 8.1 1.0
1973-75 -3.2 20.6 4.3 25.8 9.3 3.6 t~
Source: National Income amJ Expenditure.
Note." Apart from the sources listed, the remaining resources for investment come from depreciation less an adjustment for
IRISH PUBLIC DEBT 23
/
Investment turned out to be slightly higher than expected. Heavy reliance was placed on foreign resources and a substantial portion of it was public external borrowing, apparently reluctantly undertaken. The Third Programme again failed to achieve its output and employment targets, and no programme replaced it in 1972. Many of the policies of the previous programmes were continued, but the balanced current budget rule was abandoned for the first time. The intention was that debt-financed public consumption would be used as a stimulus in recession and a current budget surplus (reducing the borrowing requirement for public investment) would restrain demand in an inflation.
The dramatic rise in oil prices at the end of 1973 had a big impact on saving and investment. Heavy investment in stocks brought a rise in the rate of investment in 1974, but it fell precipitously in 1975. Even though the rate of private saving reached exceptional heights in these years, net resources from abroad amounted to almost one-third of investment in 1974. However, virtually no foreign finance was needed in 1975. The breach in the rampart of balanced current budgets rapidly widened as the recession caught hold. Public dissaving mounted to 6.7 per cent of GNP in 1975. The next chapter will argue that short-tern1 stabilisation needs did not justify this. At all events, it was the first time fiscal measures deliberately influenced national saving. From the long-term standpoint it was in sharp contradiction to the repeated diagnosis of insufficient domestic investment. Present government statements suggest that this policy is to be continued even as the economy pulls out of recession. It is arguable that certain current spending, for example, on health and education yields future returns like an investment. However, they are expenditures that keep recurring. It would be conceivable to finance them by earmarking a certain portion of income tax receipts; which would repre-sent the benefits of past spending, but in practice this would work out broadly the same as financing them from current taxation. In either case, they are not acceptable candidates for debt-finance. Expanded productive output is recognised as the only basis for employment creation. Employ-ment to serve public consumption should only grow in accordance as the output base can bear it. This is precisely the rationale of balancing public consumption by tax revenue. The departure from the old precept is out of tune with a programme for development.
94 THE ECONOMIC AND SOCIAL RESEARCH INSTITUTE
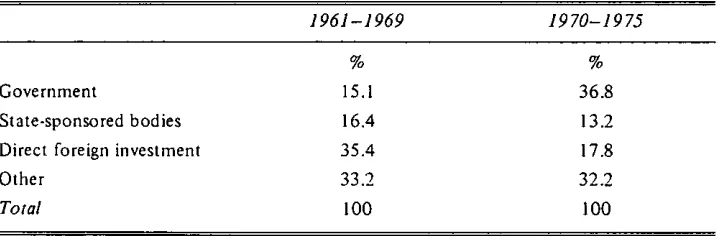
on foreign funds for investment than most countries at a similar stage of development. This remains true in the 1970s though other countries also stepped up reliance on foreign resources.
Table 1.2 (a): Ratio of net capital inflow and of the deficit in the current balance of payments to gross physical capital formation
As a proportion of investment: Period
Net inflow Current deficit
% %
1947-51 40.0 47.0
1952-55 8.9 6.9
1959-61 9.3 2.6
1962-68 13.8 9.2
1969-72 23.0 15.0
1973-75 25.2 15.2
Table 1.2 (b): Composition of the net capital inflow
1961-1969 1970-1975
% %
Government 15.1 36.8
State-sponsored bodies 16.4 13.2
Direct foreign investment 35.4 17.8
Other 33.2 32.2
Total 1 O0 1 O0
Source: Irish Statistical Bulletin; National Income and Expenditure.
[image:23.506.79.444.151.314.2] [image:23.506.80.439.341.459.2]IRISH PUBLIC DEBT 25
kets only commenced in 1965. They surged forward during the 1970s. This form of foreign inflow was always regarded with some misgivings because it was thought that small demand for Irish government debt would make such borrowing expensive. It was also disdained because it was an unalterable commitment to foreigners and brought in no foreign expertise. This attitude may now be changhlg. Autonomous foreign inflows have not proved ade-quate to cover desired deficits in recent years. Moreover, there have been sharp criticisms of the nature of direct foreign investment,a At the same time, the cost of funds directly borrowed abroad by the government has been low (see Chapter 4 below).
No attempt will be made here to pass a judgement on the appropriate pattern of foreign inflows. Many of the issues are still shrouded in uncertainty. In general terms, high reliance on foreign funds is reasonable in the throes of a development effort provided they are used to augment domestic invest-ment. However, tbis will not happen automatically. Great care is needed to see that they are not used to finance consumption or to ease domestic savings effort. Even then it cannot be regarded as a soft option. The road to secure full employment is an economy free from excessive external influence and must be won by domestic sacrifice. It would be a dangerous illusion to ex-pect rising living standards without a matching commitment to thrift, economy and integrity among all persons who earn their living in the country. Temporarily slower growth in per capita money incomes is needed to create employment opportunities and high domestic savings is needed to exploit these opportunities for employment.
I11 PUBLIC INVESTMENT - FINANCING AND DISTRIBUTION
Background
The task of public finance does not end with influencing the levels of domestic saving and foreign capital inflow. It must also be attentive to the type and overall amount of domestic investment undertaken. Many circum-stances call for public intervention to influence investment. Certain industries are natural monopolies and it is easiest to exercise control over them in the public interest by having government run them itself. The benefits of some types of investment are spread so wide that it will not be worthwhile for individuals acting on their own to undertake all socially worthwhile invest-ment opportunities. Roads and street-lighting are simple examples of this, but it extends to a wide variety of infrastructural investments. Occasionally, other problems hold back individuals from undertaking socially worthwhile
26 THE ECONOMIC AND SOCIAL RESEARCH INSTITUTE
investment. For example, particular projects may be too risky for an indivi-dual but the risks are pooled in a public programme;or there may be resources idle in the ecohomy but~i, private individual has to pay far more than their (zero) opportunity cost. t~ bring them into employment. Similar problems arise where individuals have to pay more for credit than the true marginal cost to the community. 1Mt of these cases can be brought together under the single heading of cases of private market imperfections calling for public intervention. In addition,.~public investment may be required in the interests of sustaining the level of;aggregate demand or to implement redistribution policies.
The government has three .ways of influencing investment. First, it may directly undertake an investment programme of its own. Secondly, it may provide grants for certain projects undertaken by investors or subsidies on particular resources involved. Thirdly, it may provide loans to specific private investors on terms more favourable than they can obtain elsewhere. One or other of these methods will be more appropriate depending on the reason for public intervention. Although it is easy to see that there is a need for some public intervention in investment in the sort of cases cited in the previous paragraph, choosing the optimal level of intervention is far less easy. The features that cause the private market to ignore certain social benefits of an investment often make it difficult for the government to put a value on these returns. Private market valuations of inputs and outputs do not correspond to social costs and benefits and, therefore, cannot be used to evaluate t-he investment. However, methods have been evolved for calculating "social" prices of resources and applying them to public investment decisions. Dis-cussion of them is beyond the scope of this paper)
The decision on the amount of public current revenue saved determines how government investment is financed. Part of its saving is depreciation: an allowance for the replacement of the depreciating public capital stock. The remainder, net public saving, is the government contribution to domestic investment resources. The other sources of public investment are capital taxation and public borrowing. Capital taxation is on the border between public saving and borrowing. Like saving, it may be paid by pruning private consumption; or alternatively it may be paid by pruning saving, forcing investors to look for external finance or go without. Net public borrowing follows as a residue from the decision on government investment and govern-metat saving. However, these decisions must take account of the effects of borrowing on the economy, so treating decisions sequentially is only for ease
of explanation.
Irish Experience
Throughout the past thirty years, the government has played a large part in financing and encouraging investment in Ireland. Its activities in this area
IRISH PUBLIC DEBT. 27
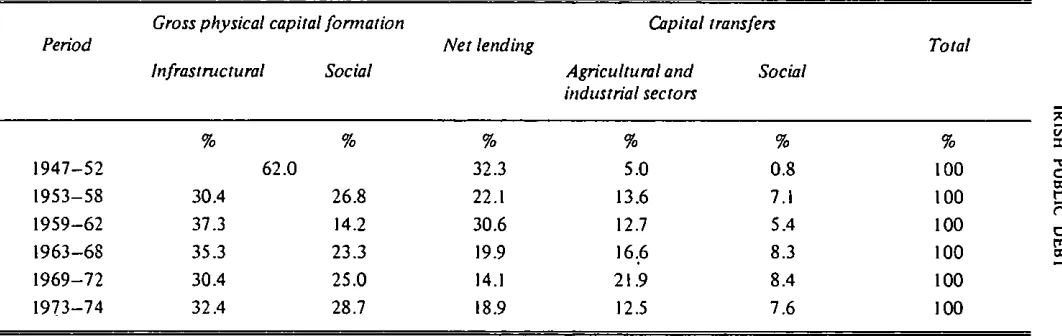
have been considerably greater than that of other European governments. Table 1.3 looks at how public capital spending evolved since 1947, and how it was divided between the government’s direct investment programme, its net lending and its investment grants and subsidies. A few words explaining these components may be useful. Public sector industries are independent bodies, so their investment does not figure in the government’s direct invest-ment. This is confined to social and infrastructural investments directly undertaken by the government (schools, hospitals, roads, and so on). At the same time, the government lends funds to these public industries to help finance their investment. None the less, the table understates total public investment activity to the extent that state bodies use other sources o f finance. Very little of the government’s net lending is directly to the private sector (only housing loans by local authorities). However, some lending goes to state-sponsored credit companies directly lending to private enterprises. Cap-ital transfers, on the other hand, are paid mainly to the private sector. They are divided between grants to households and institutions for social purposes, and grants to enterprises for productive purposes.
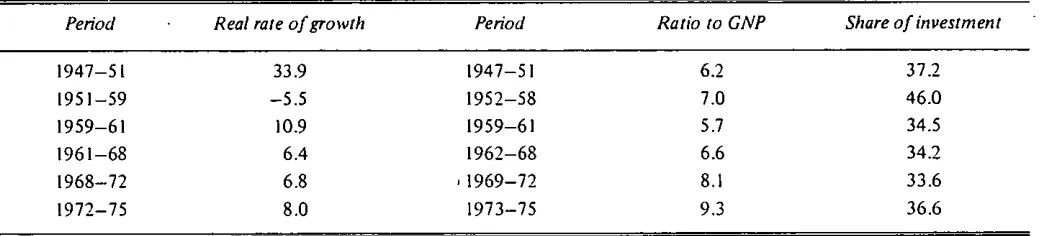
The first part of Table 1.3 shows the rapid expansion in public capital spending after the war. It concentrated heavily on infrastructural investment through the government’s own investment programme and through lending to public industries operating in these areas. The expansion seized up once cheap reconstruction loans stopped flowing. This retrenchment bit hard on direct investment and lending, while capital transfers went on growing. Thus, there was quite a turnabout in the components of spending in the second part of the table.
The economic programmes made public capital spending the main vehicle of the government’s development policy. It had a dual role of sustaining aggregate demand and of raising the level of investment. Table 1.3 indicates the dramatic growth in real capital spending during the First Economic Programme. This programme placed priority on "productive" public invest-ment - that which increased national output of competitive goods and services. It was claimed that the most pressing social investment needs had been satisfied. There was also fear of debt service charges so high as to im-pede growth. The policy bore fruit in the striking fall in spending for social purposes in 1959-62. Net lending was the major beneficiary. This financed investment in productive public sector industries and credit for industry and agriculture. Other development proposals introduced at this time were sub-sidies ort fertilizers and grants for private industrial investment, but these measures had no immediate impact on the share of capital transfers to private enterprise.
Table 1.3 (a): Public capital spending: its annual average real rate of growth; average ratio to gross national product; and average share in gross domestic physical capital fornration
Period Real rate of growth Period Ratio to GNP Share of investment
>
1947-51 33.9 1947-51 6.2 37.2
1951-59 -5.5 1952-58 7.0 46.0
~
1959-61 10.9 1959-61 5.7 34.5 ~
t"
1961-68 6.4 1962-68 6.6 34.2 ~
1968-72 6.8 , 1969-72 8. l 33.6 ~
1972-75 8.0 1973-75 9.3 36.6 ~
Note." Public capital spending excludes payments in redemption of public debt, and minor capital payments to the rest of tire-7 world. It includes public lending net of repayments to tire government for past loans. Public net lending to’intervention agency-..I
[image:27.671.77.599.201.319.2]Table 1.3 (b): Distribution of public capital spendb~g by type
Pe~d Gross physical capital formation
Infrastntctural Social
Capital transfers Net lending
Agricultural and Social industrial sectors
Total
% % % % %
1947-52 62.0 32.3 5.0 0.8
1953-58 30.4 26.8 22.1 13.6 7.1
1959-62 37.3 14.2 30.6 12.7 5.4
1963-68 35.3 23.3 19.9 16:6 8.3
1969-72 30.4 25.0 14. I 21.9 8.4
1973-74 32.4 28.7 18.9 12.5 7.6
% :::
ioo
I O0 r
1 O0 100
"-I 100
100
Source." National Income and Expenditure.
[image:28.673.84.615.127.295.2]THE ECONOMIC AND SOCIAL RESEARCH INSTITUTE
social spending was made by reducing public lending. It was comparatively easy for the bodies receiving these loans to borrow elsewhere. Grants to manufacturing industry began to grow in earnest during the tenure of these programmes. They increased five-fold between 1965 and 1971, but then subsided.
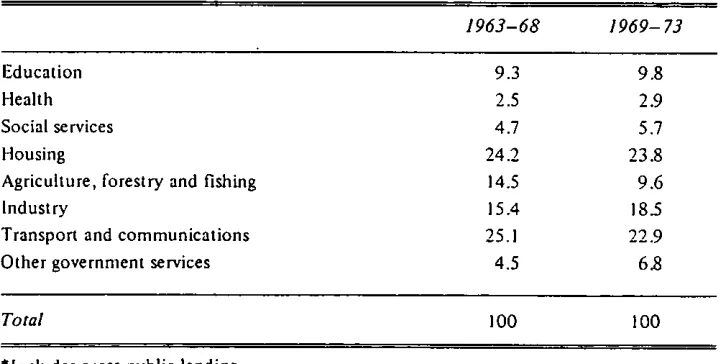
[image:29.483.83.444.268.450.2]Table 1.4 shows the functional distribution of capital spending during the second and third programmes (the only period for which it is yet available). The most dramatic difference between these programmes is the reduced share of investment going to agriculture and increased share to industry. Social investment and other government services have drifted upwards. Al-though public capital spending was the focal point of public programmes, none of them envisaged growth in the public share ofinvestment. Table 1.3 (a) shows that this aspect of the programmes was fulfilled as the public share showed little change from 1959 to 1972.
Table 1.4: Functional distribution of public capital spending*
1963-68 1969-73
Education 9.3 9.8
Health 2.5 2.9
Social services 4.7 5.7
Housing 24.2 23.8
Agriculture, forestry and fishing 14.5 9.6
Industry 15.4 18.5
Transport and communications 25.1 22.9
Other government services 4.5 6.8
Toml 100 100
*Includes gross public lending.
Source: National Income and Expenditure
After the Third Programme ended, the real growth of public capital spend-ing rose initially, but it subsided in 1975 when capital transfers actually fell in real terms. During these years the government took action to sustain demand in the face of recession. Direct investment, lending to public sector industries for investment, and public consumption spending were all expan-ded. Capital transfers, on the other hand, are not entirely controlled by the government since private investors must also be willing to undertake the subsidised projects. The decline in real capital transfers thus reflects the
I
IRISH PUBLIC DEBT
noticed too (Table 1.3 (a)) how the gqvernment sbare in total investment climbed in these years.
The sustained shift towards public social investment since the early 1960s,
evident in both Table 1.3 (b) and Table 1.4, stems from two factors. The first is demographic change. An increased rate of family formation promoted population growth during the 1960s. This raised the demand for housing and education facilities. The ratio of young and old dependants on the working population is exceptionally high in Ireland. Thus, as children stayed on longer in education and the retirement age fell, substantial new demands for social services were created. The second factor was a definite trend towards universa! public provision of health; education; social welfare, and housing to a lesser extent, during the last decade.4
It is impossible to assess whether the level and pattern of public invest-ment have been optimal. Little or no information is available on the rate of return to the various types of public investment. Recently, the .returns on government capital transfers to industry have comein for closer public scrutiny. Capital grants have, in fact, become the mainstay of the govern-ment’s industrial promotion strategy. Subsidies always run a danger of a serious misallocation of resources. On the one band, the investment might have taken place without any grant if investment demand is price inelastic. Or, on tile other hand, if demand is elastic a smaller grant might have done. Apart from this fundamental problem of subsidies, capital grants have also been criticised because of the sort of enterprise they encouraged (see Stewart (1971), Cooper and Whelan (1973), and McAleese (1977)). Closer attention could profitably be extended to many other forms of public investment such as spending on roads, housing, health, and so on. A tricky problem is that the government’s judgement plays a large role in deciding the "social" or "redistributional" as distinct from purely private benefits of spending. However, the presence of such benefits must not be an excuse exempting the project from closer scrutiny. It is desirable to evolve measures for estimating the total contribution, (social and economic) of such projects, although any such measures can never be absolutely precise. In the past, decisions
extend-ing social spendextend-ing seem to have escaped careful appraisal of their benefits and costs, and of the ability of ancilliary facilities to cater for extra demand.
The Third Economic Programme proposed to introduce more systematic methods of analysing public spending by reference to objectives and outputs. These would put money measures on the discrepancy between social and
private values created by market imperfections, and on the benefits of re-distribution. However, tile proposal floundered in the face of difficulties in
finding suitable measures. The benefits of new proposals and the success of past measures, particularly in the social area have, thercfore, remained wlgue. The effort to evaluate public spending should be renewed. It is particularly
THE ECONOMIC AND SOCIAL RESEARCH INSTITUTE
a more rigorous footing. In this case,some alternative investment opportunity is sacrificed, but the sacrifice is not immediately brought home to the public in the form of taxation.
Table 1.5 examines how public capital spending has been financed over the years. The broad picture is already familiar from the discussion in Section I! of this chapter. Net borrowing financed roughly three-quarters of capital spending between 1947 and 1972 but it varied noticeably from year to year. It rocketed to one-and-a-half times capital spendingin the period 1973-75, as borrowing was used to finance public consumption spending (i.e., public dissaving through current budget deficit described above). Foreign borrowing was high immediately after the war but then fell away. It began to re-emerge from the mid-1960s and in th’e period 1973-75 it was financing a bigger share of capital spending than in the years of Marshall Aid. The other sources of finance are depreciation and capital taxation. The former made a remark-ably stable contribution but it was far short of a realistic allowance for depreciation of capital stock (see Chapter 4, Section I1). The contribution of capital taxation dwindled until the late 1960s, but recovered then as tax thresholds failed to keep pace with inflation.
Table 1.5: Sources of finance for public capital
1947-51 1952-58 1959-61 1962-68 1969-72 1973-75
% % % % % %
Net public saving -7.3 8.0 5.5 10.5 11.3 -34.6
Depreciation 11.1 10.8 14.3 12.0 11.1 10.4
Capital taxation and other
net capital receipts 19.9 10.3 8.0 5.4 10.6 10.1
Net domestic borrowing 46.6 64.3 75.4 65.0 54.5 113.9 Net foreign borrowing* 29.8 7.7 -3.1 7.5 12.4 36.4
Total 100 100 100 100 100 100
*Foreign subscriptions to public domestic debt are not included.
Source: National Income and Expenditure. Finance Accounts, Dowling (1974). IV CONCLUSION
IRISH PUBLIC DEBT 3B
formation. This is the reasoning behind the balanced budget rule. Admittedly, the rule is blunt. It treats all investment projects as if equally worthy for debt financing, whereas, in fact, government must be selective in the invest-ments chosen. It also uses a somewhat arbitrary classification of capital and current spending, whereas in practice investment and consumption cannot be neatly separated. For example, in an economy with structural unemploy-ment, current spending may contain an element of investment in a human resource if it provides an employment opportunity for persons who are ill-equipped to find alternative work. However, these considerations can only be taken into account rigorously by systematic appraisal of present and future benefits of public spending. It is not sufficient to quote the weaknesses of the balanced budget rule to justify random departures from it.
The bulk of public investment is not subjected to sufficient scrutiny of costs and benefits. In principle, the government’s investment should be de-cided by the goal of equalising the marginal social return in public and alter-native private investments, with the marginal social cost of foreign funds and domestic savings. This is not easy to measure. However, while judgement must play a large part in guiding public finance, the area where judgements are necessary can be narrowed by careful appraisal of public investment opportunities. Tile economic programmes were a welcome departure. They attempted to set investment, foreign capital inflow, public borrowing, and public capital spending into a perspective of economic development targets. They prevented precipitate policy changes that had previously set back development. However, the concrete policy proposals were inadequate to meet planned targets. Investment requirements were also seriously under-estimated. These problems again highlight the need for careful study of the intended results of public investment. The failure to reach targets has made governments in tile 1970s reluctant to undertake elaborate long-period
planning. None the less, the need for a long view regarding investment is as pressing as ever. A new economic programme should focus on planning the government’s own spending and achieving the targets directly under its
Chapter 2
Public Borrowing and Stabilisation
1 THE PRINCIPLES OF STABILISATION POLICY
B
ESIDES guiding long-term development, government financial decisions play a role in stabilising short-run disturbances in the economy. A long-term plan makes decisions about the correct levels of domestic saving and in-vestment, of net inflows of foreign capital, and of public borrowing. These are not separate decisions but are inextricably linked as the national accounting identity:(G - T) = (1 priv - S priv) + (X - M)
illustrates. They are chosen in a context where resources are employed to their capacity. However, this will not happen automatically. Even when a proper long-term strategy has been adopted, disturbances can occur in the private domestic economy or the external sector. Tile government seeks to neutralise such disturbances. An interest rate policy can have very little effect on the level of demand in an open economy so the government must
rely on fiscal measures. The two arms of fiscal policy are spending and taxa-tion. Since borrowing is their residual, it emerges as a pivotal ingredient in short-run stabilisation of the economy. Does this second aspect of borrowing
alter any of the conclusions reached in the last chapter?
In the face of potential deflation the economy can be stabilised by either cutting taxation or increasing spending. The latter is more effective per pound because part of a tax cut will be saved and the remainder which is spent usually has a larger import content than public spendh~g. Thus, correc-tive tax measures will call for greater borrowing than public spending measures. However, consideration of stabilisation goals alone gives no compelling grounds for choosing between these alternatives. At this point, the long-term allocation objectives re-enter. If initial decisions conformed to long-term plans, the appropriate response depends on the source of disturbance. When private investment collapses, investors fail to fulfil the allocation between current and future consumption desired by savers. The government’s com-pensatory policy should step in to counter this private market failure by ex-panding public investment. Similarly, a fall in domestic consumption should
36 THE ECONOMIC AND SOCIAL RESEARCH INSTITUTE
be countered by cutting taxes to stimulate private consumption and finan-cing some public consumption from borrowing. Deflation can also originate abroad if export earnings collapse or the cost of imports rise. Matters are more complicated here. An increase in foreign capital inflow is an essential part of stabilisation because without it the volume of available exports cannot pay for the required volume of imports. Stabilisation also requires a boost in aggregate demand. Falling export incomes or diversion of income to pay for imports would, otherwise, pinch spending on domestic goods. The government’s response requires two corresponding elements. First, it should facilitate a capital inflow by directly borrowing abroad if private flows are inadequate,s Second, it should increase public investment to bolster demand. Extra domestic investment is appropriate because the stabilising inflow of foreign capital cuts into the country’s external assets.
II THE IRISH EXPERIENCE
During the 1950s, Irish fiscal policy was a failure. It did not prevent a prolonged recession in the economy. Moreover, although there was no stated Iong-ternl objective for saving, investment and capital inflows, fiscal respon-ses appear to have borne no relation to tile source of disturbance in the economy. Policy-makers kept their eyes on the level of foreign exchange reserves as the main barometer deciding when a change in fiscal policy was necessary. The response was always tile same: when reserves fell public in-vestment and public borrowing were pruned. This was the response to the import price inflation of the Korean War in the early 1950s and to the collapse of export earnings in 1956. Thus, fiscal policy aggravated deflationary pre-ssures on aggregate demand, and made no effort to facilitate accommodating capital inflows through its own borrowing.
The record of fiscal policy during the 1960s and 1970s has been more successful. A period of almost uninterrupted growth was enjoyed until the onset of world recession in late 1973. However, policy still seems to have lacked a longer view in its response to disturbances. In 1965 and 1970, the government believed growing consumption was causinginflationary pressures. It responded by cutting public investment when tax increases would seem to have been more in line with their diagnosis, hi 1974/75 when severe recession followed in the wake of the oil price increase, the government heavily borrowed abroad helping to accommodate the needed capital inflow. It stepped up the volume of public spending by over 7 per cent in both years to support domestic demand. These responses were not enough to prevent a sharp recession, but they were in the right direction. At all events, an econ-omy so dependent on external trade as Ireland could not hope to ride out the world slump unscathed. However, a serious weakness in this policy was the sort of public spending undertaken to support demand. Public
IRISH PUBLIC DEBT 37
tion rose more rapidly than capital spending in both years, but particularly in 1975 when capital spending stagnated in real terms.6
In previous years, public consumption was entirely financed by taxes, but net borrowing funded 8 per cent of it in 1974 and 16.5 per cent in 1975. Thus, the government responded to the recession by heavy dissaving. It defended tiffs policy as the appropriate stimulus for deficient demand. How-ever, this is not a sustainable argument. The deflation was brought on primarily by dearer imports followed by a collapse in investment. Both of these called for expanded public investment from the long-term view of the country’s asset position. Thus, expanded public investment was the approp-riate stimulus to demand. Even from the short-run st~indpoint, financing public consumption from borrowing seems to have been misguided, since a great deal of it financed increased rates of pay, not increased public service employment. The long-term danger of the policy is that the extra public debt is a future liability, not backed by any asset. It is arguable that with pri-vate investment demand collapsing, no pripri-vate asset is sacrificed by domestic public borrowing, since savings are put to use that would, otherwise, have been lost through further deflation. However, this argument is not looking at the relevant alternatives. Both public consumption and investment are capable of containing deflation, so the choice of consumption still means opting for a public liability without backing. Tbe case is even clearer if tbe funds are borrowed abroad, when the future public liability is a direct drain on the couutry’s resources.
I11 CONCLUSION
The role of stabilising the economy modifies the development role of public borrowing to a degree. However, deflation does not give a carte
blanche to borrowing for any purpose. Borrowing for consumption is only
warranted if private consumption below its optimal level is the cause of recession. This does not happen frequently. Consumption demand is com-paratively stable and such fluctuations as occur do not cause sharp adjust-ment ill zl country such as Ireland where the multiplier effects are small. The usual source of recession is a collapse in investment demand or external deflation. In these cases, borrowing to finance extra public investment pre-vents the frustration of savers’ intention to promote capital formation. This cont~orms with the use of borrowing prescribed in the last chapter. Excessive demand in the economy is more likely to cause a clash between the develop-ment and stabilisation roles of public capital spendhlg. It may force the government to cut back OH its investment programme, or finance more of it from taxation. However, once again small multiplier effects soften the conflict.
Chapter 3
The Stock of Public Debt
I PUBLIC BORROWING AND PUBLIC DEBT
QL
VER time net borrowing leads to an accumulation of public debt. WTable 3.1 shows the rate of net public borrowing in relation to GNP and the form of borrowing in various periods since the war. The rate of borrowing varied considerably from year to year because it acted as a residual source of finance for fluctuating capital spending. The variation was around a fairly steady trend of 5Yz per cent of GNP until 1973, then borrowing rose sharply.Table 3.1 : Public net borrowing: its distribution among various sources, and its ratio
to gross national product
1949-51 1952-58 1959-61 1962-68 1969-72 1973-75
% % % % % %
Foreign debt 45.9 5.4 -7.4 11.0 19.1 29.1
Marketable domestic 16.8 48.9 54.5 78.3 74.4 58.5
Small savings 21.8 28.6 39.8 24.1 25.6 7.5
Other domestic 15.4 17.1 13.2 - 13.5 - 19.1 4.8
Totalnetborrowing 100 100 100 100 100 100
As a proportion of GNP 5.5 5.2 4.2 5.0 5.4 1 1.8
Note: The distribution of net borrowing is based on Dowling, 1974. They do not exactly
match the published totals for net borrowing, but the discrepancy is small.
Source: Dowling (1974); Finance Accounts; Central Bank of lreland Quarterly Bulletins; National Income and Expenditure.
The source of borrowing varied widely over the years. The pattern of foreign borrowing was noted in the first chapter. In all, foreign borrowings of £41 million under tbe Marshall Aid Reconstruction programme were made between 1948 and 195 I. These funds were put to use gradually, reaching a peak of 70 per cent of net borrowing in 1951. The bulk of them had been
40 THE ECONOMIC AND SOCIAL RESEARCH INSTITUTE
spent by 1952. From 1951 until 1965, the only external source of public funds were the foreign exchange holdings of government departments. Their contribution was significant in certain years, but on the whole net
foreign borrowing was negative during this period as some Marshall Loans were repaid. In 1965, direct foreign borrowing re-appeared and from then unti!
1973 contributed 15 per cent of borrowing requirements. In 1974, the jump in bgrrowing brought much greater reliance on foreign sources rising to 34 per cent in 1974/75.
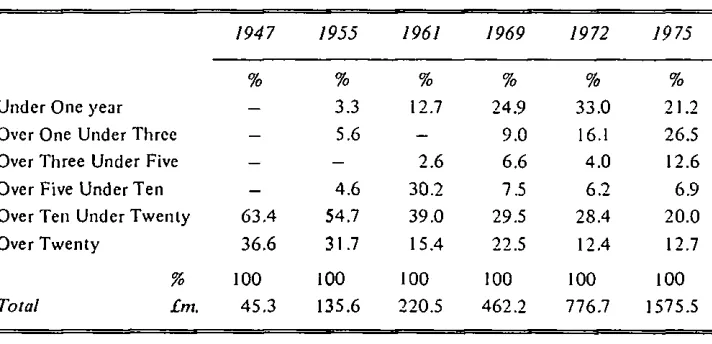
Within domestic borrowing, sales of marketable securities have become more dominant since the early 1960s. This reflects growing reliance on borrowing from financial institutions. In the early 1960s, about 75 per cent of security sales were taken upby the non-bank public but in the 1970s this had fallen to 45 per cent. Thus, borrowing from the non-bank public either as small savings or sales of securities are being rapidly eclipsed. This is partly a policy choice. Collection of savings from the ordinary public is left to the financial institutions who specialise in this job.7 None the less, a recoil from poor real rates of return also underlies the decline in contribution of person-al savers.
The growth and structure of public debt should mirror these trends in public borrowing. However, definitional differences cause some ’slip between the cup and the lip’. (i) The debt statement covers liabilities of the central government alone excluding local authorities, and certain funds operated within government departments. Since local authorities borrow almost exclusively from central government through the ’Local Loans Fund’, their omission is of no real consequence. The departmental funds have direct liabilities to the public. However, they lend principally to centralgovernment and this is counted in the debt, so the distortion caused to the overall debt picture is lessened. Over the whole period there is a discrepancy of under 6 per cent between total net public borrowing and the change in published debt liabilities associated with borrowing.~
(ii) Besides liabilities directly associated with central government borrowing, debt also includes the capitalised value of certain other liabilities. The first is an undertaking to bear part of the cost of local authority borrowing, but since these funds come from the central government itself the liability is double counted. It is accordingly excluded below. The second is
compensa-7 Some of these are state operated, notably the Post Office and Trustee Savings Bank, the Agricultural Credit Corporation, and the Industrial Credit Company.
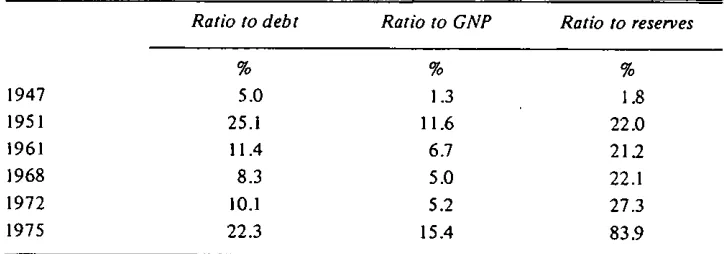
IRISH PUBLIC DEBT 41
tion for land acquired for re-distribution: the total liability is shared between the State and the new occupier. The final item is an undertaking to under-write independent borrowing by the Department of Posts and Telegraphs mainly from the Post Office Savings Bank for telephone development.
[image:38.495.44.400.237.407.2](iii) The published debt figures express foreign debt at its original Irish pound value. They ignore the extra liability incurred on non-sterling loans when the pound depreciates.9 To get a proper view of tile liability the foreign debt is valued at current exchange rates below. All debt, domestic and foreign, is expressed at the value that must be repaid at final maturity. This will usually differ from the price marketable debt would fetch in the market.
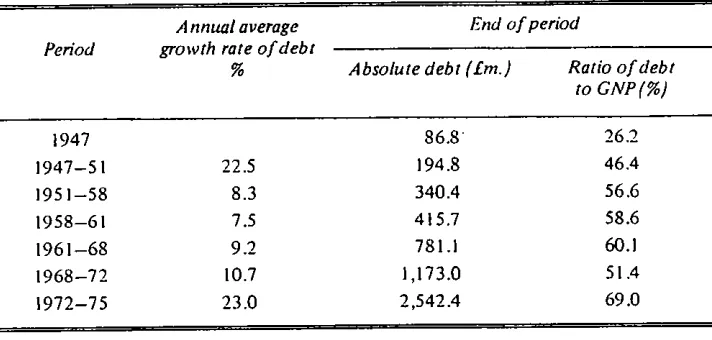
Table 3.2: Total public debt; its annual average growth rate; its absolute level; its ratio to gross national product
Period
Annual average growth rate of debt
%
End of period
Absolute debt [£m.) Ratio of debt to GNP (%)
1947 86.8 26.2
1947- 51 22.5 194.8 46.4
1951--58 8.3 340.4 56.6
1958--61 7.5 415.7 58.6
1961--68 9.2 781 .I 60.1
1968-72 10.7 1,173.0 51.4
1972-75 23.0 2,542.4 69.0
Source: Finance A ccoun Is
Notes: 1. Prior to 1967 the total capitalised liability for housing and sanitation is excluded (not just that owing to local authorities but the difference is slight).
2. Prior to 1960 there is an element of double counting in figures for ways and means advances.
Table 3.2 traces the uninterrupted growth of public debt over the post-war period. The pattern of annual average growth rates reflect the changing
42 THE ECONOMIC AND SOCIAL RESEARCH INSTITUTE
reliance on borrowing in the various sub-periods, although they partly con-ceal the growth of absolute additions to debt since the early ’sixties. Since public debt tends to reduce private investment or the economy’s external assets, the ratio of debt to income can be viewed in the same light as the ratio of a personal commitment to creditors to annual earnings. If funds have been put to good use, a large commitment to creditors is quite legitimate. Similarly, the public debt ratio can only be assessed by reference to how the funds have been used by government. It should neither be dismissed as un-important because as a community the bulk of debt is ’owed to ourselves’, nor treated as a crushing millstone weighing down progress because taxes must be raised to service it. Table 3.2 shows how the debt ratio evolved over the post-war period. The debt ratio grew from a low of 25 per cent in 1948 to a peak of 63 per cent in 1966. Despite the comparatively high level of borrowing over the following years, the debt ratio fell away quite sharply at the end of the decade. This was primarily due to accelerating inflation. A trough of 5 I per cent was reached in 1973. It then staged a dramatic revival to reach 69 per cent of GNP in 1975, as the very heavy public borrowing outweighed the influence of continuing inflation.
11 THE LEVEL OF DEBT AND OF ASSETS
If borrowing is used solely to finance public investment, then each year’s increment of debt will be backed by assets. If it is used to fund consumption then dead-weight debt will be created. Subsequent management of debt can alter the proportion which is backed by assets. Unless debt is redeemed, or at least a charge for depreciation levied on current taxation according as public assets wear out, then the dead-weight share will grow. On the other hand, if the government defaults on its debt or the real value of debt is eroded by inflation then the dead-weight share contracts.
Until recently, debt creation has been associated with public investment in Ireland. However, subsequent events have not kept the level of real assets created and real debt in line. Table 3.3 gives a rough illustration of the dis-crepancy by comparing outstanding debt with an estimate of the assets created by public spending over twenty years (based on the cost at constant (1975) prices of public investment minus a realistic allowance for depreciation). Assets appear to exceed debt by £880 or 35 per cent. Of course, showing that the past cost of assets exceeds debt does not indicate whether the true value of these assets is greater than the debt. Only information on the true social returns from public investment could answer that question. The dis-crepancy in the Table occurred through the effects of inflation on the fixed money value of debt, not by speedy redemption of debt nor by large charges for depreciationJ o
IRISH PUBLIC DEBT 4~
Table 3.3: Outstanding public debt in 1975 and the accumulated real value of public
capital spending over twenty years
Debt (£m.) Assets created [£m.)
2542.4 Public capital stock 1984.7
Private capital stock financed by grants 1017.4
Repayable loans 421.5
3422.9
Source: Finance Accounts, National lncome and Expenditure
Note: The capital stock was estimated as the sum over twenty years of net investment at constant 1975 prices. Half of total public capital grantswere taken ascoveringde-preciation, and the remainder forming net investment.
11I THE EFFECT OF INFLATION ON PUBLIC DEBT
The reduction in the real value of public debt due to inflation is important in its own right. It raises issues of equity and of efficiency. The cost of this reduction falls to tile taxpayer if the interest rate paid contains an element compensating for the effect of inflation on the principal of debt. If compen-sation is not paid, the debt holder bears the cost. As the pace of inflation has increased, rising interest rates have afforded partial insulation against the effects of inflation. However, the majority of debt bears a fixed interest rate, so this limited protection was only enjoyed by new lenders. The compounded effect of uncompensated inflation on debt holders was dramatic. The return earned by domestic debt holders after deducting an allowance to maintain the real value of principal was negative for much of the period 1949-75. Adding up over the whole period, it amounted to a loss of £.629.4 at con-stant 1975 prices. This was equivalent to 28.9 per cent of outstanding debt and 16.9 per cent of GNP in 1975.