Abstract— Many vision-based approaches for obstacle detection often state that vertical thin structure is of importance, e.g. poles and trees. However, there are also problem in detecting thin horizontal structures. In an industrial case there are horizontal objects, e.g. cables and fork lifts, and slanting objects, e.g. ladders, that also has to be detected. This paper focuses on the problem to detect thin horizontal structures. The system uses three cameras, situated as a horizontal pair and a vertical pair, which makes it possible to also detect thin horizontal structures. A comparison between a sparse disparity map based on edges and a dense disparity map with a column and row filter is made. Both methods use the Sum of Absolute Difference to compute the disparity maps. Special interest has been in scenes with thin horizontal objects. Tests show that the sparse dense method based on the Canny edge detector works better for the environments we have tested.
Index Terms— Computer vision, Obstacle detection, Stereo
vision, Thin structures.
I. INTRODUCTION
Obstacle avoidance may be divided in obstacle detection and path planning while the former is the input to the latter and therefore of great importance. Obstacle detection has to be robust, i.e. can handle data that do not respond to a given model [1]. It also has to detect all potential obstacles in the environment with no false detections as, for instance, patterns in the floor. A robust obstacle avoidance algorithm is a key issue for a mobile robot in an unknown, or partly unknown, environment. A collision with an industrial robot might not just cause personal injury or material damage, it can also cause stoppage of production which leads to increasing costs.
Obstacle avoidance is an important part of a vision-based navigations system. An extensive survey of vision-based navigation is made in [13]. A recent work with map-building approach use stereo vision SLAM-algorithms [12] based on SIFT (Scale Invariant Feature Transform) to distinguish landmarks and a particle filter to track the position of the robot. They also utilize visual odometry. The algorithm approaches near real-time. Reference [11] combine visual odometry with wheel based odometry to get a relative position. SIFT is used for landmark detection to get an absolute position. Reference [10] bases their work on a model of human navigation where angular width of the
Manuscript received July 30, 2008. This work was supported by the University of Skövde
K. Hedenberg is with the University of Skövde, Box 408, 54128 Skövde, Sweden (phone:+46500-448502; e-mail: [email protected])
B. Åstrand is with the Halmstad Univeristy, Box 823, 30118 Halmstad, Sweden (e-mail: [email protected])
obstacles is used instead of the distances to obstacles. The goal angle and obstacle angles are together with the robot heading then used in a potential field model as in the VFH+ and VFH* methods. One problem, described by the authors, is that large distant objects have the same angle as closer small objects.
Many vision-based approaches for obstacle detection often state, especially in outdoor environment, that vertical thin structure is of importance, e.g. poles and trees [15], [14]. However, there are also problem in detecting thin horizontal structures. In an industrial case there are not just objects connected to the floor that has to be considered. Horizontal objects, e.g. cables and fork lifts, and slanting objects, e.g. ladders, also has to be detected. We do consider all obstacles in our research, but this paper focuses on the problem to detect thin horizontal structures.
Obstacle detection with vision has two parts; to detect the obstacle and to compute the distance to the obstacle. Current approaches in vision-based obstacle detection often combine sensors algorithms to overcome the drawbacks with one single approach. Reference [15] uses stereo vision with a variable baseline to drive a vehicle in the DARPA Grand Challenge. A variable baseline results in good accuracy at various distances but needs a very accurate calibration. Reference [14] uses feature vectors based on different monocular cues (e.g. texture gradients, texture variations, color) and train models with reinforcement learning to drive a RC car in an outdoor environment. According to the authors the use of monocular cues instead of stereo vision yields good determination of depth at larger distance and render possible higher speed of vehicles. An open problem with learning methods is to decide when trained algorithms will work. [17] have extended this work and use monocular cues combined with stereo vision to successfully obtain better depth estimation than with a stereo system alone.
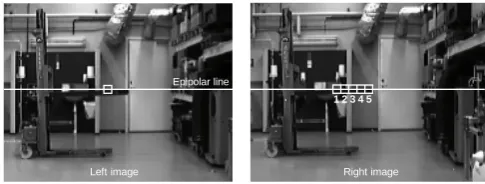
1 2 3 4 5
Epipolar line
[image:1.595.303.546.628.720.2]Left image Right image
Figure 1. Matching problem. What point in the right image corresponds to the point in the left image? The third pixel in the right image is the correct match, but a matching algorithm would probably select the fourth or fifth pixel as a match. This is due to that pixels that lie on the object boundary interact with the background.
Obstacle Detection For Thin Horizontal
Structures
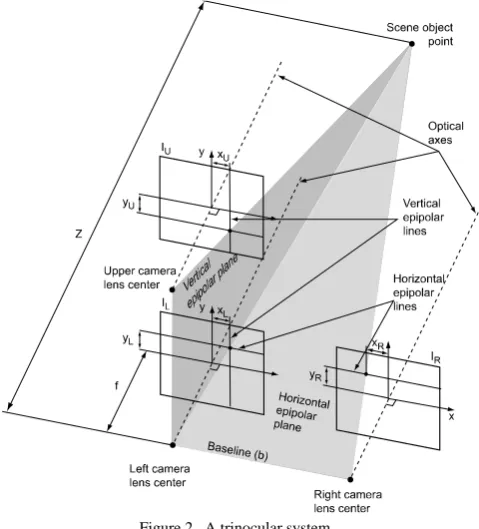
Figure 2. A trinocular system.
II. OBSTACLEDETECTION
In computer vision two historically common methods are optical flow and stereo vision. This paper focus on stereo vision.
A. Sensors
A traditional stereo vision system has two horizontally placed cameras with the optical axes in parallel. Search for corresponding points is made along the so called epipolar line. See for example [3] or [4] for an introduction to stereo vision. One problem that arises with using horizontally situated cameras is correlation of horizontal thin structures, e.g. wires or forks on a forklift. This is a well known problem and is illustrated in Fig. 1. The natural solution to this is to add a third camera, a trinocular system, which is situated above the other two cameras and form a vertical image pair, Fig. 2. Using more than two cameras is made in several earlier works, see for instance [5], [6] and [7], and has the advantage of eliminate false matches and increase precision [7]. The drawback is an increased cost, both financial in purchasing more sensors as well as computational in handle more data. The first drawback is not a problem in systems where the sensors are a fraction of the total cost of the system. The second drawback is manageable as long as the system is solving the problem in detecting obstacle in the right time.
A trinocular camera system is used in this work, since
horizontal objects are hard to detect for a stereo system with only horizontally situated cameras [2].
B. Camera Placement
For all vision systems is the placement of the cameras essential to get a good result. This has to be considered for every new setup [8]. There are several ways to determine the placement of the camera system on the robot. The easiest way is to just choose a placement by intuition. Putting a little more effort in this judgment will probably increase the precision in the system. It will also make a discussion of camera placement more unbiased if the systems performance later has to be increased. The reasoning in [8] is used in the experiments in this paper.
To get a high resolution in distance, when computing the distance from the disparity, a long baseline is to be preferred. On the other hand will a long baseline result in that a larger disparity range has to be searched to get a match. This will result in longer computation time and a greater possibility of a false match [5]. The distance (Z), Fig. 2, to an object can be computed as
d bf
Z= (1)
where b is the baseline, f is the focal length and d the disparity between the corresponding point in the images. All variables are in meter.
III. ALGORITHMS
The unsolved problem, at least in the general case, in stereo vision is the correspondence problem (to find the correspondence between two locations in two images). While many techniques exist for correspondence, the most used in real-time stereo vision are the correlation-based Sum of Squared Difference (SSD) and Sum of Absolute Difference (SAD) since they are fast. In those techniques a similarity criterion is a measure of the correlation between windows, typically 3x3 pixels, in the two images. Where the curve of similarity peaks (or drops), there is a match. See for example [3] or [4] for further reading in correspondence. The size and shape of the window is still an open issue. A small window is preferable in regions with high texture and to get accurate disparity measure, but will result in a low signal to noise ratio. A larger window is preferable in regions with low texture and will reduce noise, but will also cover a larger image area and make pixels with varying disparities be covered in the window. Using variable windows as described
(a) Original image (b) Ground truth (c) Dense disparity map (d) Sparse disparity map
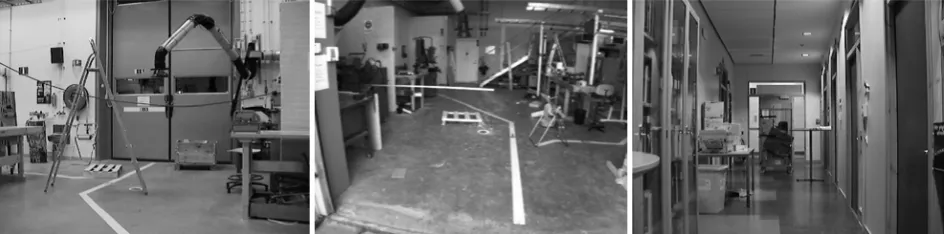
a) Hanging cable and smoke exhaust system b) Beam and smoke exhaust system c) Corridor with a small table to the right
Figure 4. Scenes evaluated.
in [5] or [19] will overcome the problem in images with varying texture. Though, these techniques are slow. Reference [18] proposes the use of a five-window approach to get real-time performance.
To get a more robust system and to increase the computational speed there are some constraints that can be used. The epipolar constraint says that the corresponding pixel is found on the epipolar line. It is also possible to further limit the search range if the desired distance-of-interest is defined. When a series of similarity matches are computed the correct match need to be found. The WTA (Winner-Takes-All) algorithm simple picks the value with the single best matching value. This is not the optimum for images with repetitive textures or textureless regions. The uniqueness constraint states that there is a one-to-one relationship between pixels in the two (or more) images. The Left-to-Right consistency check can be used to verify the uniqueness. When a corresponding pixel is found, the algorithm is used in the other direction. If the origin pixel is found there is a match.
When there is low texture in a region the cost values of the similarity measures will be very similar. By rejecting matches where the best match (C1) is close to the second best match (C2) erroneous matches are removed. This can be done by using
1 1 2
C C C
C= − (5)
to get a confidence coefficient. Textureless regions will get a flat similarity curve while regions with repetitive textures will have several peaks. Both regions will, however, get very low similarity measures and are therefore not reliable.
There are different methods in computer vision to get the distance to objects. Two common methods are Dense disparity map and Sparse disparity map. The methods are shown in Fig. 3 for a real stereo pair with the ground truth from the Scharstein and Szeliski’s dataset [22].
A. Dense disparity map
A dense disparity map is created if every pixel in an image is considered. [9] compares different dense stereo algorithm for complex urban traffic scenes and states that the more simpler WTA algorithm with Left-Right consistency check outperform techniques with multiple windows. An often mentioned drawback with dense disparity map is the problem in textureless regions.
B. Sparse disparity map
Another approach is to consider only areas with high information contents, e.g. corners and edges. A POI (Point Of Interest), e.g. a corner, has high intensity variation in both x- and y-direction. The KLT- [20] and Harris- [21] detectors use a coefficient matrix to compute POI. Edges are often extracted with Sobel- or Canny-filter, Fig. 5.
C. Dense disparity map with column and row filter We implemented a row filter with the same principle as in [16] where a column filter was used to detect thin vertical objects. The column filter is the most decisive filter of the filters used in [16]. A row filter keeps the most frequent disparity in every row and rejects all the other disparities. It has drawbacks as stated in [16] where the method is used in an off-road environment outdoors. We try this method indoors in an industrial setting.
IV. EXPERIMENTSANDRESULTS
Scenes in Fig. 4 are used to evaluate the two algorithms; a dense disparity map with a row filter and the sparse disparity map based on an edge detector. The computations are made off-line in Matlab.
From the left-right camera pair and from the lower-upper camera pair is sparse and dense disparity maps computed respectively. In the sparse disparity map we decided to use the Canny detector since it performed slightly better than the Sobel detector, specially for the hanging cable. This is a threshold problem and better performance could be achieved with the Sobel detector by tuning, but with the drawback of more noise. Both the Canny- and Sobel-detector have problems to detect the ladder, Fig 5, because it has nearly the same gray value as the background, Fig 4a. A row and column filter is used on the dense disparity map.
For both algorithms are Sum of Absolute Difference (SAD), with a window of 3x3 pixels, used to compute the
(a) Canny (b) Sobel
correspondence between pixels and the algorithms enforces epipolar, uniqueness and mutual correspondence constraints to further improve the matching. A small window is necessary if thin obstacles should be located.
[image:4.595.57.543.53.152.2]We have focused on the horizontal objects in the scenes. The cable (Fig. 4a), the beam (Fig. 4b) and the table (Fig. 4c) are detected in the sparse disparity map, example is shown in Fig 7. It is possible to detect, for instance, the cable in the dense disparity map (Fig. 6b), but the amount of outliers is high due to the small correlation window. The column (Fig 6c) and row (Fig 6d) filter have advantage in reducing the amount of outliers, but will also reject the hanging cable since the cable occupies several rows and columns. This is also shown in Fig. 8 where the beam is detected in both images, but the number of outliers is strongly reduced with the row filter. However, the row filter also rejects inliers as the hanging smoke exhaust system (Fig. 8).
V. CONCLUSION
This paper compares a dense and a sparse disparity algorithm for a trinocular camera system to detect horizontal objects for a mobile system. Both algorithms use small correlation windows to detect thin objects. The dense disparity algorithm uses a row filter to eliminate outliers.
The row filter works if long horizontal objects are to be detected. It does not perform well for short objects or for thin objects that occupies several rows.
A sparse disparity method based on the Canny detector works better for the environments we have tested. There are still problems to detect thin horizontal obstacles as hanging cables or obstacles that have nearly the same grey value as the background. In further work we will implement the sparse disparity algorithm in an existing robot and try the algorithm on a large database of industrial images.
REFERENCES
[1] P. Meer, “Robust techniques for computer vision.” Emerging Topics in Computer Vision. G. Medioni, S.B. Kang, Ed. Prentice Hall, 2004. Available:
http://www.caip.rutgers.edu/riul/research/papers/pdf/rotechcv.pdf [2] K. Hedenberg, A.-J. Baerveldt, “Stereo vision for mobile robots.”
Proceedings of Mechatronics 2004, the 9th Mechatronics Forum International Conference, Ankara, Turkey. 2004, pp. 259-270. [3] O. Faugeras, Three-dimensional computer vision – A geometric
viewpoint., Cambridge, Massachusetts, USA: Massachusetts Institute of Technology,1993.
[4] E. Trucco, A. Verri, Introductory techniques for 3-D computer vision. Upper Saddle River, New Jersey, USA:Prentice-Hall Inc, 1998. [5] M. Okutomi, T. Kanade, “A multiple-baseline stereo.“ IEEE
Transactions on Pattern Analysis and Machine Intelligence, 1993, pp. 353-363.
[6] T. Wiliamson, “A High-Performance Vision System for Obstacle Detection.” tech. report CMU-RI-TR-97-39, Robotics Institute, Carnegie Mellon University, 1997.
[7] D. Murray, J. Little, “Using Real-Time Stereo Vision for Mobile Robot Navigation.” Auton. Robots, 2002, pp. 161-171
[8] W. Huang, E. Krotkov. “Optimal Stereo Mast Configuration for Mobile Robots.” International Conference on Robotics and Automation, Vol. 3, April, 1997, pp. 1946 - 1951.
[9] W. van der Mark, D. M. Gavrila. ”Real-Time Dense Stereo for Intelligent Vehicles.” IEEE Transactions on Intelligent Transportation Systems, vol. 7, nr 1, 2006 pp. 38-50.
[10] W.H. Huang, B.R. Fajen, J.R. Fink, W.H. Warren, “Visual navigation and obstacle avoidance using a steering potential function.” Robotics and Autonomous Systems 54 (2006) pp. 288-299.
[11] M. Moreira, H. Machado, C. Mendonca, G. Pereira, “Mobile Robot Outdoor Localization Using Planar Beacons and Visual Improved Odometry.” Proceedings of the 2007 IEEE/RSJ International Conference on Intelligent Robots and Systems. San diego, CA, USA, Oct 29- Nov 2, 2007.
[12] R. Slim, P. Elinas, M. Griffin, J.J. Little, “Vision-based SLAM using the Rao-Blackwellised Particle Filter.” IJCAI Workshop reasoning with uncertainty in robotics, Edinburgh, Scotland, July 30, 2005. [13] G. DeSouza, A. Kak, “Vision for mobile robot navigation: A survey”,
IEEE transactions on pattern analysis and machine intelligence, Vol. 24. No 2, February 2002.
[14] J. Michaels, Saxena, A., Ng, A.Y. “High speed obstacle avoidance using monocular vision and reinforcement learning”, Proceedings if the 22:nd International conference on machine learning. Bonn Germany. [15] A. Broggi, C. Caraffi, P. Porta, P. Zani, “The single frame stereo vision
system for reliable obstacle detection used during the 2005 DARPA Grand Challange on TerraMaxTM”, Proceedings of the IEEE ITSC 2006 Toronto, Canada, September 17-20. 2006.
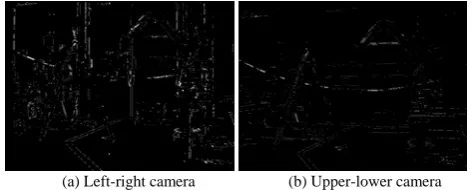
[image:4.595.316.545.192.289.2](a) Left-right camera (b) Upper-lower camera
Figure 7. Sparse disparity image from Fig 4a.
(a) Before row-filter (b) After row-filter
Figure 8. Dense disparity map for Lower-Upper images from fig 4b. a) Left-Right b) Lower-Upper c) After Column filter d) After row filter
[image:4.595.51.288.406.501.2][16] C. Caraffi, S. Cattani, Grisleri. P, “Off-road Path and Obstacle Detection using Decision Networks and Stereo Vision”, IEEE Transactions on Intelligent Transportation Systems, Vol. 8. Issue 4 2007, pp. 607-618.
[17] A. Saxena, M. Sun, A.Y. Ng, “Learning 3-D scene structure from a single still image”, In IccV Workshop on 3D representation for recognition (3dRR-07) 2007.
[18] H. Hirschmüller, P. Innocent, J. Garibaldi. “Real-time correlation based stereo vision with reduced border errors”, Int. Journal of computer vision, 47(1-3). 2002. pp. 229-246.
[19] Y. Boykov, O. Veklser, R, Zabiah. ”A variable window approach to early vision”, PAMI, 20(12): 1283-1295, Dec. 1998.
[20] G. Tomasi, T. Kanade, “Detection and tracking of point features”, Carnegie Mellon University, Tech. Report CMU-CS-91-132. April 1991.
[21] C.G. Harris, M.J. Stephens, “A combined corner and edge detector”, Proceedings of the fourth alvey vision conference, Manchester, 1988, pp. 147-151.