A new projection method for biological semantic map
generation
Hoan N. Nguyen, Nicolas Wicker, David Kieffer, Olivier Poch
Laboratoire de bioinformatique et génomique intégratives, Institut de Génétique et de Biologie Moléculaire et Cellulaire, France University of Strasbourg, Illkirch Cedex, France.
Email: [email protected]
Received 4 September 2009; revised 25 October 2009; accepted 26 October 2009.
ABSTRACT
Low-dimensional representation is a convenient method of obtaining a synthetic view of complex datasets and has been used in various domains for a long time. When the representation is related to words in a document, this kind of representation is also called a semantic map. The two most popular meth-ods are self-organizing maps and generative topog-raphic mapping. The second approach is statistically well-founded but far less computationally efficient than the first. On the other hand, a drawback of self-organizing maps is that they do not project all points, but only map nodes. This paper presents a method of obtaining the projections for all data points complementary to the self-organizing map nodes. The idea is to project points so that their initial distances to some cluster centers are as conserved as possible. The method is tested on an oil flow dataset and then applied to a large protein sequence dataset described by keywords. It has been integrated into an interac-tive data browser for biological databases.
Keywords:Semantic Map; Dimension Reduction; Biological Database; SOM
1. INTRODUCTION
Thanks to the availability of the human and other ge-nomes and the rapid progress of biotechnologies and information technologies, numerous large biomedical datasets have been generated. Modern biomedical in-formation thus corresponds to a high volume of hetero-geneous data that doubles in size every year and that covers very different data types, including phenotypic data, genotypic data as well as standards, processes, protocols or treatments used to generate information from raw data. In this context, systemic approaches are now needed to store, analyze and compare the huge amount of relevant information.
In addition, the knowledge provided by classical query services on biological data is often unsatisfactory (e.g. a list of proteins or sequences) and there is a need for user-friendly visual representations of the data. Such a representation exists and is called a feature or semantic map. It is used to visualize “land maps” in two or three dimensions that represent, for example, the distribution (similarity and neighborhood) of protein annotations in biological databases. When query results are represented on the map, the repartition of the proteins can be easily observed, as well as their proximity to clusters labeled according to their content. In addition, it is straight-for-ward to superpose the information obtained from addi-tional requests. Thus, a semantic map can greatly facili-tate the interpretation of results from large scale data analyses. To quote a few examples, semantic maps have already been used in fluid mechanics [1], astronomy [2], internet data mining [3,4], scientific literature mining [5] and biology [6].
Many low-dimensional methods have been devised [5,7,8,9] and two of the most popular are the WEBSOM method [9] and the Generative Topographic Mapping (GTM) [1]. These two methods are briefly outlined be-low.
WEBSOM originates from self-organizing maps [10] which is a classification algorithm where nodes move towards cluster centers. In WEBSOM, the nodes are fixed on a two-dimensional grid and at the same time live in the space of the dataset, typically a space. First, a point is picked at random from the dataset. Next, the closest node in is selected and then each node moves towards y according to the
equa-tion
Rp
y
j
i
w
Rpw
( 1) ( )t (t) (h t) ( ) j wj ij y w t j
w t where
( )t
is the learning rate decreasing in time and is a neighborhood function in the two-dimensional grid. These steps are then iterated for all data points. The ini-tialization of the p-dimensional space can be performed randomly, but a more effective method is to select points ( )t
ij
h
along the two first principal axes of the dataset [4]. Fi-nally, the dataset is used again by assigning each point to its closest node in the p-dimensional space using a Euclidean distance. Then, for each node, the number of points it has captured is taken as its density up to a given scaling factor (the size of the dataset).
The generative topographic map (GTM) [1] is a statis-tical method which is provably (locally) convergent and which does not require a shrinking neighborhood or a decreasing step size. It is a generative model: the data is assumed to arise by probabilistically picking points in a low-dimensional space and mapping them to the ob-served high-dimensional input space. The statistical model can be described in the following way:
2 2
( , , ) ( ) exp{ . ( )
2 2
p
i i
p y x W W x y
}
where xi is a two-dimensional grid node, is a scal-ing parameter, W. ( ) xi a generalized regression model,
a
W p m matrix and the elements of ( )x consist of basic functions
m j( )x
W
typically equal to radially symmetric Gaussians centered on the nodes of a two-dimensional grid. The parameters and of the model are estimated through the expectation-maximiz- ation (EM) algorithm [11]. This model can be considered to be the probabilistic counterpart of SOM/WEBSOM. However, the WEBSOM method is quicker than GTM when large amounts of data must be dealt with, especially if the winner selection is optimized so that millions of documents and nodes can be treated [4].
An alternative choice is to follow Flexer's approach [12] which first clusters the points in the data space and then projects cluster centers using Sammon's multidimensional scaling method [13]. However this means that only a sub-set of points are effectively projected. In this paper, we present a complementary method that projects all points using their distances to the cluster centers.
First this new projection method is presented, then it is evaluated on a benchmark data set and compared to other methods. Finally, it is used in the results section to gener-ate a semantic map in the context of a new integrative navigator for biological databases.
2. METHODS
The principle of the presented method is to project points after they have been clustered and the cluster centers have been projected onto a two-dimensional map. This is done by conserving as much as possible the original distances between the points and the cluster centers. Basically, for each point indexed by , the two- dimensional coordi-nates are search such as to minimize the difference be-tween the distances computed in the -dimensional data space with those computed on the map.
i
n
This comes down to finding the point xi in two di-mensions minimizing the following function E x( )i :
2 2 2 2 , 1 1 ( ) ( ) G
i k g k
g k
E x x c d
gwith dg denoting the distance between point and
cluster
i
g and cg k,)
the projection of the cluster center. The Newton-Raphson algorithm was used to minimize . At each step,
th k
t t
i i
( i
E x x1x H1.E
with H the Hessian and E the gradient of E.
2 2
2
1 1 x x1 2
2 2
2
2 1 2 2
,
E
E E
x x
E E E
x x x x
E
H
The optimizing function is not convex as the Hessian is not always semi-definite positive. To show this, it is sufficient to find a point X verifying X HX' 0. In
particular, we show that H11 can be negative which is also sufficient. First let us note that
2
2 2
, ,
1 1
2 ( ) 2(
G
k g k g l g l
l g k
E
)
x c d x c x
2 2 2 2 , , 21 1 1
8 ( ) 4 ( )
G G
l g l k g k g
l g g k
E x c x c 2
x
d and then set
1 1,1 2,1 3,1
2 2
1 1 1,1 2 1,2
2 2
2 1 2,1 2 2,2
2 2
3 1 3,1 2 3,2
( ) (
( ) (
( ) (
x c c c d x c x c d x c x c d x c x c
) ) )
Thus, H11 4
x1c3,1
2 x2c3,2
2d32
0Consequently, a global optimization process was per-formed using different initial values. Each cluster center projection was used as an initial value and the best solu-tion after convergence was kept.
3. RESULTS AND DISCUSSION
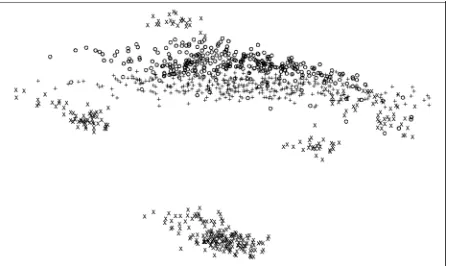
3.1. Validation Using the Oil Flow DatasetFirst, the dataset was clustered into 15 clusters and the cluster centers projected according to Sammon's multi-dimensional scaling method [13]. Then the 1000 points were projected in two dimensions using the method de-scribed above. The results are shown on Figure 1, where it be seen that three different groups are rather well line-arly separated. The groups obtained with the GTM and principal component analysis (PCA) methods are shown on Figures 2 and 3 respectively. In order to objectively measure the quality of these results, we computed the ratio of the between-class inertia and the total inertia for each method. For our method, GTM and the PCA, we obtained a ratio of 0.83, 0.25 and 0.23 respectively, thus confirming the visual impression. Nevertheless, it should be stated that, if only separation is desired and not spe-cifically linear separation, GTM performs better, even though it has the drawback of making the underlying grid very visible.
Figure 1. New projection of the dataset. Results of the pre-sented projection on the oil flow dataset. Crosses, circles and plus-signs represent stratified, annular and homogeneous multi-phase configurations respectively. The three group separations are clearly identified.
3.2. Semantic Map Generation for Biological Database
[image:3.595.61.284.278.416.2]The Laboratory of Genomics and Integrative Bioinfor-matics (LGBI) at the IGBMC Strasbourg, has developed a new high-performance biomedical information system, called the BIRD System [15,16]. BIRD is able to inte-grate very quickly heterogeneous data either from the large generalist databases (sequence, structure, function and evolution, etc.) or from specialized databases dedi-cated to high throughput biology (transcriptomics, inter-actomic, etc.) in a relational database (IBM DB2). Thus, it allows to organize massive sets of biomedical data according to real world requirements. An original bio-logical query engine, called BIRDQL, has been designed to facilitate access to the heterogeneous databases and to allow pertinent information extraction via a web server. This system has been used in the Decrypthon computing grid [17] in order to provide data to the runtime applica-tions.
Figure 2. Oil flow dataset after GTM. After projection of the oil flow dataset using the Generative Topographic Mapping, the three group separations are clearly separated, but in a com-plex way that is far from linear.
To complete the visualization and analyze functional-ities of the BIRD System, the new method described above to build semantic maps was integrated in the BIRD query engine (BIRDQL). The maps can be used to explore the data using a combination of high level que-ries and area selections (Figure 4). The method was tested by building a semantic map of the Uniprot data-base [18] using the keyword descriptions for each pro-tein. After removal of redundant vectors, we obtained 60,000 vectors in a 914-dimensional space corresponding to the 914 keywords extracted from about 6 million proteins. In the following lines, to avoid fo-cusing on the numerical details, we will consider proteins described by keywords where and
1,... 6000
z z
p
0
n
p
n
Figure 3. Oil flow dataset after PCA projection. After projec-tion of the oil flow dataset using principal component analysis, the separation of the three groups is not clearly identified. In particular, the crosses are very scattered.
points in 12 dimensions corresponding to 12 measure-ments on the mixture of oil, water and gas passing through a pipeline. The three phases in the pipe can be-long to three different configurations corresponding to laminar, homogeneous and annular flows.
stand for 60000 and 914 respectively.
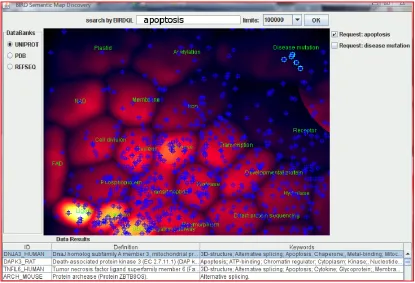
[image:3.595.60.286.470.603.2]Figure 4.Semantic map with density colours and most frequent keyword labels. Step 1: dimension reduction
The proteins were described by keywords and were thus represented by points in dimensions. As in the preprocessing step of WEBSOM [3,4], an initial dimension reduction was performed to reduce coordinates to using random projection directions. More specifically, random vectors
n
p
p
n
*
p
1,..., n
z z p
j
v were generated on the -dimensional unit-sphere and then new coordinates were obtained by computing the scalar product
*
p
, i
ij j
y v z on each document i. Thus, the proteins were described by points .
n n y1...yn
Step 2: mixture models clustering
In a second step, these points were clustered using mixture models. Mixture models are a powerful method to cluster datasets of points described by coordinates. The points are assumed to be independent realizations from a mixture of several distributions. Here the mix- ture is only briefly described for components
1
G
,..., G
f f with parameters 1...,G
G
. A general pres-entation of this method and its applications can be found in [19,20,21,22]. If 1,..., indicate the different weights of the components, the likelihood of the model
for
n
points y1,...,yn is expressed as:1 , ,...1 1
1 1
,..., ,..., ) ( )
n G
(
M G G
*
G
c
( )
m x
n g g
g i
L y y
f yiThe estimation of the different coefficients of the mix-ture model is commonly performed via the EM (Expec-tation-Maximization) algorithm of Dempster [11]. Here, in order to simplify the estimation, a variant of the EM algorithm called CEM was used [22]. In this application
was chosen to be equal to 30.
G
Step 3: cluster centers projection
Once clusters were obtained, the centers of grav-ity were computed in the p-dimensional space. Then, multidimensional scaling (MDS) [23] was applied on the cluster centers to produce two-dimensional coor-dinates . MDS was used because Sammon's method [13] failed on this dataset, since it produced
G
* .., G
1,
c
1,.
c c
...,
many points with the same coordinates.
Figure 5.The global architecture of the Semantic Map Discovery prototype coupled with the BIRD System using the BirdQL query engine.
[image:5.595.90.505.410.693.2]1 1
2 1
1 1
( ) exp{( ) ( )
2 n
i i
i
m x x x x x
n
}
Then, a color scale ranging from purple to white, with intermediary colors red, orange and yellow was assigned to each point according to its density. The map is repre-sented in Figure 4.
Then, a color scale ranging from purple to white, with intermediary colors red, orange and yellow was assigned to each point according to its density. The map is repre-sented in Figure 4.
This visual representation allows a global comprehen-sion of the whole database, which is easier to understand than numerical or textual data. Some important key-words shared by many proteins are visible on this map, such as kinase, ligase and protease. At the same time, frequent keywords, such as “complete proteome”, that are non-informative, are avoided because they are shared by several clusters. Another observation is that the den-sity is far from being homogeneous, the map being more crowded in the bottom-left corner than elsewhere.
This visual representation allows a global comprehen-sion of the whole database, which is easier to understand than numerical or textual data. Some important key-words shared by many proteins are visible on this map, such as kinase, ligase and protease. At the same time, frequent keywords, such as “complete proteome”, that are non-informative, are avoided because they are shared by several clusters. Another observation is that the den-sity is far from being homogeneous, the map being more crowded in the bottom-left corner than elsewhere.
When using the integrated biological query engine BIRD-QL of the BIRD System via a web service or http protocol, as shown in Figure 5, the selected proteins are represented on the maps by a plus sign of a given color. If different selections have been performed, different colors are used. An example is shown in Figure 6, where proteins selected by a query with the keyword “apop-tosis” are shown by blue plus signs. Some of these pro-teins were selected by the user and are surrounded by a white square. One of the proteins, DNJA3, belongs to the small cluster labeled “disease mutation” but does not possess the “disease mutation” keyword. Interestingly its deficiency implies dilated cardiomyopathy [25] (MIM- 608382).
When using the integrated biological query engine BIRD-QL of the BIRD System via a web service or http protocol, as shown in Figure 5, the selected proteins are represented on the maps by a plus sign of a given color. If different selections have been performed, different colors are used. An example is shown in Figure 6, where proteins selected by a query with the keyword “apop-tosis” are shown by blue plus signs. Some of these pro-teins were selected by the user and are surrounded by a white square. One of the proteins, DNJA3, belongs to the small cluster labeled “disease mutation” but does not possess the “disease mutation” keyword. Interestingly its deficiency implies dilated cardiomyopathy [25] (MIM- 608382).
There is still room for improvement in the construc-tion of semantic maps both at the algorithmic level and at the software functionality level. The point’s projection is formalized as a global optimization problem and cur-rently, it is resolved simply using different starting points with the Newton-Raphson method. However global op-timization methods could also be tested [26,27]. From a practical point of view it would also be useful to deter-mine how many clusters or nodes are necessary to achieve a good projection of the data points.
There is still room for improvement in the construc-tion of semantic maps both at the algorithmic level and at the software functionality level. The point’s projection is formalized as a global optimization problem and cur-rently, it is resolved simply using different starting points with the Newton-Raphson method. However global op-timization methods could also be tested [26,27]. From a practical point of view it would also be useful to deter-mine how many clusters or nodes are necessary to achieve a good projection of the data points.
4. CONCLUSIONS
4. CONCLUSIONS
The main contribution of this work is a new computa-tional solution to the construction of semantic maps. The idea is to project points by locating them according to cluster centers. This method can thus be coupled with other methods such as self-organizing maps or Flexer's approach.
The main contribution of this work is a new computa-tional solution to the construction of semantic maps. The idea is to project points by locating them according to cluster centers. This method can thus be coupled with other methods such as self-organizing maps or Flexer's approach.
5. ACKNOWLEDGEMENTS
5. ACKNOWLEDGEMENTS
This work was supported by the CNRS, the University of Strasbourg and the Décrypthon program initiated by the Association Française contre les Myopathies, IBM and the CNRS. We are grateful to all internship students who participated in this work by programming some
parts of it, namely Xavier Brotel, Jérémy Némo Trouslard and Julien Cadet. The authors would like to thank Anne Friedrich, Laurent Philippe Albou and Julie Thompson for helpful suggestions.
REFERENCES
REFERENCES
[1] Bishop, C.M., Svens'en, M. and Williams, C.K.I. (1998) GTM: the generative topographic mapping, Neural Computation, 10, 215-234.
[1] Bishop, C.M., Svens'en, M. and Williams, C.K.I. (1998) GTM: the generative topographic mapping, Neural Computation, 10, 215-234.
[2] Lesteven, K. (1995) Multivariate data analysis applied to bibliographical information retrieval: SIMBAD quality control. Vistas in Astronomy, 39, 187-193
[2] Lesteven, K. (1995) Multivariate data analysis applied to bibliographical information retrieval: SIMBAD quality control. Vistas in Astronomy, 39, 187-193
[3] Kaski, S. (1998) Dimensionality reduction by random mapping: Fast similarity computation for clustering, Proceedings of IJCNN'98, International Joint Conference on Neural Networks, IEEE Service Center, 413-418. [3] Kaski, S. (1998) Dimensionality reduction by random
mapping: Fast similarity computation for clustering, Proceedings of IJCNN'98, International Joint Conference on Neural Networks, IEEE Service Center, 413-418. [4] Lagus, K., Kaski, S. and Kohonen, T. (2004) Mining
massive document collections by the WEBSOM method. Information Sciences, 163, 135-156.
[4] Lagus, K., Kaski, S. and Kohonen, T. (2004) Mining massive document collections by the WEBSOM method. Information Sciences, 163, 135-156.
[5] Chen, C. (2005) CiteSpace II: Detecting and visualizing emerging trends and transient patterns in scientific lit-erature. Journal of the American Society for Information Science,57, 359-377.
[5] Chen, C. (2005) CiteSpace II: Detecting and visualizing emerging trends and transient patterns in scientific lit-erature. Journal of the American Society for Information Science,57, 359-377.
[6] Grimmelstein, M. and Urfer, W.W. (2005) Analyzing protein data with the generative topographic mapping approach. innovations in classification, data science, and information systems, Baier, D. and Wernecke, K.D. Springer Berlin Heidelberg, 585-592.
[6] Grimmelstein, M. and Urfer, W.W. (2005) Analyzing protein data with the generative topographic mapping approach. innovations in classification, data science, and information systems, Baier, D. and Wernecke, K.D. Springer Berlin Heidelberg, 585-592.
[7] Ossorio, P.G, (1966) Classification space: a multivariate procedure for automated document indexing and retrieval. Multivariate Behavioral Research, 1, 479-524.
[7] Ossorio, P.G, (1966) Classification space: a multivariate procedure for automated document indexing and retrieval. Multivariate Behavioral Research, 1, 479-524.
[8] Deerwester, S., Dumais, S.T., Furnas, G.W., Landauer, T. K. and Harshman R. (1990) Indexing by latent semantic indexing. Journal of the American Society for Informa-tion Science, 41, 391-407.
[8] Deerwester, S., Dumais, S.T., Furnas, G.W., Landauer, T. K. and Harshman R. (1990) Indexing by latent semantic indexing. Journal of the American Society for Informa-tion Science, 41, 391-407.
[9] Kohonen, T. (1997) Self-Organizating Maps, Springer- Verlag.
[9] Kohonen, T. (1997) Self-Organizating Maps, Springer- Verlag.
[10] Kohonen, T. (1982) Analysis of a simple self-organizing process. Biological Cybernetics, 44, 135-140.
[10] Kohonen, T. (1982) Analysis of a simple self-organizing process. Biological Cybernetics, 44, 135-140.
[11] Dempster, A., Laird, N. and Rubin, D. (1977) Maximum likelihood from incomplete data via the {EM} algorithm. Journal of the Royal Statistical Society, Ser. B, 39, 249-282.
[11] Dempster, A., Laird, N. and Rubin, D. (1977) Maximum likelihood from incomplete data via the {EM} algorithm. Journal of the Royal Statistical Society, Ser. B, 39, 249-282.
[12] Flexer, A. (1997) Limitations of self-organizing maps for vector quantization and multi-dimensional scaling. Ad-vances in neural information processing systems, 9, 445-451.
[12] Flexer, A. (1997) Limitations of self-organizing maps for vector quantization and multi-dimensional scaling. Ad-vances in neural information processing systems, 9, 445-451.
[13] Sammon J.W. (1969) A non-linear mapping for data structure analysis. IEEE Transactions on Computers, 18, 401-409.
[13] Sammon J.W. (1969) A non-linear mapping for data structure analysis. IEEE Transactions on Computers, 18, 401-409.
[14] Bishop, C.M. and James G.D. (1993) Analysis of multi-phase flows using dual-energy gamma densitometry and neural networks. Nuclear Instruments and Methods in Physics Research, Section A, 327, 580-593.
[14] Bishop, C.M. and James G.D. (1993) Analysis of multi-phase flows using dual-energy gamma densitometry and neural networks. Nuclear Instruments and Methods in Physics Research, Section A, 327, 580-593.
[15] Nguyen, H., Berthommier, G., Friedrich, A., Poidevin, L., Ripp, R., Moulinier, L. and Poch, O. (2008) Introduction to the new Decrypthon Data Center for biomedical data, Proc CORIA', 32-44.
[15] Nguyen, H., Berthommier, G., Friedrich, A., Poidevin, L., Ripp, R., Moulinier, L. and Poch, O. (2008) Introduction to the new Decrypthon Data Center for biomedical data, Proc CORIA', 32-44.
[16] BIRDQL-Wikili,
http://alnitak.u-strasbg.fr/wikili/index.php/BIRDQL [16] BIRDQL-Wikili,
http://alnitak.u-strasbg.fr/wikili/index.php/BIRDQL. [17] Décrypthon: le grid-computing au service de la
[18] (2008) The uniProt consortium. The Universal Protein Resource (UniProt). Nucleic Acids Research, 36, D190- D195.
[19] Titterington, D., Smith, A. and Makov, U. (1985) Statis-tical analysis of finite mixture distribution, John Wiley and Sons.
[20] McLachlan, G. and Basford, K. (1988) Mixture models: inference and applications to clustering, Marcel Dekker. [21] Banfield, J. and Raftery, A. (1993) Model-based
Gaus-sian and non-GausGaus-sian clustering. Biometrics, 49, 803-821.
[22] Celeux, G. and Govaert, G. (1992) A classification EM algorithm for clustering and two stochastic versions, Journal of Computational Statistics and Data Analysis,
14, 315-332.
[23] Mardia, K.V., Kent, J.T. and Bibby, J.M. (1979)
Multi-variate Analysis, Academic Press.
[24] Parzen, E., (1962) On estimation of a probability density function and mode. Annals of Mathematical Statistics, 33, 1065-1076.
[25] Hayashi, M., Imanaka-Yoshida, K., Yoshida, T., Wood, M., Fearns, C., Tatake, R. and Lee, J. (2006) A crucial role of mitochondrial Hsp40 in preventing dilated car-diomyopathy, Nature Medecine, 12, 128-132.
[26] Laguna, M. and Marti, R. (2005) Experimental testing of advanced scatter search designs for global optimization of multimodal functions, Journal of Global Optimization
33, 235-255.