ISSN Online: 2151-1969 ISSN Print: 2151-1950
DOI: 10.4236/jgis.2019.115035 Oct. 18, 2019 567 Journal of Geographic Information System
Separability Analysis of Atlantic Forest
Patches by Comparing Parametric and
Non-Parametric Image Classification
Algorithms
Marcos Roberto Martines1 , Mariana de Paula Garcia Lúcio1, Alexandre D. M. Cavagis2,
Marcel Fantin3, Ricardo Vicente Ferreira4, Matheus Oliveira Alves5, Rogério Hartung Toppa1
1Federal University of São Carlos, UFSCar/NEEPC, São Carlos, São Paulo, Brazil 2Federal University of São Carlos, UFSCar/DFQM, São Carlos, São Paulo, Brazil 3University of São Paulo, USP, São Carlos, São Paulo, Brazil
4Federal University of Triângulo Mineiro, Minas Gerais, Brazil 5Faculdades Associadas de Uberaba, FAZU, Minas Gerais, Brazil
Abstract
The aim of this work was to differentiate Atlantic Forest patches, as well as their spatial distribution, from other tree covers that compose the landscape, by comparing three methods of digital images classification, using techniques of geoprocessing and remote sensing. The study area was a sub-basin of the Iperó River, tributary of the Iperó-Mirim stream, Sarapuí River basin, in Araçoiaba da Serra, State of São Paulo, Brazil. This research has been devel-oped on a Geographic Information System environment platform, using me-dium resolution images from Sentinel-2 Satellite. Three image classification algorithms: Maximum Likelihood Classification (MLC), Support Vector Ma-chines (SVM) and Random Tree (RT) were applied to verify the separability of forest patches, forestry and other uses. The results were analyzed by means of a confusion matrix, accuracy and kappa index, thus showing that the three algorithms were able to successfully differentiate the targets, with the higher efficiency attributed to MLC and the lowest to RT. Overall, the three classifi-ers presented errors, but specifically for the forest patches, the highest accu-racy was obtained from SVM.
Keywords
Atlantic Forest, Land Cover, Image Classification How to cite this paper: Martines, M.R., de
Paula Garcia Lúcio, M., Cavagis, A.D.M., Fantin, M., Ferreira, R.V., Alves, M.O. and Toppa, R.H. (2019) Separability Analysis of Atlantic Forest Patches by Comparing Parametric and Non-Parametric Image Classification Algorithms. Journal of Geo-graphic Information System, 11, 567-578. https://doi.org/10.4236/jgis.2019.115035
Received: July 26, 2019 Accepted: October 15, 2019 Published: October 18, 2019
Copyright © 2019 by author(s) and Scientific Research Publishing Inc. This work is licensed under the Creative Commons Attribution International License (CC BY 4.0).
DOI: 10.4236/jgis.2019.115035 568 Journal of Geographic Information System
1. Introduction
Mapping the Brazilian Atlantic Forest remnants and their stages of succession is a pivotal step for the implementation of several studies, environmental control and management actions [1]. Therefore, the classification of natural patches from the Atlantic Forest biome is fundamental for a wide range of studies, con-sidering that the majority of natural forest remnants are in form of small patches, highly disturbed, isolated, little known and poorly protected [2]. These natural forest patches are constantly pressured by a land cover dynamics, related to expansion and retraction of land uses that modify the landscape by forming a mosaic of forest patches with different sizes and in several stages of succession, isolated by an anthropized matrix [3].
The proposition of methodologies that contemplate this theme allows quan-titative and qualitative evaluations of the remaining patches, as well as their spa-tial distribution [4], being also very important to characterize these natural patches, composed of different arboreal individuals forming a complex vegeta-tion canopy. Among mosaics of different uses that surround these patches, stand out cultivation areas of Eucalyptus spp. (Myrtaceae), Pinus spp. (Pinaceae) and exotic species with commercial purpose, it is fundamental to distinguish among these different tree coverings in order to get an accurate evaluation of truly nat-ural patches from native Atlantic Forest.
In this way, the aim of this research was to evaluate three methods of image classification: Maximum Likelihood Classification (MLC), Support Vector Ma-chine (SVM) and Random Tree (RT) in order to distinguish patches of native vegetation from patches of exotic vegetation through differentiation of their ca-nopies. The application of image classification by remote sensing involves a complex process that encompasses many factors, including the choice of the classification method, which requires checking the accuracy of the results [5].
2. Study Area
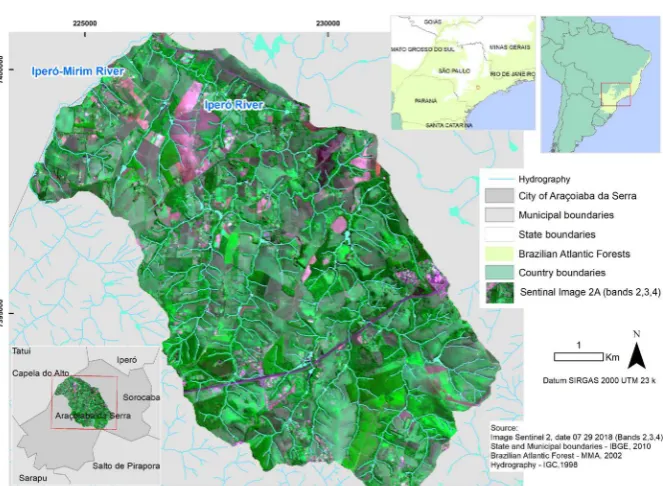
As study area, it was selected a sub-basin of the Iperó River, which is located in the municipality of Araçoiaba da Serra, southeast of the State of São Paulo, Brazil
(Figure 1). It was chosen due to the presence of forests remnants belonging to
the Atlantic Forest Biome [6], which is a biodiversity hotspot [7] that has a geo-referenced database, developed by the Landscape Ecology Studies Center and Conservation (UFSCar-Sorocaba). The Iperó River is a tributary of the Iperó-Mirim stream, which is part of the Sapapuí River basin. It has an area of 4933.23 hectares, with 295 perennial channels distributed in 88,638.19 meters
[8].
3. Materials and Methods
DOI: 10.4236/jgis.2019.115035 569 Journal of Geographic Information System Figure 1. Study Area: A watershed of the Iperó River in Araçoiaba da Serra - State of São Paulo, Brazil.
Forest) and forestry areas (Eucalyptus spp. (Myrtaceae) or Pinus spp. (Pinaceae); 2) an image obtained from the Sentinel-2 Satellite of the GMES Program, with bands 02 to 12 was used as material; 3) then, the selection of samples for the classes: forest patches, forestry and other elements of the landscape was carried out; 4) these samples were used in the Maximum Likelihood Classification (MLC), Suport Vector Machine (SVM) and Random Trees (RT); 5) the test of accuracy of the classifiers was carried out from ground truth collected and ap-plication of statistical indices; 6) the result is a land cover map of each classifica-tion algorithm, regarding the “forest patches”, “forestry” and “other uses” cate-gories.
3.1. Data Acquisition
Images were selected from the Sentinel 2a and 2b Satellite of the year 2018, GMES multi-spectral imaging mission. In this research, twelve multispectral bands were used: B02 (blue), B03 (green), B04 (red) and B08 (near Infrared), with a spatial resolution of 10 meters, and bands 05 to 08A (red edge and infra-red of short waves), with a spatial resolution of 20 meters, resized to 10 m.
3.2. Supervised Image Classification and Selection of Training Samples
DOI: 10.4236/jgis.2019.115035 570 Journal of Geographic Information System supervised classification it is necessary the knowledge of the area studied to al-low the collection of samples for the training of the classifiers. This is made by interpretation of computer screen images, selecting areas known for forming the training set with ground truths for later supervised classification. The result is presented as spectral classes (areas that have similar spectral characteristics), since a target is hardly characterized by a single spectral signature. It consists of a map of graded “pixels”, represented by graphic symbols or colors. The digital classification process converts a large number of gray levels, from each spectral band, into a small number of classes into a single image [9] [10] [11] [12] [13].
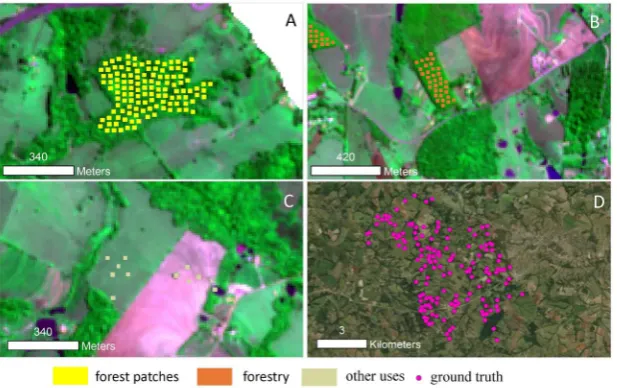
The construction of the set of samples was based on the selection of areas de-fined as “forest patches” (Figure 2(A)), “forestry” (Figure 2(B)) and “other uses” (Figure 2(C)). These groups were created using theoretical assumptions of photo interpretation [14], from the delimitation by training polygon vectors on the Sentinel 2 image. In this procedure, we tried to identify patterns with the greatest variability among the pixels for each set of classes. For the field verifica-tion set, 40 samples were obtained randomly for each class and categorized from Google Earth images (Figure 2(D)).
3.3. Image Classification
The classification of the images was performed by using the parametric algo-rithm MLC and the non-parametric SVM and DT. In the following subsections, a brief explanation of the three algorithms is provided.
3.3.1. Maximum Likelihood Classification (MLC)
[image:4.595.221.530.499.693.2]A maximum likelihood classification algorithm is one of the well-known para-metric classifiers used for supervised classification. It is considered pixel to pixel, since it works from the weighting of distances between the means of the pixels values for each class, using statistical parameters and assuming that all the bands
DOI: 10.4236/jgis.2019.115035 571 Journal of Geographic Information System have normal classification; so, it is estimated the probability of a determined pixel to belong to a determined class [15]. Its great use is bound in its efficiency, because the training classes are used to estimate the shape of the pixels distribution for each class in the space of n bands, as well as the location of the center of each class [16].
3.3.2. Support Vector Machines (SVM)
Support vector machines (SVM) are a set of learning algorithms, used for classi-fication and regression, and are non-parametric classifiers. The theory of statis-tical learning was introduced in the late 1960s and, until the 1990s, it was a purely theoretical analysis of the problem of estimating the function of a given data collection. In the mid-1990s, new types of learning algorithms (called sup-port vector machines), based on the developed theory, were proposed. This has made the theory of statistical learning not only a tool for theoretical analysis, but also a tool to create practical algorithms for estimating multidimensional func-tions [17]. The success of the SVM depends on how well the process is trained. The easiest way to train the SVM is by using linearly separable classes, its func-tioning is based on training to find the optimal hyperplane, by minimizing the upper limit of classification error [18].
3.3.3. Decision Trees (DT)
The Random Trees classifier can be defined as a collection of individual decision trees, generated from different samples and subsets of training data. The basic idea of this type of classifier is to have, for each classified pixel, a number of de-cisions made, based on order of importance, creating a decision tree [19]. The basic structure of the decision tree, however, consists of one root node, a num-ber of internal nodes and, finally, a set of terminal nodes. The data is recursively divided down the decision tree, according to the defined classification frame-work [20].
3.4. Confusion Matrix
The confusion matrix classifies all cases of a model studied into categories. To this end, a classification matrix is created to determine if a predicted value cor-responds to the actual value. In each category, data are counted and the totals displayed in the array [21]. This classification is a standard tool for all statistical models [22].
In this research, data provided by the three algorithms have been compared with the ground truth set. The results were arranged in a two-column table, which provides an effective measure of the classification model, by showing the number of correct classifications versus the classifications predicted for each class, over a set of examples.
3.5. Evaluation of Accuracy
se-DOI: 10.4236/jgis.2019.115035 572 Journal of Geographic Information System lected sample will be correctly classified (Equation (1)) [15]:
1 c kk k x n =
∑
(1) where:C = diagonals of classification and reference; N = total of the classification and reference columns; Xkk = total number of correctly classified points in class.
Two other evaluations can also be derived from the confusion matrix. The accuracy of the reference, which evaluates how much of a particular class has been identified by the classifier (Equation (2)) and the accuracy of the classifier, that evaluates how much of a particular classified class actually belongs to this class, as well as their respective errors of omission and commission (Equation (3)) [15].
1 kk k x K x+
= (2)
2 kk k x K x+
= (3)
where:
K1 = class to be classified; K2 = class to be classified;
Xkk = total number of correctly classified points of class k; X+k = value classified as k;
Xk+ = value belonging to k; 3.6. Kappa Index
The Kappa index is a measure of association to test and describes the degree of reliability and accuracy of a classification (Equation (4)); the index measures the accuracy of the results, based on the confusion matrix of the sorted image and the reference image. Their values range from 0 to 1, where values close to 0 sug-gest an inefficient classification and, next to 1, highly efficient [23].
(
)
(
)
1 1 2 1 r rii i i
i i
r
i i
i
N X X X
K
N X X
+ + = = + + = − ∗ = − ∗
∑
∑
∑
(4)where:
K = Kappa accuracy index; r = number of rows in the array; Xii = number of observations in row i and column j; Xi+ and X+i = marginal totals of row i and column j; N = total number of observations.
4. Results
consi-DOI: 10.4236/jgis.2019.115035 573 Journal of Geographic Information System dered an almost perfect agreement. A total accuracy of 90% was obtained, which means that, within the total of 150 samples, if a sample was chosen randomly, it would have a 90% probability of being correctly classified (Table 1).
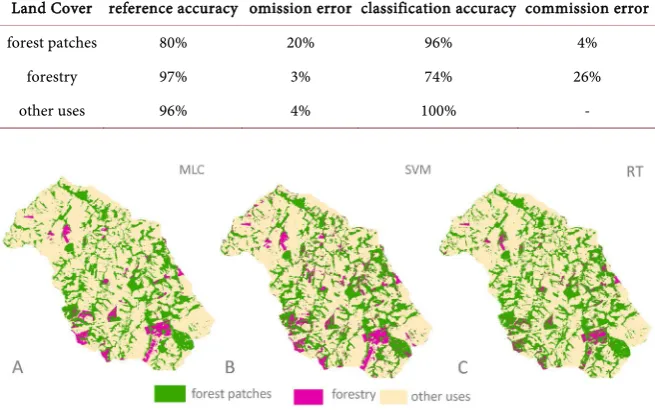
Regarding how much of the class was identified by the classifier (reference accuracy), the “other uses” class achieved the best performance, followed by “fo-restry” and “forest patches”. From the point of view of the number of pixels ac-tually classified in the correct class (classification accuracy), “other uses” ob-tained the best accuracy, followed by “forest patches” and “forestry” (Table 2).
Figure 3(B) shows the classification map of the SVM and Table 3 shows the
confusion matrix for this classifier. The Kappa index was 0.84, considered as an almost perfect agreement, according to Landis and Koch [23]. Regarding the classifier accuracy, the SVM reached 89.3%, only 0.7 of difference from the MLC classification.
[image:7.595.208.540.355.454.2]The accuracy calculation indicated the best performance for “forestry”, fol-lowed by “forest patches” and “other uses”. Regarding the classification perfor-mance, the accuracy calculation showed the best performance for “other uses”, followed by “forest patches”. For “forestry”, the performance presented 30% of
Table 1. Confusion Matrix-maximum likelihood classification.
Map Ground truth
Land Cover forest patches forestry other uses Total
forest patches 48 1 1 50
forestry 12 37 1 50
other uses 0 0 50 50
[image:7.595.210.538.492.697.2]Total 60 38 52 150
Table 2. Classifier accuracy assessment-maximum likelihood classification.
Land Cover reference accuracy omission error classification accuracy commission error
forest patches 80% 20% 96% 4%
forestry 97% 3% 74% 26%
[image:7.595.210.539.495.695.2]other uses 96% 4% 100% -
DOI: 10.4236/jgis.2019.115035 574 Journal of Geographic Information System commission error, which means that there was a significant confusion related to this class (Table 4).
Figure 3(C) shows the ordering of the classes by Random Trees and the
Kap-pa index for the RT classifier, which was 0.49. This result is considered as moderate agreement, considering the quality of the classification (Table 5), ac-cording to Landis and Koch [23].
[image:8.595.210.539.297.399.2]Considering how much of the class was identified by the classifier (reference precision), the “other uses” and “forestry” classes achieved the best perfor-mances, followed by the “forest patches” class. From the point of view of the pixels number actually classified in the correct class (classification accuracy), the “other uses” class obtained the best accuracy, followed by “forest patches” and “forestry”. The “forestry” class obtained a low classifier performance with a commission error of 48 (Table 6).
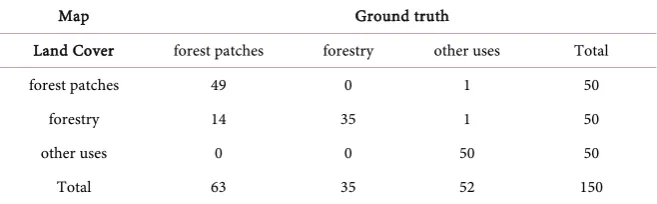
Table 3. Confusion matrix-support vector machine.
Map Ground truth
Land Cover forest patches forestry other uses Total
forest patches 49 0 1 50
forestry 14 35 1 50
other uses 0 0 50 50
[image:8.595.208.540.437.502.2]Total 63 35 52 150
Table 4. Classifier accuracy assessment-support vector machine.
Land Cover reference accuracy omission error classification accuracy commission error
Forest patch 77.7% 22.2% 98% 2%
forestry 100% 0% 70% 30%
[image:8.595.210.540.535.628.2]other uses 96% 4% 100% -
Table 5. Confusion matrix for the random trees classification.
Map Ground truth
Land Cover forest patches forestry other uses Total
forest patches 48 1 1 50
forestry 23 26 1 50
other uses 0 0 50 50
[image:8.595.211.538.670.725.2]Total 71 27 52 150
Table 6. Classifier accuracy assessment-random trees.
Land Cover reference accuracy omission error classification accuracy commission error
forest patches 67.6% 32.3% 96% 4%
forestry 96% 4% 52% 48%
DOI: 10.4236/jgis.2019.115035 575 Journal of Geographic Information System
5. Discussion
Results indicated that MLC classification leaded to the best separability perfor-mance among all classes, although when evaluating the targets individually, it was found that the SVM algorithm leaded to the highest accuracy for the class “forest patches” in relation to the other classifiers considered in this research.
This best performance from the non-parametric SVM algorithm in the classi-fication of the forest patches is in agreement with the research by Kavzogluand Colkesen [24], which studied the application of SVM to classify the land cover of the Gebze district, in Turkey, using Landsat ETM + and Terra ASTER images. Their results showed that SVM outperforms the maximum likelihood classifier, in terms of general accuracy and individual class. Oommen [25] conducted a study on the performance of SVM for Landsat images, comparing two areas: Cuprite, Nevada, and Goodnews Bay, in southwestern Alaska, and concluded that SVM has higher acuity than MLC.
SVM classification was considered less efficient than MLC in relation to the separability of the “forestry” and “forest patches” classes. Although this classifier is non-parametric and considers the textural information of the pixels, which is considered an indicative of a better discrimination between vegetation classes
[26], its potentiality for the separability of classes has not been verified. In the present work, the classifier presented a smaller noise error (salt and pepper ef-fect, being less susceptible to errors, but also classifying erroneously isolated areas).
On the other hand, MLC presented common problems related to pix-el-to-pixel classifications, such as the salt and pepper effect, which are related to noise and classification errors, especially when the spatial contextual informa-tion is not taken into account [27]. Chelotti [28] considers that the performance of the classifiers is influenced by the number of classes; so, the few selected classes associated to the parametric statistics of the MLC may be an indicative of a better classifier effectiveness.
The separability of “forest patches” and “forestry” was less significant when the RT algorithm was used. According to Adam [18], the main hypothesis of such outcome may be related to an inefficiency of the decision tree classification algorithm within the GIS platforms, which is corroborated by results from stu-dies demonstrating a large potential of image classification based on RT algo-rithm [29] [30] [31] [32].
The use of high resolution satellite images should also improve the classifier accuracy, as stated by Jensen [33]; a high radiometric resolution increases the probability of the phenomena to be evaluated by Remote Sensing with more ac-curacy, allowing to identify several pieces of forestry among the forest patches. These enhanced results were obtained only for the MLC and SVM classifiers.
6. Conclusion
DOI: 10.4236/jgis.2019.115035 576 Journal of Geographic Information System importance for actions aiming at conservation and management of this impor-tant biome. In this way, this research contributes to knowledge about image classifiers application for the separability of targets, such as patches of native forest. Therefore, results from the present work show that the three classifiers studied allowed to separate the remaining patches from native Atlantic Forest, with the greatest efficiency observed for the SVM. Furthermore, the conti-nuous refinement of satellite image classification algorithms is an important task, since the enhancement on such methods helps to better identify native forests along fragmented environments, increasing the knowledge and support-ing decision-maksupport-ings, as well as conservation policies. Satellite imagery and au-tomated classifications are important tools, which offer facility and agility in studies involving the mapping of landscape units and represent essential instru-ments for environmental management.
Conflicts of Interest
The authors declare no conflicts of interest regarding the publication of this paper.
References
[1] Ribeiro, M.C., Metzger, J.P., Martensen, A.C., Ponzoni, F.J. and Hirota, M.M. (2009) The Brazilian Atlantic Forest: How Much Is Left, and How Is the Remaining Forest Distributed? Implications for Conservation. Biological Conservation, 142, 1141-1153.https://doi.org/10.1016/j.biocon.2009.02.021
[2] Viana, V.M. (1995) Conservação da biodiversidade de fragmentos de florestas tropicais em paisagens intensivamente cultivadas. In: Abordagens Interdisciplinares para a Conservação da Biodiversidade e Dinâmica do Uso da Terra No Novo Mundo, Anais da Conferencia Internacional.
[3] Pires, V.R., Garcia, M.A., Martines, M.R. and Toppa, R.H. (2016) Análise da estrutura da paisagem para o estabelecimento de estratégias conservacionistas em fragmentos de Mata Atlântica.
[4] Amaral, F.,M.V., Lopes de Souza, A., Soares, V.P., Boechat Soares, C.P., Garcia Leite, H., Martins, S.V. and Moreira de Lana, J. (2009) Avaliação e compação de métodos de classificação de imagens de satélites para o mapeamento de estádios de sucessão florestal. Revista Árvore, 33, 575-582.
https://doi.org/10.1590/S0100-67622009000300019
[5] Lu, D. and Weng, Q. (2007) A Survey of Image Classification Methods and Tech-niques for Improving Classification Performance. International Journal of Remote Sensing, 28, 823-870.https://doi.org/10.1080/01431160600746456
[6] IBGE (2004) Mapa de biomas do Brasil.
[7] Myers, N., Mittermeier, R.A., Mittermeier, C.G., Da Fonseca, G.A. and Kent, J. (2000) Biodiversity Hotspots for Conservation Priorities. Nature, 403, 853-858.
https://doi.org/10.1038/35002501
DOI: 10.4236/jgis.2019.115035 577 Journal of Geographic Information System
[9] Mather, P.M. (1987) Computer Processing of Remotely-Sensed Images. An Intro-duction. GeocartoInternational, 2, 64.https://doi.org/10.1080/10106048709354125
[10] Schowengerdt, R.A. (2006) Remote Sensing: Models and Methods for Image Processing. Elsevier, Amsterdam.
[11] Jensen, J.R. (2009) Remote Sensing of the Environment: An Earth Resource Pers-pective. 2nd Edition, Pearson Education India,Delhi.
[12] Chang, N.B. (2012) Environmental Remote Sensing and Systems Analysis. CRC Press,Boca Raton, FL. https://doi.org/10.1201/b11702
[13] Lillesand, T., Kiefer, R.W. and Chipman, J. (2014) Remote Sensing and Image In-terpretation. John Wiley and Sons., New York.
[14] Marchetti, D.A. (1978) Princípios de fotogrametria e fotointerpretação. Nobel. [15] INPE (Instituto Nacional de Pesquisas Espaciais) (2008) Manuais: Tutorial de
geo-processamento do SPRING. INPE, São José dos Campos.
[16] Meneses, P.R. and Almeida, T.D. (2012) Introdução ao processamento de imagens de sensoriamento remoto. UnB, Brasília, 1-33.
[17] Vapnik, V.N. (1999) An Overview of Statistical Learning Theory. IEEE Transactions on Neural Networks, 10, 988-999.https://doi.org/10.1109/72.788640
[18] Adam, E., Mutanga, O., Odindi, J. and Abdel-Rahman, E.M. (2014) Land-Use/Cover Classification in a Heterogeneous Coastal Landscape Using Rapid Eye Imagery: Evaluating the Performance of Random Forest and Support Vector Machines Clas-sifiers. International Journal of Remote Sensing, 35, 3440-3458.
https://doi.org/10.1080/01431161.2014.903435
[19] Breiman, L. (2001) Random Forests. MachineLearning, 45, 5-32.
https://doi.org/10.1023/A:1010933404324
[20] Quinlan, J.R. (2014) C4. 5: Programs for Machine Learning. Elsevier, Amsterdam. [21] Hay, A.M. (1988) The Derivation of Global Estimates from a Confusion Matrix.
In-ternational Journal of Remote Sensing, 9, 1395-1398.
https://doi.org/10.1080/01431168808954945
[22] Ben-David, A. (2008) Comparison of Classification Accuracy Using Cohen’s Weighted Kappa. Expert Systems with Applications, 34, 825-832.
https://doi.org/10.1016/j.eswa.2006.10.022
[23] Landis, J.R. and Koch, G.G. (1977) The Measurement of Observer Agreement for Categorical Data. Biometrics, 33, 159-174.https://doi.org/10.2307/2529310
[24] Kavzoglu, T. and Colkesen, I. (2009) A Kernel Functions Analysis for Support Vec-tor Machines for Land Cover Classification. International Journal of Applied Earth Observation and Geoinformation, 11, 352-359.
https://doi.org/10.1016/j.jag.2009.06.002
[25] Oommen, T., Misra, D., Twarakavi, N.K., Prakash, A., Sahoo, B. and Bandopad-hyay, S. (2008) An Objective Analysis of Support Vector Machine Based Classifica-tion for Remote Sensing. MathematicalGeosciences, 40, 409-424.
https://doi.org/10.1007/s11004-008-9156-6
[26] Sothe, C., Liesenberg, V., de Almeida, C.M. and Schimalski, M.B. (2017) Aborda-gens para classificação do estádio sucessional da vegetação do parque nacional de são Joaquim empregando imagens landsat-8 e rapideye. Boletim de Ciências Geodésicas, 23, 389-404.https://doi.org/10.1590/s1982-21702017000300026
DOI: 10.4236/jgis.2019.115035 578 Journal of Geographic Information System
[28] Chelotti, G.B. (2017) Mapeamento de uso do solo da bacia hidrográfica do Alto Descoberto, no Distrito Federal, por meio de classificação orientada a objetos com base em imagem do satélite Landsat 8 e softwares livres. Revista Brasileira de Geomática, 5, 172-185.https://doi.org/10.3895/rbgeo.v5n2.5417
[29] Hansen, M.C., DeFries, R.S., Townshend, J.R., Carroll, M., DiMiceli, C. and Sohl-berg, R.A. (2003) Global Percent Tree Cover at a Spatial Resolution of 500 Meters: First Results of the MODIS Vegetation Continuous Fields Algorithm. Earth Interac-tions, 7, 1-15.
https://doi.org/10.1175/1087-3562(2003)007<0001:GPTCAA>2.0.CO;2
[30] Sá, A.C.L., Pereira, J.M.C., Vasconcelos, M.J.P., Silva, J.M.N., Ribeiro, N. and Awasse, A. (2003) Assessing the Feasibility of Sub-Pixel Burned Area Mapping in Miombo Woodlands of Northern Mozambique Using MODIS Imagery. Interna-tional Journal of Remote Sensing, 24, 1783-1796.
https://doi.org/10.1080/01431160210144750
[31] Herold, N., Koeln, G. and Cunnigham, D. (2003) Mapping Impervious Surfaces and Forest Canopy Using Classification and Regression Tree (CART) Analysis. ASPRS
2003 Annual Conference Proceedings, Anchorage, AK,May 2003, 1-7.
[32] Moosmann, F., Nowak, E. and Jurie, F. (2008) Randomized Clustering Forests for Image Classification. IEEE Transactions on Pattern Analysis and Machine Intelli-gence, 30, 1632-1646.https://doi.org/10.1109/TPAMI.2007.70822