warwick.ac.uk/lib-publications
Original citation:
Sgamma, Tiziana, Pape, Judith, Massiah, Andrea J. and Jackson, Stephen D.. (2016) Selection
of reference genes for diurnal and developmental time-course real-time PCR expression
analyses in lettuce. Plant Methods, 12 (1).
Permanent WRAP URL:
http://wrap.warwick.ac.uk/78346
Copyright and reuse:
The Warwick Research Archive Portal (WRAP) makes this work of researchers of the
University of Warwick available open access under the following conditions.
This article is made available under the Creative Commons Attribution 4.0 International
license (CC BY 4.0) and may be reused according to the conditions of the license. For more
details see:
http://creativecommons.org/licenses/by/4.0/
A note on versions:
The version presented in WRAP is the published version, or, version of record, and may be
cited as it appears here.
METHODOLOGY
Selection of reference genes for diurnal
and developmental time-course real-time PCR
expression analyses in lettuce
Tiziana Sgamma
1,2, Judith Pape
1, Andrea Massiah
1and Stephen Jackson
1*Abstract
Background: Real-time quantitative polymerase chain reaction (RT-qPCR) analysis is a low cost and sensitive tech-nique that is widely used to measure levels of gene expression. Selecting and validating appropriate reference genes for normalising target gene expression should be the first step in any expression study to avoid inaccurate results.
Results: In this study, ten candidate genes were tested for their suitability for use as reference genes in diurnal and developmental timecourse experiments in lettuce. The candidate reference genes were then used to normalise the expression pattern of the FLOWERING LOCUS T (FT) gene, one of key genes involved in the flowering time path-way whose expression is known to vary throughout the day and at different stages of development. Three refer-ence genes, LsPP2A-1 (PROTEIN PHOSPHATASE 2A-1), LsPP2AA3 (PROTEIN PHOSPHATASE 2A REGULATORY SUBUNIT A3) and LsTIP41 (TAP42-INTERACTING PROTEIN OF 41kDa), were the most stably expressed candidate reference genes throughout both the diurnal and developmental timecourse experiments. In the developmental experiment using just LsPP2A-1 and LsTIP41 as reference genes would be sufficient for accurate normalisation, whilst in the diurnal experiment all three reference genes, LsPP2A-1, LsPP2AA3 and LsTIP41, would be necessary. The FT expression pattern obtained demonstrates that the use of multiple and robust reference genes for RT-qPCR expression analyses results in a more accurate and reliable expression profile.
Conclusions: Reference genes suitable for use in diurnal and developmental timecourse experiments in lettuce were identified and used to produce a more accurate and reliable analysis of lsFT expression levels than previously obtained in such timecourse experiments.
Keywords: Reference gene, Normalisation, qRT-PCR, Lettuce, Flowering time, FT
© 2016 Sgamma et al. This article is distributed under the terms of the Creative Commons Attribution 4.0 International License (http://creativecommons.org/licenses/by/4.0/), which permits unrestricted use, distribution, and reproduction in any medium, provided you give appropriate credit to the original author(s) and the source, provide a link to the Creative Commons license, and indicate if changes were made. The Creative Commons Public Domain Dedication waiver (http://creativecommons.org/ publicdomain/zero/1.0/) applies to the data made available in this article, unless otherwise stated.
Background
One of the most common techniques for studying gene expression is real-time quantitative polymerase chain reaction (RT-qPCR) analysis because it is extremely sen-sitive, specific and cost-effective. However there are often methodological errors in RT-qPCR application and, as a consequence, in the interpretation of the results [1]. One of the most common errors is the choice of inappropri-ate reference genes used to normalise the expression
of target genes [1–3]. Ideally reference genes would be expressed at a constant level and would thus be repre-sentative of the cDNA concentration in each sample, but their expression is often affected by experimental treatments or can vary in different tissues, or over the time-course chosen for the experiment [4]. In literature there are several genes that are commonly used as refer-ence genes but results often show that each experimen-tal design and each organism requires its own reference genes to be selected and used [2, 3, 5]. Several approaches can be used for a systematic validation of reference genes such as NormFinder, Best-keeper and geNorm [6–8]. These software-based approaches rank a plethora of can-didate reference genes measuring their relative stability
Open Access
*Correspondence: [email protected]
1 School of Life Sciences, University of Warwick, Gibbet Hill Road,
Coventry, West Midlands CV4 7AL, UK
Page 2 of 9 Sgamma et al. Plant Methods (2016) 12:21
by comparing the expression of each gene in each sam-ple in relation to the entire set of reference genes. The best approach is to follow the Minimum Information for Publication of Quantitative Real-Time PCR Experiments (MIQE) guidelines and to use multiple reference control genes, as the use of single reference gene is now consid-ered inappropriate [9].
Recently, a study investigated 17 selected candidate genes and microRNAs (miRNAs) for their suitability to be used as reliable and stable reference genes in RTqPCR analysis of gene expression differences in abiotic stress experiments [10]. Some of these were genes such as
TAP42-INTERACTING PROTEIN OF 41 kDa (TIP41),
ADENOSINE PHOSPHORIBOSYL TRANSFERASE 1
(APT1) and miRNA genes and were selected on the basis that they had been used as reference genes in previously published work [2, 11–13]. The results of the experiments using abiotic stresses such as drought, salinity, UV-C irradiation, heavy metal stress and abscisic acid treat-ments, showed differences in stability between the ref-erence genes [10]. Therefore in any RTqPCR experiment the identification of a good set of reference genes whose expression remains constant throughout the experimen-tal conditions under study is extremely important in order to be able to obtain reliable results.
Lettuce (Lactuca sativa) is a leafy vegetable cultivated throughout the course of the year, it is harvested when plants reach maturity but before they bolt and flower [14]. In order to avoid harvest loss and wastage it is there-fore important to be able to predict and anticipate when the crop will start bolting. Understanding changes in gene expression profiles, in particular those of flowering time genes, throughout development will help to develop predictable cropping.
In this study we wanted to identify suitable reference genes that would have stable expression profiles over diurnal and developmental timecourse experiments
in order to analyse the expression of flowering time genes over these timecourses. Ten reference genes were selected based on genes that had been identified in previ-ous experiments in other species and the stability of their expression profiles over developmental and diurnal time-courses was tested. To demonstrate the reliability and suitability of the reference genes identified, the expres-sion pattern of the FLOWERING LOCUS T (FT) gene, one of key genes involved in the flowering time pathway, was analysed in lettuce leaves sampled over the diurnal and developmental timecourse experiments using the selected reference genes for normalisation.
Results
PCR amplification efficiency and expression profiling of candidate reference genes
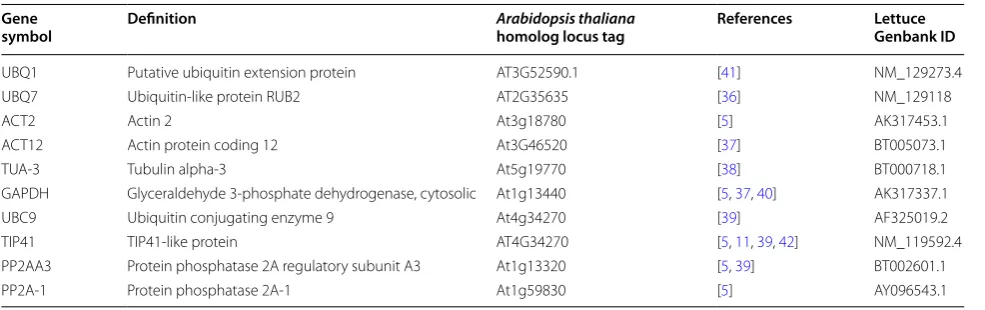
A total of 10 genes were selected as good potential can-didates for reference genes for normalisation of gene expression over diurnal and developmental timecourse experiments based on previous reports of their use as ref-erence genes in other species (Table 1), and on the avail-ability of lettuce homologues in the expressed sequence tag (EST) Compositae Genome Project Database (CGPDB 2013; http://cgpdb.ucdavis.edu/).
Primers were designed to the homologous lettuce genes. The optimum primer concentration and temper-ature were determined for each primer pair (Additional file 1: Table S1). The specificity of each primer set was validated by obtaining just a single melting curve peak for each candidate gene after 40 Real-time quantitative PCR cycles with no signal in the negative samples (Additional file 2: Figure S1). PCR products were sequenced to con-firm the identity of the amplified target sequence. The correlation coefficient (R2) for quality assays is usually set as >0.980 and it represents how well the tested samples fit the regression line generated by the standard curve [15]. All primer pairs, except LsUBQ7F/R and LsPP2A-1F/R,
Table 1 Candidate reference genes selected for testing
Gene
symbol Definition Arabidopsis thalianahomolog locus tag References Lettuce Genbank ID
[image:3.595.56.549.568.723.2]showed an R2 higher than 0.980 ranging between 0.982 and 0.996 (Table 2). The amplification efficiency (E) indi-cates the amplification rate of a template during the reac-tion. The theoretical optimum value is 100 % indicating that the template duplicates in an exponential way and the acceptable range is usually set between 90 and 110 %. [9]. For the 10 reference genes tested the efficiency varied from 90.3 and 105.9 % (Table 2). Therefore, all the primer pairs were deemed sufficiently well designed to use in RT-qPCR experiments.
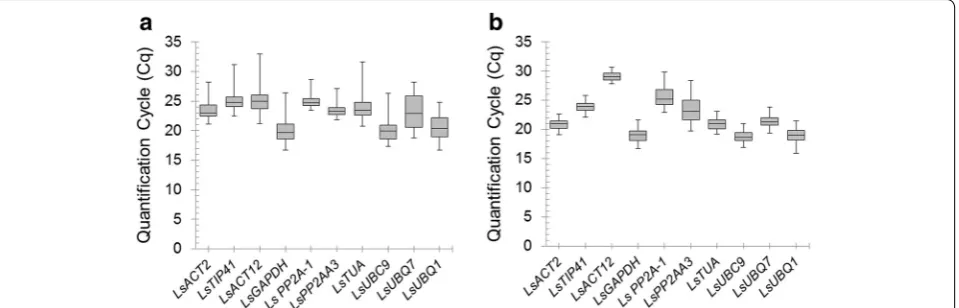
The quantification cycle (Cq) value determined the rel-ative expression levels of the candidate reference genes. The Cq value was used to compare the expression levels of the 10 candidate reference genes in the diurnal and developmental experimental samples. The expression stability of each candidate reference gene is presented in Fig. 1. In the diurnal experiment the Cq value ranged between 16.7 and 32.9, while in the developmental
experiment ranged between 15.9 and 30.6. In both diur-nal and developmental timecourses UBC1, GAPDH and
UBC9 had the highest level of expression, i.e. showed the lowest Cq values with a mean of 20.45, 20.01, 20.03 and 18.99, 18.92, 18.79 in the diurnal and developmen-tal timecourse experiments respectively. LsACT12 was the lowest expressed of the reference genes tested in both experiments showing a Cq mean of 25.07 and 29.07 for the diurnal and developmental timecourse experiments respectively. Over the diurnal timecourse, LsPP2A-1
showed the lowest level of variation in gene expression (coefficient of variation, CV, 4.6 %), while the LsUBQ7
was the most variable (CV, 12.3 %). Over the develop-mental timecourse LsACT12 was the least variable across the Saladin samples (CV, 2.7 %), while LsPP2AA3 was the most variable (CV, 9.6 %).
Stability of candidate reference genes
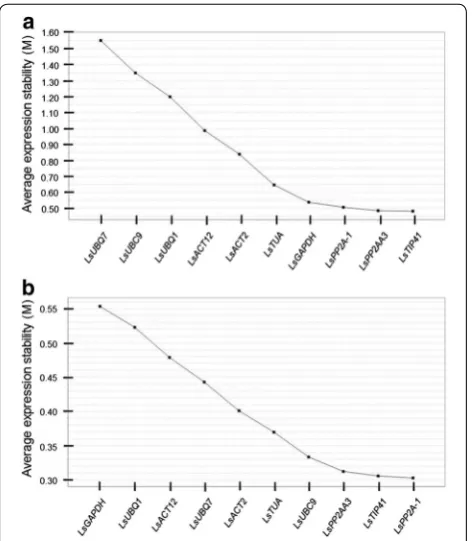
[image:4.595.55.291.344.494.2]The stability of the 10 candidate reference genes was evaluated using geNorm software to calculate the gene average expression stability value (M). GeNorm’s thresh-old for eliminating a gene as unstable was set as M ≥ 1.5 [7]. The expression stability of the candidate reference genes was analysed over both diurnal and developmen-tal timecourse experiments (Fig. 2). The trend observed showed that the selected candidate reference genes were generally more stable over the developmental timecourse experiment than in the diurnal timecourse experiment. Nevertheless, all the candidate reference genes, with exception of LsUBQ7 in the diurnal experiment, had an M value ≤1.5. Interestingly, although the ranking in the two experiments was different, the three most stable candidate reference genes were the same. In each experi-ment, LsPP2A-1, LsPP2AA3 and LsTIP41 had the lowest
Table 2 Candidate reference gene performance at opti-mum concentration
Primers E (%) R2 Amplification factor
LsUBQ1F/R 94.9 0.992 1.95 LsUBQ7F/R 97.3 0.945 1.97 LsACT2F/R 91.3 0.993 1.91 LsACT12F/R 94.0 0.996 1.94 LsTUA-3F/R 90.3 0.994 1.90 LsGAPDHF/R 91.9 0.991 1.92 LsUBC9F/R 98.0 0.986 1.98 LsTIP41F/R 91.6 0.996 1.92 LsPP2AA3F/R 96.8 0.982 1.97 LsPP2A‐1F/R 105.9 0.920 2.06
[image:4.595.61.541.533.687.2]Page 4 of 9 Sgamma et al. Plant Methods (2016) 12:21
M value, indicating that these three genes were the most suitable reference genes to use for normalization in diurnal and developmental timecourse experiments in lettuce.
GeNorm also provides information about the optimum number of reference genes to be used in the experiment according to the pairwise variation (V). A cut-off of 0.15 is usually applied [7]. In the diurnal timecourse experi-ment, the optimum number of references genes to use is 3 (geNorm V < 0.15) (Fig. 3a). In this experimental situation the optimal normalization factor would be cal-culated as the geometric mean of the expression of the reference genes LsPP2A-1, LsPP2AA3 and LsTIP41. In the developmental timecourse experiment, it would be fine to use just two reference genes (geNorm V < 0.15) (Fig. 3b). In this case the reference genes LsPP2A-1 and
LsTIP41 would be sufficient for accurate normalization.
Validation of the reference genes
FT is one of the key genes involved in the flowering time pathway whose expression varies over a diurnal and developmental timecourse. We used the lettuce FT hom-ologue (LsFT) to evaluate the reliability of the selected reference genes to normalise its expression in diurnal and developmental timecourse RT-qPCR analyses. LsPP2A-1,
LsPP2AA3 and LsTIP41 were used as optimal reference genes in the diurnal time-course. LsPP2A-1 and LsTIP41
were used as optimal reference genes in the developmen-tal time-course.
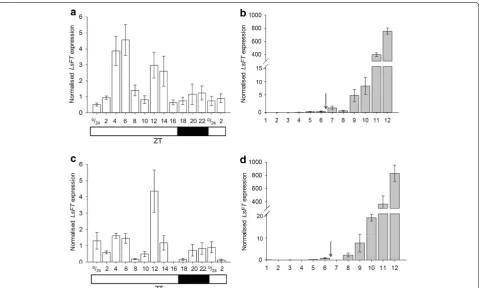
In the diurnal time-course normalised LsFT expres-sion exhibited two peaks, one at around ZT 4–6 and another around ZT 12–14 (Fig. 4a). In the developmen-tal timecourse experiment, LsFT starts to increase two weeks after bolting at sample 9 and a further substantial increase happened after this point reaching a very high level 28 days after bolting (Fig. 4b).
To illustrate the difference in the LsFT expression pat-tern that would be obtained if sub-optimal reference genes were used for normalisation, three commonly used (but the less stable) reference genes, LsUBQ1, LsUBQ7
and LsACT12 were used for a comparative analysis (Fig. 4c, d). In the diurnal time-course normalised LsFT
expression exhibited a different pattern from Fig. 4a with only one peak, around ZT 12 (Fig. 4c). There was, however, little difference observed in the developmen-tal timecourse experiment (Fig. 4b, d) which reflects the overall greater stability of all the candidate reference genes in this experiment compared to the diurnal experi-ment (Fig. 2a, b).
Fig. 2 Average expression stability value (M) calculated by geNORM.
a M of different candidate reference genes over diurnal timecourse samples. b M of different candidate reference genes over develop-mental timecourse samples
[image:5.595.57.295.88.359.2] [image:5.595.306.539.88.332.2]To validate the usefulness of LsPP2A-1, LsPP2AA3 and
LsTIP41 as good reference genes for diurnal experiments, the expression level of another target gene, the lettuce
FLAVIN-BINDING, KELCH REPEAT, F-BOX (FKF1) homologue (LsFKF1) [43], was studied in the diurnal time-course experiment. In the diurnal time-course nor-malised LsFKF1 expression increased from ZT 8 reaching a maximum level at ZT 12, after this point the expression decreased dramatically reaching very low level just before the dark period (Additional file 3: Figure S2).
Discussion
Quantifying gene transcripts using RT-qPCR has become a very widespread technique and there is a great need for a reliable method to analyse and interpret the results [1]. One of the main problems is selecting reliable reference genes to use for normalisation of the expression of the target gene [1–3].
Recently, the need to identify reliable reference genes was presented in a study by Borowski et al. [10] where 17 candidates were studied for their suitability as reference
genes in abiotic stress experiments. Results showed that different abiotic treatments required different reference genes as the stability of the genes was different in dif-ferent experimental situations. The identification of sta-ble reference genes in different experimental contexts is therefore essential in order to obtain accurate and reli-able gene expression data.
In the present study a geNorm approach was used to investigate 10 candidate genes for their potential to be used as reference genes in diurnal and developmental time-course expression experiments in lettuce. GeNorm M values showed that three reference genes, LsPP2A-1,
LsPP2AA3 and LsTIP41, were more constantly expressed throughout both the diurnal and developmental time-course experiments. These reference genes were stable and constantly expressed in all the samples showing that they are not influenced by developmental stage (even the onset of flowering) or diurnal cycles in lettuce. The geNorm V values suggested that in the developmental experiment using just two reference genes LsPP2A-1 and
LsTIP41 would be sufficient for accurate normalisation,
Fig. 4 Normalised expression levels of LsFT. aLsFT expression levels normalised using the three most stable reference genes, LsPP2A-1, LsPP2AA3
and LsTIP41, over the diurnal time-course. The white barbelow indicates lights on, the black bar indicates darkness. bLsFT expression levels
normal-ised against the two most stable reference genes, LsPP2A-1 and LsTIP41, over the developmental time-course. Samples were collected once a week at 14 h after dawn. The arrow indicates when the plants bolted. cLsFT expression levels normalised against three of the least-stable reference genes,
LsUBQ1, LsUBQ7 and LsACT12, over the diurnal time-course. dLsFT expression levels normalised against three of the least-stable reference genes,
[image:6.595.59.539.88.376.2]Page 6 of 9 Sgamma et al. Plant Methods (2016) 12:21
whilst in the diurnal experiment three reference genes (LsPP2A-1, LsPP2AA3 and LsTIP41) would be necessary.
Flowering is one of the major developmental changes that plants undergo during their development. It is tightly regulated and involves many changes in metabolic and developmental pathways [16–18]. Therefore finding reference genes that do not fluctuate during this pro-cess that can be used as reference genes to examine the expression of genes involved in the flowering pathway is very important. PP2AA3, is a catalytic subunit of serine/ threonine protein phosphatase or PP2A-1, an enzyme that remove phosphatase groups from the given substrate [19, 20]. TIP-41 is a tonoplastic intrinsic protein, a type of membrane protein channel that allows the movement of water and amino acids from the tonoplastic interior to the cytoplasm [21]. The constant expression of these genes throughout development and during the day is probably due to the essential role they play in cells at all developmental stages. We can speculate that these refer-ence genes could be good candidate referrefer-ence genes for similar time course studies in other species, for example it is interesting to note that these three reference genes (LsPP2A-1, LsPP2AA3 and LsTIP41) were also identified as three of the most stable genes in Affymetrix Gene-Chip developmental timecourse data [5], but the stabil-ity of these candidate reference genes would still need to be checked for particular species and the specific experi-mental conditions used.
To demonstrate that these genes are good reference genes for RT-qPCR diurnal and developmental time-course experiments in lettuce, the expression profile of
LsFT was studied in these timecourse experiments. FT
has been isolated and studied in several plants as well as in lettuce [22–27], and it has been shown to be repressed during the juvenile phase and promoted during the adult vegetative phase of development [28, 29]. In Arabidopsis,
FT expression is promoted principally by CONSTANS at the end of a long day but other diurnal patterns have been observed in other plants [30–34]. In lettuce LsFT expres-sion has been studied during development in sequentially growing leaves showing an increase in expression. FT
diurnal expression was also studied and it showed a peak in expression at the beginning and at the end of the day with a trough in expression at ZT = 6 [27]. These RTqPCR experiments however used only one reference gene, beta-tubulin (BTUB1), to normalise FT expression. Our results using the averaged value of three reference genes revealed a different FT diurnal expression pattern which peaks twice during the day at ZT 4–6 and at ZT 12–14 (Fig. 4a). This expression pattern differs to the diurnal pattern of
LsFT previously observed by Fukuda et al. [27] and thus demonstrates the value of selecting multiple robust refer-ence genes for RT-qPCR expression analyses.
To demonstrate that a poor selection of reference genes can affect the expression pattern obtained, three of the less stable reference genes from our analysis, LsUBQ1,
LsUBQ7 and LsACT12 were used in a comparative anal-ysis of the expression profile of LsFT in the same time-course experiments (actin and ubiquitin being reference genes used most routinely in RT-qPCR studies [10]). This showed that using reference genes with low stability and high M values (such as LsUBQ1, LsUBQ7 and LsACT12
in the diurnal experiment) will give a very different out-come, however if they have low M values as in the devel-opmental experiment where they were more stable then the result is not greatly affected.
Validation of LsPP2A-1, LsPP2AA3 and LsTIP41 as good reference genes for diurnal studies was confirmed using a second target gene, the clock-controlled FLAVIN
-BINDING, KELCH REPEAT, F-BOX (FKF1) [44]. Previ-ous northern blotting analysis in Arabidopsis showed that FKF1 expression levels in LDs start to increase at ZT 7 and reach a peak around ZT 10, and then decrease before dark at ZT 16 [45]. In our diurnal time-course the normalised expression of the lettuce homologue,
LsFKF1, shows the same pattern verifying the suitabil-ity of the selected reference genes for such timecourse experiments.
Conclusion
In this study reference genes suitable for use in diurnal and developmental timecourse experiments in lettuce have been identified. The references genes selected have been used to generate a much more detailed and robust analysis of LsFT expression levels in both diurnal and developmental timecourse experiments than has been achieved to date.
Methods
Plant materials, experimental conditions and tissue collection
Lettuce (L. sativa) seeds were sown in Levington F2 compost and covered with vermiculite, before being stratified in the dark at 4 °C for 48 h to achieve uniform germination. After stratification, trays were moved into long day (LD) conditions in the glasshouse (8 h dark and 16 h light) with supplementary lighting provided by high pressure sodium lamps when natural light lev-els went below 300 W/m2. Constant day/night tem-perature of 18 °C/15 °C was maintained. Plants were re-potted into 12.7 cm pots when they reached the 3–4 leaf stage.
constant temperature of 18 °C. The lighting in the cabi-nets was provided by 60 W fluorescent tubes. Every 2 h one leaf from four different plants was collected and then pool together for a total of 15 samples. Sampling was per-formed in duplicate.
For the developmental timecourse experiment, the youngest newly expanded leaf from 5 different plants was harvested. The first harvest was carried out when the plants were 31 days old followed by a harvest each week for 12 weeks, the samples were always collected at the same time of day which was 14 h after lights on. Plants bolted at a timepoint between samples 6 and 7. Sampling was performed in duplicate.
Total RNA isolation and cDNA synthesis
Total RNA was isolated from all samples collected using the Z6-extraction buffer method [35]. RNA concentra-tion and quality was evaluated by spectrometry using A260/A280 ratios, RNA integrity was also evaluated run-ning 1–2 µg of total RNA on 2 % agarose gel. Samples were DNase treated using TURBO DNA-freeTM. PCR amplifications were performed to prove the absence of DNA contamination in the RNA samples using prim-ers for L. sativa elongation factor alpha (LsELFα) [let-tuce EST database—CGP2 project:CLS_S3_Contig4947] (Additional file 1: Table S1). PCR reactions used KOD Hot Start DNA Polymerase and consisted of an initial denaturation at 94 °C for 2 min, denaturation at 94 °C for 15 s, annealing for 30 s, and extension at 72 °C for 30 s for 30 cycles. First-strand cDNA was synthesised from 3 µg cleaned total RNA using iScript™ cDNA synthesis kit fol-lowing the manufacturer’s guidelines and subsequently treated with RNase H.
Selection of candidate reference genes and primer design
A total of 10 candidate reference genes were chosen based on previously published papers using reference genes for developmental and diurnal time-course expres-sion studies in other species (Table 1). The reference genes selected were; PUTATIVE UBIQUITIN EXTEN-SION PROTEIN (UBQ1), UBIQUITIN-LIKE PROTEIN RUB2 (UBQ7), ACTIN 2 (ACT2), ACTIN PROTEIN CODING 12 (ACT12), TUBULIN ALPHA-3 (TUA-3),
GLYCERALDEHYDE 3-PHOSPHATE
DEHYDROGE-NASE, CYTOSOLIC (GAPDH), UBIQUITIN
CONJU-GATING ENZYME 9 (UBC9), TIP41-LIKE PROTEIN
(TIP-41), PROTEIN PHOSPHATASE 2A REGULATORY
SUBUNIT A3 (PP2AA3) and PROTEIN PHOSPHATASE
2A-1 (PP2-A1) [11, 36–42].
For each candidate reference gene, a blast search was carried out in the expressed sequence tag (EST) Compositae Genome Project Database (CGPDB 2013;
http://cgpdb.ucdavis.edu/) against L. sativa coding DNA sequences using the Arabidopsis homolog as a query. The coding sequences of the matching contings were then retrieved and used to design primers using Primer3Plus (http://primer3plus.com/cgi-bin/dev/primer3plus.cgi) according to the following parameters: annealing temper-ature (Ta) of 60–67 °C with an ideal Ta of 65 °C, GC con-tent of 45–55 %, an optimum primer length of 20–26 bp and a maximum product size of 200 bp. The secondary structure of the amplicons was examined using Mfold (http://mfold.rna.albany.edu/?q=mfold) so that ampli-con sequences could be selected that didn’t have any secondary structure at the primer binding sites. Primer sequences and relevant information are shown in Addi-tional file 1: Table S1.
The presence of any primer dimers and non-specific amplification was identified post-PCR through analysis of melting curve data and by sequencing the amplified products to confirm their identity.
Real‑time quantitative PCR
RT-qPCR analysis was conducted using the Bio-Rad CFX384 TouchTM Real-time PCR machine (Bio-Rad). Each reaction contained 5 μl Sso Advanced™ SYBRH Green Supermix, 0.5 μl cDNA, and forward and reverse primers in the appropriate concentration (Additional file 1: Table S1), in a total volume of 10 µl made up with sterile distilled water. Amplification conditions were as follows: 95 °C for 3 min followed by 40 cycles of 10 s at 95 °C and 30 s at the primer specific Ta (Additional file 1: Table S1). The melting curve was obtained by melting the amplified template from 65 to 95 °C increasing the tem-perature by 0.5 °C per cycle. No-template controls were included. Three technical replicates were used for each sample. Amplification efficiencies for all primer pairs were evaluated using serial tenfold dilutions of pooled cDNA. MiQE guidelines were followed for analysis [9].
Reference gene stability
Page 8 of 9 Sgamma et al. Plant Methods (2016) 12:21
geNorm analysis, for the developmental experiments, was initiated on 12 samples and 10 reference targets. All samples were measured in the same run for a given refer-ence target. MiQE guidelines were followed for analysis [9].
Validation of reference gene stability
To test and validate the stability of the selected refer-ence genes the expression profile of L. sativa FT (LsFT) [DNA Data Bank of Japan: AB602322] and L. sativaFKF1
(LsFKF1) [43] were investigated in diurnal and devel-opmental time-course experimental leaf tissue samples (Additional file 1: Table S1). RT-qPCR was performed as previously described with the appropriate primer con-centration and annealing temperature (Additional file 1: Table S1). Normalised gene expression was determined using data from the three biological replicates by the geometric mean of the relative quantities for all and for the most stable reference genes according to geNorm results, and using target- and run-specific amplification with qBase Plus software version 2.5 (http://www.bioga-zelle.com/qbaseplus). MiQE guidelines were followed for analysis [9].
Availability of data and materials
The datasets supporting the conclusions of this article are included within the article and its additional file.
Authors’ contributions
TS, AM, and SJ designed the experiments. TS performed the experiments. JP designed the primers used for the real time. TS, AM and SJ wrote the manu-script. All authors read and approved the final manumanu-script.
Author details
1 School of Life Sciences, University of Warwick, Gibbet Hill Road, Coventry,
West Midlands CV4 7AL, UK. 2 Faculty of Health and Life Sciences, De Montfort
University, The Gateway, Leicester LE1 9BH, UK.
Competing interests
The authors declare that they have no competing interests.
Funding
We acknowledge funding for this work from the Biotechnology and Biological Sciences Research Council (BBSRC Grant No. BB/G007330/1).
Additional files
Additional file 1: Table S1. Primers used in this study.
Additional file 2: Figure S1. Candidate reference genes melting curve analysis. Melting curve analysis for each primer set for each candidate reference gene after 40 Real-time quantitative PCR cycles.
Additional file 3: Figure S2. Normalised expression levels of LsFKF1.
LsFKF1 expression levels normalised against the three more stable refer-ence genes, LsPP2A-1, LsPP2AA3 and LsTIP41, over the diurnal time-course. The white bar below indicates lights on, the black bar indicates darkness.
Received: 7 December 2015 Accepted: 14 March 2016
References
1. Udvardi MK, Czechowski T, Scheible W. Eleven golden rules of quantita-tive RT-PCR. Plant Cell. 2008;20(7):1736–7.
2. Gutierrez L, Mauriat M, Pelloux J, Bellini C, van Wuytswinkel O. Towards a systematic validation of references in real-time RT-PCR. Plant Cell. 2008;20(7):1734–5.
3. Gutierrez L, Mauriat M, Guenin S, Pelloux J, Lefebvre J, Louvet R, et al. The lack of a systematic validation of reference genes: a serious pitfall undervalued in reverse transcription-polymerase chain reaction (RT-PCR) analysis in plants. Plant Biotech J. 2008;6(6):609–18.
4. Bustin SA, Benes V, Nolan T, Pfaffl MW. Quantitative real-time RT-PCR—a perspective. J Mol Endocrinol. 2005;34(3):597–601.
5. Czechowski T, Stitt M, Altmann T, Udvardi MK, Scheible WR. Genome-wide identification and testing of superior reference genes for transcript normalization in Arabidopsis. Plant Physiol. 2005;139(1):5–17.
6. Andersen CL, Jensen JL, Orntoft TF. Normalization of real-time quantita-tive reverse transcription-PCR data: a model-based variance estimation approach to identify genes suited for normalization, applied to bladder and colon cancer data sets. Cancer Res. 2004;64(15):5245–50. 7. Vandesompele J, Preter KD, Pattyn F, Poppe B, Roy NV, Paepe AD,
et al. Accurate normalization of real-time quantitative RT-PCR data by geometric averaging of multiple internal control genes. Genome Biol. 2002;3:1–12.
8. Pfaffl MW. A new mathematical model for relative quantification in real-time RT-PCR. Nucleic Acids Res. 2001;29(9):e45.
9. Bustin SA, Benes V, Garson JA, Hellemans J, Huggett J, Kubista M, et al. The MIQE guidelines: minimum information for publication of quantitative real-time PCR experiments. Clin Chem. 2009;55:611–22.
10. Borowski JM, Galli V, da Silva Messias R, Perin EC, Buss JH, e Silva SD, Rom-baldi CV. Selection of candidate reference genes for real-time PCR studies in lettuce under abiotic stresses. Planta. 2014;239(6):1187–200.
11. Exposito-Rodriguez M, Borges AA, Borges-Perez A, Perez JA. Selection of internal control genes for quantitative real-time RT-PCR studies during tomato development process. BMC Plant Biol. 2008;8:131.
12. Kulcheski FR, Marcelino-Guimaraes FC, Nepomuceno AL, Abdelnoor RV, Margis R. The use of microRNAs as reference genes for quantitative poly-merase chain reaction in soybean. Anal Biochem. 2010;406(2):185–92. 13. Wei L, Miao H, Zhao R, Han X, Zhang T, Zhang H. Identification and testing
of reference genes for Sesame gene expression analysis by quantitative real-time PCR. Planta. 2013;237(3):873–89.
14. Zdravkovic JM, Acamovic-Djokovic G, Mladenovic JD, Pavlovic RM, Zdravko-vic MS. Antioxidant capacity and contents of phenols, ascorbic acid, beta-carotene and lycopene in lettuce. Hemijska Industrija. 2014;68:193–8. 15. Feng H, Huang X, Zhang Q, Wei G, Wang X, Kang Z. Selection of suitable
inner reference genes for relative quantification expression of microRNA in wheat. Plant Physiol Biochem. 2012;51:116–22.
16. Massiah A, Adams S, Jackson A, Valdes V, Morris K, Thomas B. Physiological and genetic control of the juvenile phase in Antirrhinum. Comp Biochem Physiol Part A Mol Integr Physiol. 2007;146:S231.
17. Matsoukas IG, Massiah AJ, Thomas B. Florigenic and antiflorigenic signal-ing in plants. Plant Cell Physiol. 2012;53:1827–42.
18. Hong Y, Jackson S. Floral induction and flower formation: the role and potential applications of miRNAs. Plant Biotech J. 2015;13:282–92. 19. Jones TA, Barker HM, Silva EFD, Mayerjaekel RE, Hemmings BA, Spurr NK,
et al. Localization of the genes encoding the catalytic subunits of protein phosphatase-2a to human-chromosome bands 5q23 → Q31 and 8p12 → P11.2, respectively. Cytogenet Cell Genet. 1993;63(1):35–41. 20. Katayose Y, Li M, Al-Murrani SWK, Shenolikar S, Damuni Z. Protein
• We accept pre-submission inquiries
• Our selector tool helps you to find the most relevant journal
• We provide round the clock customer support
• Convenient online submission
• Thorough peer review
• Inclusion in PubMed and all major indexing services • Maximum visibility for your research
Submit your manuscript at www.biomedcentral.com/submit
Submit your next manuscript to BioMed Central
and we will help you at every step:
21. Chrispeels MJ, Agre P. Aquaporins—water channel proteins of plant and animal-cells. Trends Biochem Sci. 1994;19(10):421–5.
22. Hsu C, Liu Y, Luthe DS, Yuceer C. Poplar FT2 shortens the juvenile phase and promotes seasonal flowering. Plant Cell. 2006;18:1846–61. 23. Lifschitz E, Eviatar T, Rozman A, Shalit A, Goldshmidt A, Amsellem Z, et al.
The tomato FT ortholog triggers systemic signals that regulate growth and flowering and substitute for diverse environmental stimuli. Proc Natl Acad Sci USA. 2006;103:6398–403.
24. Hayama R, Agashe B, Luley E, King R, Coupland G. A circadian rhythm set by dusk determines the expression of FT homologs and the short-day photoperiodic flowering response in Pharbitis. Plant Cell. 2007;19(10):2988–3000.
25. Lin M, Belanger H, Lee Y, Varkonyi-Gasic E, Taoka K, Miura E, et al. FLOWER-ING LOCUS T protein may act as the long-distance florigenic signal in the cucurbits. Plant Cell. 2007;19(5):1488–506.
26. Kotoda N, Hayashi H, Suzuki M, Igarashi M, Hatsuyama Y, Kidou S, et al. Molecular characterization of FLOWERING LOCUS T-Like Genes of Apple (Malusdomestica Borkh.). Plant Cell Physiol. 2010;51:561–75.
27. Fukuda M, Matsuo S, Kikuchi K, Kawazu Y, Fujiyama R, Honda I. Isolation and functional characterization of the FLOWERING LOCUS T homolog, the LsFT gene, in lettuce. J Plant Physiol. 2011;168(13):1602–7. 28. Castillejo C, Pelaz S. The balance between CONSTANS and
TEMPRA-NILLO activities determines FT expression to trigger flowering. Curr Biol. 2008;18:1338–43.
29. Sgamma T, Jackson A, Muleo R, Thomas B, Massiah A. TEMPRANILLO is a regulator of juvenility in plants. Sci Rep. 2014;4:3704. doi:10.1038/ srep03704.
30. Suarez-Lopez P, Wheatley K, Robson F, Onouchi H, Valverde F, Coupland G. CONSTANS mediates between the circadian clock and the control of flowering in Arabidopsis. Nature. 2001;410:1116–20.
31. Fujiwara S, Oda A, Yoshida R, Niinuma K, Miyata K, Tomozoe Y, et al. Circa-dian clock proteins LHY and CCA1 regulate SVP protein accumulation to control flowering in Arabidopsis. Plant Cell. 2008;20:2960–71.
32. Hou C, Yang C. Functional analysis of FT and TFL1 orthologs from orchid (Oncidium Gower Ramsey) that regulate the vegetative to reproductive transition. Plant Cell Physiol. 2009;50(8):1544–57.
33. Traenkner C, Lehmann S, Hoenicka H, Hanke M, Fladung M, Lenhardt D, et al. Over-expression of an FT-homologous gene of apple induces early flowering in annual and perennial plants. Planta. 2010;232:1309–24.
34. Shalit A, Rozman A, Goldshmidt A, Alvarez JP, Bowman JL, Eshed Y, Lifschitz E. The flowering hormone florigen functions as a general systemic regulator of growth and termination. Proc Natl Acad Sci USA. 2009;106(20):8392–7.
35. Logemann J, Schell J, Willmitzer L. Improved method for the isolation of RNA from plant tissues. Anal Biochem. 1987;163(1):16–20.
36. Brunner AM, Yakovlev IA, Strauss SH. Validating internal controls for quan-titative plant gene expression studies. BMC Plant Biol. 2004; 4:14 Article No 14.
37. Chandna R, Augustine R, Bisht NC. Evaluation of candidate reference genes for gene expression normalization in Brassica juncea using real time quantitative RT-PCR. PLoS One. 2012;7(5):e36918.
38. Chang E, Shi S, Liu J, Cheng T, Xue L, Yang X, et al. Selection of reference genes for quantitative gene expression studies in Platycladus orientalis (Cupressaceae) using real-time PCR. PLoS ONE. 2012;7(3):e33278. 39. Chen X, Truksa M, Shah S, Weselake RJ. A survey of quantitative real-time
polymerase chain reaction internal reference genes for expression studies in Brassica napus. Anal Biochem. 2010;405(1):138–40.
40. Lovdal T, Lillo C. Reference gene selection for quantitative real-time PCR normalization in tomato subjected to nitrogen, cold, and light stress. Anal Biochem. 2009;387(2):238–42.
41. Reid KE, Olsson N, Schlosser J, Peng F, Lund ST. An optimized grapevine RNA isolation procedure and statistical determination of reference genes for real-time RT-PCR during berry development. BMC Plant Biol. 2006;6:27. 42. Zhu J, Zhang L, Li W, Han S, Yang W, Qi L. Reference gene selection for
quantitative real-time PCR Normalization in Caragana intermedia under different abiotic stress conditions. PLoS ONE. 2013;8(1):e53196. 43. Abbott A. The isolation of flowering time genes from lettuce to enable
the manipulation of bolting time. Ph.D. thesis 2010, University of Warwick. 44. Nelson DC, Lasswell J, Rogg LE, Cohen MA, Bartel B. FKF1, a
clock-con-trolled gene that regulates the transition to flowering in Arabidopsis. Cell. 2000;101(3):331–40.