http://wrap.warwick.ac.uk
Original citation:
Zhang, Huili, Degrève, Jan, Baeyens, Jan and Dewil, Raf. (2015) The voidage in a CFB
riser as function of solids flux and gas velocity. Procedia Engineering, Volume 102 . pp.
1112-1122. ISSN 1877-7058
Permanent WRAP url:
http://wrap.warwick.ac.uk/67265
Copyright and reuse:
The Warwick Research Archive Portal (WRAP) makes this work of researchers of the
University of Warwick available open access under the following conditions.
This article is made available under the Attribution-NonCommercial-NoDerivatives 4.0
(CC BY-NC-ND 4.0) license and may be reused according to the conditions of the
license. For more details see:
http://creativecommons.org/licenses/by-nc-nd/4.0
/
A note on versions:
The version presented in WRAP is the published version, or, version of record, and may
be cited as it appears here.
Procedia Engineering 102 ( 2015 ) 1112 – 1122
1877-7058 © 2015 The Authors. Published by Elsevier Ltd. This is an open access article under the CC BY-NC-ND license (http://creativecommons.org/licenses/by-nc-nd/4.0/).
Selection and peer-review under responsibility of Chinese Society of Particuology, Institute of Process Engineering, Chinese Academy of Sciences (CAS) doi: 10.1016/j.proeng.2015.01.234
ScienceDirect
The 7th World Congress on Particle Technology (WCPT7)
The voidage in a CFB riser as function of solids flux and gas velocity
1*
Huili Zhang,
1Jan Degrève,
2Jan Baeyens and
3Raf Dewil
1 KU Leuven, Department of Chemical Engineering, Chemical and Biochemical Process Technology and Control Section, De Croylaan 46, Heverlee, 3001, Belgium
2University of Warwick, School of Engineering, Coventry CV4 7AL, United Kingdom
3KU Leuven,Department of Chemical Engineering, Process and Environmental Technology Lab, J. De Nayerlaan 5, Sint-Katelijne-Waver, 2860, Belgium;
Abstract
Circulating Fluidised Beds (CFBs) are widely applied in the process industry, for mostly gas-solid and gas-catalytic reactions. The riser is the key component of the CFB being the process reactor. The important design parameters are the operating gas velocity (U) and the solids concentration flux (G). The CFB operation starts at moderate to high superficial gas velocities. Its voidage exceeds ~ 0.9 and is a function of the solids circulation flux. Different flow modes have been presented in literature, and result in an operation diagram where G and U delineate specific operations, from dilute riser flow, through core-annulus flow, to dense riser upflow (mostly at any U, G exceeding 80 to 120 kg m-2s-1). Increasing G whilst maintaining the gas velocity will
cause an increase in suspension concentration. The riser flow can hence be characterized by its apparent voidage, ε. In the core -annulus operation, clusters of particles reflux near the wall, thus influencing the local radial voidage in the cross section of the
riser, and also extending over a given distance, δ, from the wall to the core .
Through measurements in CFBs of 0.1 and 0.14 m I.D., the research has been able to determine the average axial and radial voidages of the dense phase within the different regimes, whilst also determining the thickness of the annulus (in CAF-mode). Experimental results will be illustrated and compared with previous empirical equations, shown to have a limited accuracy only
both for ε, and for the thickness of the annulus in CAF operation. Within the operating conditions tested, results demonstrate that the annulus thickness is about 15 to 20% of the riser diameter in CAF, and that the voidage in the riser is a function of U and G, with riser diameter and distance along the riser length as secondary parameters.
Keywords: circulating fluidized bed, riser, voidage, annulus thickness
© 2014 The Authors. Published by Elsevier Ltd. Selection and peer-review under responsibility of Chinese Society of Particuology, Institute of Process Engineering, Chinese Academy of Sciences (CAS).
* Corresponding author. Tel.: +32 16 32 26 94; fax: +32 16 32 29 91.
E-mail address: [email protected]
© 2015 The Authors. Published by Elsevier Ltd. This is an open access article under the CC BY-NC-ND license (http://creativecommons.org/licenses/by-nc-nd/4.0/).
Nomenclature
D riser diameter, [m] dp particle size, [μm]
G solids circulation flux, [kg/m2s] g gravitational constant, [m/s2] H height of the riser, [m]
U, Ut superficial gas velocity, particle terminal velocity, [m/s] z axial position along the riser height, [m]
ε local voidage, [-]
εb voidage of the turbulent fluidization bottom bed, [-]
δ thickness of the annulus, [m]
ρp,ρb,ρg particle, bulk and gas density, respectively, [kg/m3]
1. Introduction
Circulating Fluidised Beds (CFBs) are widely applied in the process industry, for mostly solid and gas-catalytic reactions. The riser is the key component of the CFB being the process reactor. The important design parameters are the operating gas velocity (U) and the solids concentration flux (G): U and G govern the overall hydrodynamics and the residence times of solids and gas. The CFB operation starts at moderate to high superficial gas velocities. Its voidage exceeds ~0.9 and is a function of the solids circulation flux, G. Different flow modes have been presented in literature, mostly as a result of measuring the axial profile of solids hold-up in the riser, and result in an operation diagram where G and U delineate specific operations, from dilute riser flow, through core-annulus flow, to dense riser upflow (mostly at any U, G exceeding 80 to 120 kg m-2s-1). Increasing G whilst maintaining the gas velocity will cause an increase in suspension concentration. The riser flow can hence be characterized by its
apparent voidage, ε. In the core-annulus operation, clusters of particles reflux near the wall, thus influencing the
local radial voidage in the cross section of the riser, extending over a given distance, δ, from the wall to the core .
[image:3.544.68.500.66.224.2]One of the earliest attempts to differentiate a CFB from other types of fluidised bed applications is shown in Figure 1. The system voidage increases when moving from bubbling, to turbulent and ultimately to CFB.
Figure 1: Expansion/voidage curve for FCC-catalyst [1]
[image:3.544.117.361.431.571.2]the riser [3]. Within the CFB-operation mode, several regimes prevail, from dilute riser flow (DRF), to core-annulus flow (CAF), to dense riser up-flow (DRU). Since a CFB inherently involves the recycling of collected solids, acceleration zones need to be accounted for.
The acceleration length is the vertical distance (within the riser) a solid particle has to accelerate from zero velocity in the vertical direction to a constant upward velocity. The acceleration length significantly contributes to the total pressure drop in the riser [4] by up to as much as 40% of the total pressure drop [5]. The acceleration zone has been studied in detail by Chan et al.[6], showing that it covers a length of 0.2 to 0.4 m only, irrespective of operating gas velocity and/or solids circulation flux.
Increasing the solids mass flux obviously causes a higher pressure drop in the acceleration region if other parameters are kept unchanged. Variation in superficial velocity, does affect the height of the acceleration region [7,8].
[image:4.544.83.456.241.384.2]Depending on the mode of operation, a riser may experience one or two acceleration regions. A riser without a bed at the bottom will only experience one acceleration region, whereas a riser with a significant bed at a bottom will display two acceleration regions, one in the dense phase (IAZ) and the other at the onset of the real riser flow (AZ) [9] as shown in Figure 2.
Figure 2: The acceleration zones at the the bottom of the riser [9]
In general, the acceleration length has little effect on the riser design because the acceleration time and acceleration length are negligibly small relative to the residence time of solids in the riser and the riser length.
Under certain (U, G)-conditions, a turbulent fluidized bed can form at the bottom of the riser. To estimate the characteristics of this bottom bed (pressure drop, height), the knowledge of the voidage is imperative.
The bubbling/turbulent bed at the bottom of the riser has been specifically mentioned and even considered as the prerequisite to a fully developed riser flow [10]. There have been reported incidences under high solid flux and high gas flow whereby the dense bed occupies a significant height of the riser with a small dilute or core-annulus phase at the top: the transition from dense phase to dilute phase actually occurs along the riser column itself [11-13]. There are various papers that predict the bed voidage at the bottom of the riser. King [14] derived a simple equation to predict this voidage, εb:
ߝൌାଵାଶ (1)
2. Experimental set-up and procedures
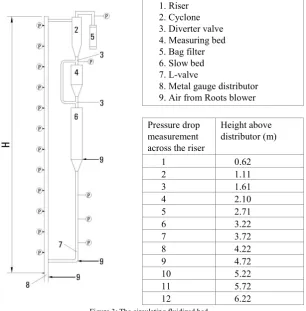
The CFBs used in the experiments are shown in Figure 3. The risers have an I.D of 0.1 and 0.14m. for a total height between distributor and exit of 6.47m. The exit of the riser is sharp. To minimize electrostatic effects, the riser and all other parts of the CFB are electrically grounded. Air from a Roots-blower is fed to the riser through a metal gauge distributor. To prevent clogging of the distributor by oil or dirt, the air is filtered. The distributor and windbox can be disconnected from the riser for easy cleaning.
At the exit of the riser, solids are separated from the air by a high efficiency Stairmand cyclone (>99% efficiency), followed by a bag filter to collect the ultrafines, which are periodically returned to the unit.
The solids recycle loop consists of a fluidized bed (slow bed) to build up pressure and a system to feed the solids back into the riser. The slow bed also provides particle storage. In the experimental rig, the particles discharged from the cyclone first pass through a measuring bed and then in a slow bed. The slow bed has an internal diameter of 0.29m and a height of 1.30m. In most of the experiments, the height of the slow bed is between 0.6 and 0.9m. The bed is fluidized at a superficial velocity just in excess of Umf by air introduced through a tubular distributor with 2mm I.D. orifices facing downwards. The fluidizing air of the slow bed leaves the bed through a pipe at the top into a bag filter for dust removal. Particles can also be fed into the CFB through the slow bed.
For the controlled recycle of solids into the riser, a 63.5mm I.D. standpipe (2.3m vertical) and L-valve (0.75m horizontal length) are used. The air is supplied to the L-valve at 17cm above the elbow.
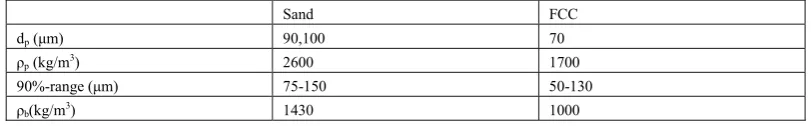
[image:5.544.67.473.328.391.2]The properties of the powders, used in the experimental research, are summarized in Table 1. The rounded sand was supplied by SIBELCO N.V., the FCC is a spent catalyst of Exxon. Average particle sizes were determined by Malvern laser diffractometry.
Table 1: properties of powders used in experiments
Sand FCC
dp(μm) 90,100 70
ρp (kg/m3) 2600 1700
90%-range (μm) 75-150 50-130
ρb(kg/m3) 1430 1000
The gas velocity to the riser was determined by measuring the pressure drop across a standard orifice plane, placed in the line before the distributor. The solids circulation rate leaving the cyclone is measured by diverting the solids to the measuring bed for a given time, using a valve between the measuring and the slow bed. The difference in height of the bed surface of the slow bed is measured. This difference is kept small (maximum 7cm) to minimize the influence on the CFB system. Measured solids are returned into the apparatus whilst in operation.
Pressure tapping were installed at various heights in the riser (every 0.5m), over the L-valve, over the bag filter and above the cyclone (Figure 3). To prevent ingress of power into the measuring lines, the pressure tappings were provided with a glass wool plug. The measuring lines were fixed on a T-piece, connected respectively to a water manometer and a solid state pressure transducer. The transducers were linked to a personal computer via an A/D converter. Pressure gradients along the height of the riser (ΔP/ΔL) were determined. These gradients provide an insight in the axial variation of the average voidage only.
1. Riser 2. Cyclone 3. Diverter valve 4. Measuring bed 5. Bag filter 6. Slow bed 7. L-valve
8. Metal gauge distributor 9. Air from Roots blower
Pressure drop measurement across the riser
Height above distributor (m)
1 0.62
2 1.11
3 1.61
4 2.10
5 2.71
6 3.22
7 3.72
8 4.22
9 4.72
10 5.22
11 5.72
[image:6.544.126.433.67.379.2]12 6.22
Figure 3: The circulating fluidized bed
A better insight in radial (and axial) voidage is provided by tomography. Tomography regroups several techniques, all however with the objective to visualize the internal structure of an object or system in a two- or three-dimensional way, as summarized in Table 2.
All techniques operate according to similar principles:
- a signal is emitted by a source; this signal can be of e.g. electromagnetic, nuclear, acoustical, electrical or other nature;
- depending upon the contents of the studied object, this signal will undergo changes according to physical principles;
- the signal is then detected;
- the difference between emitted and detected signal is a function of the magnitude of the physical property influenced by the signal;
- a 3D picture is obtained by either rotating the object or by installing several detectors; - a computer transforms the signal response according to an appropriate algorithm.
Table 2: Different tomographic techniques and their application in chemical processes and research
Method Property obtained
Nuclear, transmission (X-ray, gamma-ray, neutron) - Imaging multiphase flow and mixing of particles in fluidized beds - Non-destructive testing (NDT)
Nuclear, emission (photon, positron) - Imaging particle mixing - Non-destructive testing (NDT)
Nuclear, dispersion (neutron, Compton gamma-ray) - Determination of volume fractions in liquid/gas flow Optical, transmission - Imaging flow profiles
- Flame analysis
Optical, emission (infrared) - Remote temperature sensing - Plasma analysis
Acoustical, reflection - Imaging two-phase flow Acoustical, sound wave analysis - Imaging cavities
- Remote sensing of temperatures in furnaces - Determination of velocity profiles Acoustical, diffraction - Imaging flow profiles
- Non-destructive testing (NDT) Microwave, diffraction - Remote temperature sensing
- Robot distance sensing - Non-destructive testing (NDT) Nuclear magnetic resonance - Determination of velocity profiles
Electrical, capacitancy - Imaging two-phase flow and particle flow in fluidized beds, downcomers etc. Electrical, resistance - Imaging hydrocyclone flow and mixing
[image:7.544.134.500.177.617.2]- Geophysical exploration Electrical, impedancy - No references until now
3. Results
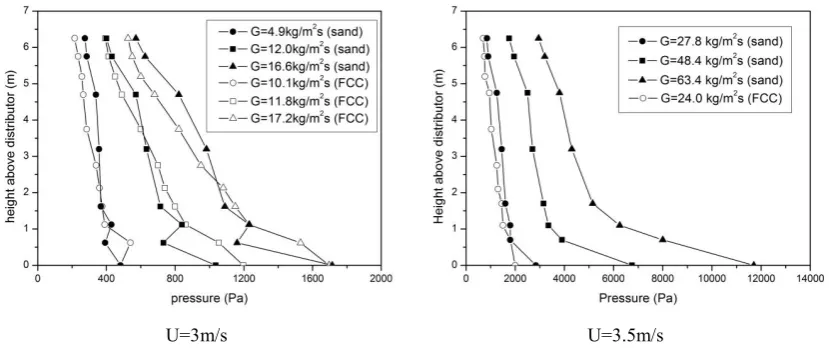
3.1 Pressure gradients along the riser height
Illustration of the obtained results is presented in Figure 5.
[image:8.544.63.478.127.303.2]U=3m/s U=3.5m/s
Figure 5: Pressure drop profiles in the riser
The figures attest to the high solids concentrations (reflected in the measured pressure drops) that can be maintained in the riser at velocities that are a multiple of those normally employed in bubbling beds of the same solids. As mentioned in literature, the voidage is not uniform, with a sharp decrease at the bottom of the riser and a gradual reduction higher up and towards the exit of the riser. Increasing the solid flux or decreasing the gas velocity results in an increase of the solids concentration and this mainly in the bottom part of the riser.
Comparing the pressure drop profiles obtained with sand and FCC, we can conclude that they are very similar although FCC has other flow characteristics than sand, which is especially noticeable for the L-valve flow, where FCC needs a two-point air injection to operate the L-valve.
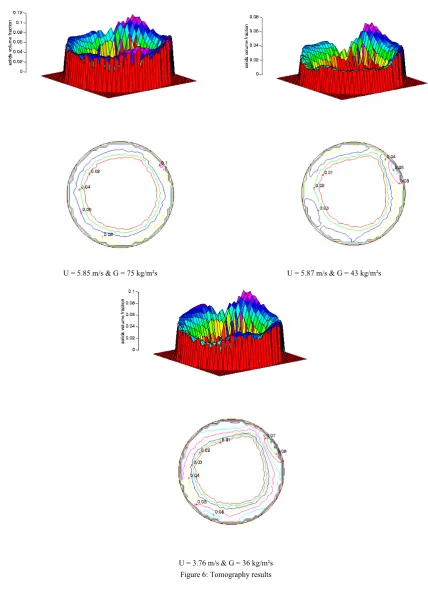
3.2 Tomography
Combined experimental conditions cover the CAF operating mode, with U below 3 and 6m/s for G between 13 and 75kg/m2s. Illustration of the tomographic imaging is given in Figure 6 for some of the indicated conditions and 100μm sand. Similar results were obtained at locations higher up the riser, and for the other powders.
U = 5.85 m/s & G = 75 kg/m²s U = 5.87 m/s & G = 43 kg/m²s
[image:9.544.62.491.62.666.2]4. Discussion
[image:10.544.40.471.113.222.2]Literature offers a number of equations to predict the voidage in the riser flow, as summarized in Table 3.
Table 3. The various empirical equations to predict riser hold-up
References Empirical equations
[17] ͳ െ ɂ ൌ ൬ ୋ
౦ሺି౪ሻ൰ (2)
[18] ͳ െ ɂ ൌ ൬ ଶୋ
౦ିଶୋ൰ (3)
[19] ͳ െ ɂ ൌ ͷǤͲ ൬ ୋ
౦ሺି౪ሻ൰ ଵǤଵଽ
ିǤହ (4)
[20] ͳ െ ɂ ൌ ͳʹǤͷ ൬ ୋ
౦ሺି౪ሻ൰ ଵǤଶହ
൬ඥୈ൰ିǤିǤହ (5)
All empirical correlations significantly overestimate the solids hold-up. Whereas most of the empirical equations for solids hold-up have an average inaccuracy of approximately 50%, predictions by Kunii and Levenspiel [17] show a larger deviation, up to 70%.
To define the respective contributions of the upward core and downward annulus flow, it is important to determine their respective sizes. The core radius depends on the value of the cross-sectional averaged solids hold-up. An “S”
shaped axial distribution of solids concentration characterises the typical flow structure in the system, thus implying that the annulus is thinner the further up the riser.
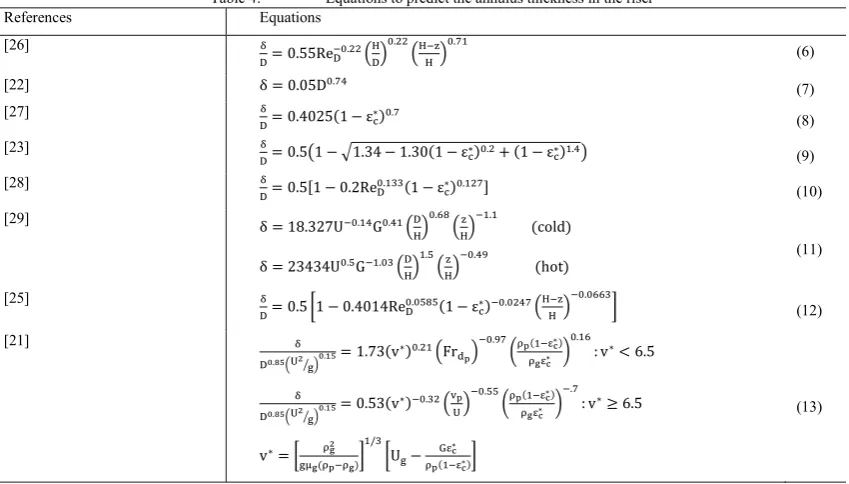
Various papers predict the thickness of the annulus [21-25] ranging between 0% and 20% of the diameter of the riser. Some literature correlations are given in Table 4.
Table 4: Equations to predict the annulus thickness in the riser
References Equations
[26] ஔ
ୈൌ ͲǤͷͷୈ ିǤଶଶቀୌ
ୈቁ Ǥଶଶ
ቀୌିୌቁǤଵ (6)
[22] Ɂ ൌ ͲǤͲͷǤସ
(7)
[27] ஔ
ୈൌ ͲǤͶͲʹͷሺͳ െ ɂୡ כሻǤ
(8)
[23] ஔ
ୈൌ ͲǤͷ൫ͳ െ ඥͳǤ͵Ͷ െ ͳǤ͵Ͳሺͳ െ ɂୡכሻǤଶ ሺͳ െ ɂୡכሻଵǤସ൯ (9)
[28] ஔ
ୈൌ ͲǤͷሾͳ െ ͲǤʹୈ Ǥଵଷଷሺͳ െ ɂ
ୡ כሻǤଵଶሿ
(10)
[29] Ɂ ൌ ͳͺǤ͵ʹିǤଵସǤସଵቀୈ
ୌቁ Ǥ଼
ቀୌቁିଵǤଵሺ ሻ
Ɂ ൌ ʹ͵Ͷ͵ͶǤହିଵǤଷቀୈ ୌቁ
ଵǤହ
ቀୌቁିǤସଽሺሻ (11)
[25] ஔ
ୈൌ ͲǤͷ ͳ െ ͲǤͶͲͳͶୈ Ǥହ଼ହሺͳ െ ɂ
ୡ
כሻିǤଶସቀୌି ୌቁ
ିǤଷ
൨ (12)
[21] ஔ
ୈబǤఴఱቀమൗ ቁబǤభఱൌ ͳǤ͵ሺ כሻǤଶଵቀ
ୢ౦ቁ ିǤଽ
൬౦ሺଵିகౙכሻ ౝகౙכ ൰
Ǥଵ
ǣ כ൏ Ǥͷ
ஔ
ୈబǤఴఱቀమൗ ቁబǤభఱൌ ͲǤͷ͵ሺ כሻିǤଷଶቀ୴౦
ቁ ିǤହହ
൬౦ሺଵିகౙכሻ ౝகౙכ ൰
ିǤ
ǣ כ Ǥͷ
כൌ ౝమ ஜౝሺ౦ିౝሻ൨
ଵȀଷ
െ ୋகౙ כ ౦ሺଵିகౙכሻ൨
(13)
[image:10.544.59.484.353.595.2]predicted and experimental results, Eq.(6), stressing the rather fair prediction by some of the equations, while other equations should be used with great caution.
Table 5: Predicted accuracy by various authors
References ۯܞ܍ܚ܉܍۳઼Ȁ۲
[26] 27%
[22] 85%
[27] 56%
[23] 30%
[28] 151%
[29] 78%
[25] 24%
[21] 36%
5. Conclusions
The study of the hydrodynamics of a two-phase flow targets the determination of the solids hold-up and local solids fluxes. The paper illustrates pressure graduate along the riser height, and first results obtained by using electric capacitance tomography (ECT) to study the radial solids hold-up in the riser. The existence of a core/annulus flow was confirmed. Tomographic images were transformed into values of the voidage across the cross-sectional area of the riser, reaching 0.1 at the riser wall, but being extremely low in the centre of the riser.
References
[1]Avidan, A.A. and Yerushalmi, J., Bed expansion in high velocity fluidization, Powder Technology, 32 (1982), p. 223-232 [2]Chang, H., and Louge, M., Fluid dynamic similarity of circulating fluidized beds, Powder Technology, 70 (1992), p. 259-270
[3]Schnitzlein, M. G., and Weinstein, H.. Design parameters determining solid hold-up in fast fluidized bed system. In: Proceedings of the second international conference on circulating fluidized beds, Basu, P. and J. F. and Large, J.F., (Eds), Compiegne, France. Oxford: Pergamon Press, (1988), p. 205-211.
[4] Patience, G.S., Chaouki, J., Berruti, F. and Wong, R., Scaling considerations for circulating fluidized bed risers., Powder technology, 72 (1992), p. 31-37
[5] Weinstein, H. and Li, J. An evaluation of the actual density in the acceleration section of vertical risers. Powder Technology, 57 (1989), p. 77-79
[6] Chan, C.W., Seville, J., Yang, Z. and Baeyens, J., Particle motion in the CFB riser with special emphasis on PEPT-imaging of the bottom section. Powder Technology, 196 (2009-a), p. 318-325
[7] Gungor, A., Analysis of combustion efficiency in CFB coal combustors. Fuel, 87 (2008), p. 1083-1095
[8] Sabbaghan, H., Sotudeh-Gharebagh R. and Mostoufi, N., Modeling the acceleration zone in the riser of circulating fluidized beds. Powder Technology, 142 (2004), p. 129-135
[9] Smolders, K. and Baeyens, J., Gas fluidized beds operating at high velocities: a critical review of occurring regimes. Powder Technology, 199 (2001), p. 269-291
[10] Kim, S.W., Kirbas, G., Bi, H., Lim, C.J. and Grace, J.R., Flow behaviour and regime transition in a high-density circulating fluidized bed riser. Chemical Engineering Science, 59 (2004-b), p. 3955-3963
[11] Rhodes, M.J., Sollaart, M. and Wang, X.S., Flow structure in a fast fluid bed. Powder Technology, 99 (1998), p. 194-200
[12] Malcus, S., Cruz, E., Rowe, C. and Pugsley, T.S., Radial solid mass profiles in a high-suspension density circulating fluidized bed. Powder Technology, 125 (2002), p. 5-9
[13] Manyele, S.V., Khayat, R.E. and Zhu, J., Investigation of the hydrodynamics of a high-flux CFB riser using chaos analysis of pressure fluctuations. Chemical Engineering and Technology, 25 (2002), p. 801-810
[14] King, D., In: Fluidization VI, Grace, J.R. and Bergougnou, M.A. (Eds.), Engineering Foundation, New York, (1989), p. 1-8
[15] Van de Velden M., Baeyens J., and Smolders, K., Solids mixing in the riser of a circulating fluidized bed, Chemical Engineering Science, 2007, 62, 2139-2153
[16] Van de Velden M., Baeyens J., and Seville J.P.K., Fan X., The solids flow in the riser of a circulating fluidized bed (CFB) viewed by Positron Emission Particle Tracking (PEPT), Powder Technology, 2008, 183, 290-296
[17] Kunii, D. and Levenspiel, O., Flow modelling of fast fluidized beds. In: Circulating Fluidized Bed Technology, Basu, P (Ed) vol III, Pergamon Press, Oxford, (1991), p. 91-98
[18] Pugsley, T.S., Patience, G.S., Berruti, F. and Chaouki, J., Modelling of the oxidation of n-butane to maleic anhydride in a circulating fluidized bed reactor. Industrial and Engineering Chemistry Research, 31 (1992), p. 2652-2660
Bed Technology, Cen, K. (Ed.), vol. VIII, International Academic Publishers, Hangzhou, (2005), p. 209–215
[20] Qi, X, Zhu, J. and Huang, W., A new correlation for predicting solids concentration in the fully developed zone of circulating fluidized bed risers. Powder technology, 188 (2008), p. 64-72
[21] Kim, S.W., Kirbas, G., Bi, H., Lim, C.J. and Grace, J.R., Flow structure and thickness of annular downflow layer in a circulating fluidised bed. Powder Technology, 142 (2004-a), pp. 48-58
[22] Zhang, W., Johnsson, F. and Leckner, B., Fluid-dynamic boundary layers in CFB boilers. Chemical Engineering Science, 50 (1995), p. 201-210
[23] Bi, H.T., Zhou, J., Qin, S.Z. and Grace, J.R., Annular wall thickness in circulating fluidized bed risers. Canadian Journal of Chemical Engineering, 74 (1996), p.811-814
[24] Patience, G.S. and Chaouki, J., Gas phase hydrodynamics in the riser of a circulating fluidized bed. Chemical Engineering Science, 48 (1993), p. 3195-3205
[25] Harris, A.T., Thorpe, R.B. and Davidson, J., Characterisation of the annular film thickness in circulating fluidized risers. Chemical Engineering Science, 57 (2002), p. 2579-2587
[26] Werther, J., In: Circulating Fluidized Bed Technology IV, A.A. Avidan (Ed), AIChE, (1994), p. 1-14 Werther, J., Aue-Klett, C. and Al-Shawabkeh, A., Gas and solids mixing in the bottom zone of a circulating fluidized bed, 7th ICCFB, Niagara Falls, (2002)
[27] Bai, D., Shibuya, E., Masuda, Y., Nishio, K., Nakagawa, N. and Kato, K., Distinction between upward and downward flows in circulating fluidiz ed beds. Powder Technology, 84 (1995) 75-81

![Figure 2: The acceleration zones at the the bottom of the riser [9]](https://thumb-us.123doks.com/thumbv2/123dok_us/9515104.456905/4.544.83.456.241.384/figure-acceleration-zones-riser.webp)