University of Warwick institutional repository:
http://go.warwick.ac.uk/wrap
A Thesis Submitted for the Degree of PhD at the University of Warwick
http://go.warwick.ac.uk/wrap/58643
This thesis is made available online and is protected by original copyright.
Please scroll down to view the document itself.
AUTHOR:Andrew Richard Clough DEGREE: Ph.D.
TITLE:A study on the near-field interactions of ultrasonic surface waves with surface-breaking defects.
DATE OF DEPOSIT: . . . .
I agree that this thesis shall be available in accordance with the regulations governing the University of Warwick theses.
Iagreethat the summary of this thesis may be submitted for publication. I agree that the thesis may be photocopied (single copies for study purposes only).
Theses with no restriction on photocopying will also be made available to the British Library for microfilming. The British Library may supply copies to individuals or libraries. subject to a statement from them that the copy is supplied for non-publishing purposes. All copies supplied by the British Library will carry the following statement:
“Attention is drawn to the fact that the copyright of this thesis rests with its author. This copy of the thesis has been supplied on the condition that anyone who consults it is understood to recognise that its copyright rests with its author and that no quotation from the thesis and no information derived from it may be published without the author’s written consent.”
AUTHOR’S SIGNATURE: . . . .
USER’S DECLARATION
1. I undertake not to quote or make use of any information from this thesis without making acknowledgment to the author.
2. I further undertake to allow no-one else to use this thesis while it is in my care.
DATE SIGNATURE ADDRESS
. . . .
. . . .
. . . .
. . . .
A study on the near-field interactions of
ultrasonic surface waves with
surface-breaking defects.
by
Andrew Richard Clough
Thesis
Submitted to the University of Warwick
for the degree of
Doctor of Philosophy
Department of Physics
Contents
List of Tables v
List of Figures vii
Acknowledgments xviii
Declarations xix
List of publications xx
Abstract xxiii
Chapter 1 Introduction 1
1.1 Nondestructive testing . . . 1
1.2 Nondestructive testing as a tool for research and industry . . . 2
1.3 Overview of nondestructive testing techniques . . . 3
1.3.1 Visual inspection . . . 3
1.3.2 Fibre optic inspection . . . 4
1.3.3 Dye penetrant inspection . . . 5
1.3.4 Magnetic flux leakage inspection methods . . . 6
1.3.5 Electromagnetic radiography . . . 7
1.3.6 Neutron radiography . . . 9
1.3.7 Thermographic inspection . . . 9
1.3.8 Alternating current potential difference (ACPD) method . . . 11
1.3.9 Alternating current field measurement (ACFM) method . . . 12
1.3.10 Eddy current testing . . . 12
1.3.11 Ultrasound . . . 13
1.4 Defects in industrial applications . . . 14
1.4.1 Rolling contact fatigue . . . 14
1.4.3 Laser micromachining for artificial defect manufacture . . . . 19
Chapter 2 Ultrasonic Inspection 20 2.1 Waves in elastic media . . . 21
2.1.1 Elastic behaviour of materials . . . 22
2.1.2 Propagation of ultrasonic bulk waves . . . 26
2.1.3 Shear and longitudinal bulk waves in materials . . . 28
2.1.4 Surface acoustic waves . . . 29
2.1.5 Time frequency representations . . . 37
2.1.6 Waves in cylindrical pipes . . . 39
2.2 Ultrasonic techniques . . . 42
2.2.1 Piezoelectric transducers . . . 42
2.2.2 Air coupled transducers . . . 44
2.2.3 Electromagnetic acoustic transducers . . . 44
2.2.4 Laser generation of ultrasound . . . 46
2.2.5 Laser generation source geometries . . . 50
2.2.6 Laser detection of ultrasound . . . 52
2.2.7 Michelson interferometer . . . 54
2.2.8 Two-wave mixing interferometry . . . 55
2.3 Overview of ultrasonic techniques . . . 58
2.3.1 Near-field ultrasonic enhancement . . . 64
Chapter 3 Experimental and modelling techniques 69 3.1 Experimental setup . . . 70
3.2 Finite element method simulation . . . 76
Chapter 4 Rayleigh wave interactions with surface-breaking defects 85 4.1 Detection of angled surface-breaking defects . . . 85
4.2 Scanning laser detector enhancements from angled defects . . . 87
4.2.1 Scanning laser detection enhancement of Rayleigh waves . . . 88
4.2.2 Rayleigh wave mode conversion at a surface-breaking defect . 97 4.3 Scanning laser detection enhancement . . . 101
4.4 Scanning laser source enhancements from angled defects . . . 107
Chapter 5 Lamb wave detector enhancements for surface-breaking
defects in plates 118
5.1 Experimental details . . . 119
5.2 Defect position from B-scan analysis . . . 122
5.2.1 Defect depth estimation using scanning laser detector near-field enhancements . . . 124
5.3 Mechanisms responsible for near-field enhancement . . . 132
5.3.1 Wave interaction with a square based notch . . . 134
5.3.2 Wave interaction with open mouthed crack . . . 139
5.4 Multi-peaked enhancements . . . 142
5.5 Conclusions . . . 149
Chapter 6 Lamb wave scanning laser source enhancements for the detection of surface-breaking defects in plates 150 6.1 Experimental details . . . 151
6.2 Defect positioning from B-scan analysis . . . 152
6.3 Defect depth estimation using scanning laser source near-field en-hancements . . . 153
6.4 Investigation of the contributing mechanisms to scanning laser source enhancements . . . 157
6.4.1 Truncation Mechanism . . . 157
6.4.2 Superposition mechanism . . . 159
6.4.3 Changing boundary conditions mechanism . . . 163
6.5 Enhancement peak structure . . . 165
6.6 Conclusions . . . 169
Chapter 7 Inspection of real surface-breaking defects 170 7.1 Artificial stress corrosion cracking defects . . . 171
7.1.1 Scanning laser source enhancements . . . 172
7.1.2 Scanning laser detection enhancements . . . 176
7.1.3 Raster scanning of surface-breaking defects . . . 180
7.2 Stress corrosion cracking defects in industrial pipelines . . . 182
7.2.1 Pipework sample A . . . 183
7.2.2 Pipework sample B . . . 188
7.3 Defects in irregularly shaped engine components . . . 193
Chapter 8 Conclusions 198
List of Tables
2.1 A table showing the abbreviated subscript notation for simplifying tensors. . . 24
5.1 Reflected and mode converted wave modes arsising from interaction of an incident A0 was at square based notch; only modes that are present at the enhancement position are shown. . . 135
5.2 Theoretical arrival times for the mode converted and reflected waves expected at the enhancement point, 0.25 mm from the defect edge. . 136
5.3 Interaction coefficients for 50% depth square based notch, at a fre-quency thickness of 1.13 MHz.mm[113]. . . 137
5.4 Phase difference between waves at the enhancement point and the incident pure A0 wave, for a frequency-thickness of 1.3 MHz.mm, for defects with depths of 10%, 50% and 75% of the through-thickness[113].138 5.5 Interaction coefficients for a variety of depths of open mouthed crack
defects for an incident A0 wave mode at a frequency-thickness of 1.3 MHz.mm in a 1.5 mm thick sheet. . . 140
5.6 Calculated beat lengths for interactions between the reflected A0 and A1 waves with the incident S0,vg = 1802 ms−1, wave mode. . . 148
6.1 Arrival times at the detector of the incident, reflected and mode con-verted waves when the laser detector is 52 mm away from the defect, for an incident A0 wave with frequency-thickness of 1.35 MHz.mm. Wave velocities are vA0 = 3172.8 ms−1 and vS0 = 4796.9ms−1. . 160
6.3 Arrival times of reflected waves for the A0 mode as a function of the laser source position relative to the defect. The arrival time of the direct incident wave is 16.39µs. . . 161
7.1 Scanning laser source enhancement factors for region C on figure 7.3 for artificially grown stress defects. . . 174 7.2 Scanning laser detector enhancement factors for region D on figure
List of Figures
1.1 Schematic diagram of a typical experimental setup for optical fibre inspection. . . 5
1.2 Pipework section that has undergone dye penetrant inspection; note the collections of penetrant around areas of rough surface which are liable to give a false defect indication. . . 6
1.3 Schematic diagram of a defect under magnetic particle inspection with magnetic particles attracted to the flux leakage that occurs at a defect site. . . 7
1.4 An example of an experimental setup that could be implemented for electromagnetic or neutron inspection by through-transmission monitoring. . . 8
1.5 Surface-breaking defect imaged by an infra-red camera following the scanning of a continuous wave laser over the defect. This is a cu-mulative image formed from summation of the images from a video sequence, courtesy of Dr. Sue Burrows. . . 10
1.6 Schematic diagram of the process by which an induced electrical current is perturbed by the presence of a surface-breaking defect in ACPD and ACFM. . . 11
1.7 Schematic diagram of the process by which eddy currents are gener-ated within a sample. Image taken from[71]. . . . 12
1.8 Micrograph of RCF defect propagating at an angle of approximately 25◦ from the rail head. Image courtesy of Birmingham University. . 15
1.9 Variation in the reflection (a) and transmission (b) coefficients of the out-of-plane Rayleigh wave component for a defect of varying angle. Image taken from[107]. . . 16 1.10 Micrograph of SCC defect showing complicated branching nature.
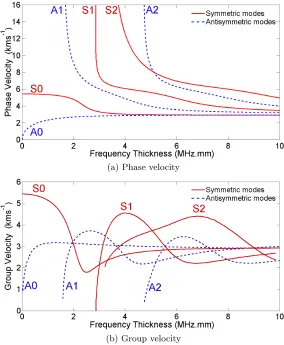
2.1 Phase (a) and group (b) velocity dispersion curves for Lamb wave modes propagating in flat aluminium plates. . . 35
2.2 In-plane and out-of-plane displacement profiles for the S0 (a) and A0 (b) wave modes at fractional through-thickness positions (where
z = 0 is the midpoint of the plate) in a 0.5 mm thick aluminium plate at a frequency-thickness of 1.3 MHz.mm. . . 36
2.3 Sonogram data for laser generated Lamb waves in a 1.5 mm thick plate, with theoretical wave mode arrival times overlaid. The colour scale shows the energy density of the sonogram. . . 39
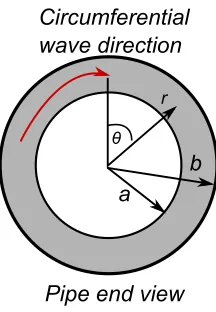
2.4 Cross-section of a cylinder with inner radius a and outer radius b, showing the direction of propagation of the circumferential wave mode. The cylindrical co-ordinate system is also shown, with the z-axis be-ing into the page. . . 40
2.5 Dispersion curves for the lower-order circumferential modes in an aluminium cylinder. Image taken from[89]. . . . 42
2.6 Schematic diagram illustrating the absorption of the incident laser energy within the skin depth of a sample that leads to the formation of a thermal gradient, which in turn produces ultrasonic stresses and strains. . . 49
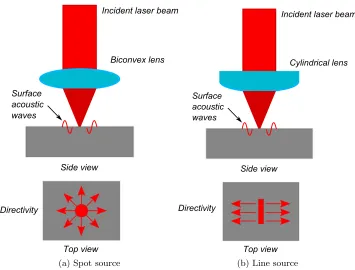
2.7 A schematic diagram of the laser generation optical setups for a cir-cular spot and a line generation source with the resulting ultrasonic directivity. . . 51
2.8 A schematic diagram of a Michelson laser interferometer, used to detect the out-of-plane surface displacement,z. . . 55 2.9 A schematic diagram of the IOS two-wave mixing interferometer, used
to detect the out-of-plane surface displacement,z. . . 58 2.10 A schematic diagram of the arrangement of the fibre optics in the
detector head, with a central emitting fibre surrounded by six receiver fibres. . . 58
2.11 Schematic diagram of pitch-catch (a), pulse-echo (b) and back-wall reflection inspection strategies. . . 59
2.12 A schematic diagram showing the characterisation of a defect using the TOFD technique for waves diffracted at crack tips. . . 63
2.14 An example of near-field ultrasonic enhancement of the peak-to-peak amplitude a of Rayleigh wave as a scanned laser source passes over a 2 mm deep normal defect. . . 66
3.1 A schematic diagram of the optical periscope used to vary the height of the generation laser. . . 71
3.2 The variation in the coupling efficiency of the IOS detector as a func-tion of the standoff from test sample. . . 73
3.3 A schematic diagram showing the experimental setup for a linear scan inspection of a test sample. . . 74
3.4 Experimental setup (a) for a thin plate sample showing the IOS de-tector, laser source generation optics and automated linear stage. A schematic diagram for the sheet holder is also shown (b). . . 75
3.5 A schematic diagram showing the experimental setup for a cicumfer-ential scan on a pipework test sample. . . 76
3.6 Experimental setup (a) and schematic diagram (b) for an irregularly shaped test piece showing the IOS detector mounted on a retort stand and the laser source being directed onto the sample via a right-angled prism held in a three axis moveable holder. . . 77
3.7 An example of a FEM simulation mesh for a Rayleigh wave incident on a v-shaped surface-breaking defect, showing the different boundary conditions applied and the scanning process. The number of nodes shown here is not representative of the true number used in a FEM simulation. . . 78
3.8 An example of a FEM simulation mesh for a Lamb wave incident on a surface-breaking defect, showing the different boundary conditions applied. In this case the defect extends only part of the width of the sample, allowing for a diffracted wave to be observed passing around the defect. . . 79
3.9 A comparison between the wave form structure and subsequent fre-quency content of the experimental data and FEM data produced from a dipole force generation method for a Rayleigh wave in alu-minium. . . 80
3.11 Experimental and FEM A-scans for Lamb wave propagation in 1.5 mm thick aluminium plates. . . 82
3.12 Sonograms showing the frequency content of the experimental (a) and FEM (b) data produced from a 3D dipole force generation method for a Lamb wave propagating in a thin sheet. . . 83
4.1 Schematic diagram of the aluminium blocks used to study angled surface-breaking defects of length 2 mm with linear scanning of the dual laser system, shown here in the scanning laser detection config-uration. . . 88
4.2 Experimental A-scan for a Rayleigh wave incident on a 90◦ defect taken at a distance of 6 mm from the defect, showing reflected and mode converted waves (a) and a time window taken over the incident Rayleigh waves at three different detector positions (b). . . 90
4.3 B-scans for 40◦ (a) and 90◦ (b) angled defects for the case in which the detector is moved over the defect. The incident (Ri), reflected (Rr) and transmitted (Rt) Rayleigh waves are labelled. . . 91
4.4 Peak-to-peak amplitude tracking for a Rayleigh wave incident on surface-breaking defects angled at 40◦ (a) and 90◦ (b) to the sample surface for the case in which the laser detector is moved over the defect. 92
4.5 Amplitude enhancment factors as a function of defect angle for the case in which the laser detector is moved over the defect for experi-mental (a) and FEM simulated (b) data. . . 93
4.6 Frequency B-scans for two different defect angles, 40◦ (a) and 90◦ (b), obtained by stacking FFT data from the Rayleigh wave time window for scanning laser detector experiments. . . 94
4.7 Frequency content of windowed Rayleigh wave for a defect free region. 95
4.8 Magnitude of the frequency content of the time windowed Rayleigh wave at a frequency of 0.98 MHz as a function of detector position for a scanning laser detection experiment over a 40◦angled defect (a) and the variation in frequency enhancement factor at 0.98 MHz as a function of defect angle (b). . . 96
4.10 Scanning detector B-scans for two different defect angles, 40◦(a) and 140◦ (b) with the arrival times of mode converted waves generated at the defect overlaid. . . 101 4.11 A schematic diagram showing the change in material thickness at an
angled defect from the full 50 mm sample thickness in the Rayleigh-like region to a position dependent thickness,z, in a region that sup-ports mode conversion to Lamb waves (a) and a schematic diagram of a scanning laser detection inspection of a wedge sample with a 10◦ apex angle used to validate the existance of Lamb wave mode conversion (b). . . 103 4.12 B-scan showing a Rayleigh wave incident on a wedge sample with a
10◦ apex angle. The theoretical arrival times of mode converted S0 and A0 Lamb waves at frequencies of 0.37 MHz, 0.92 MHz, 1.66 MHz and 1.9 MHz are overlaid. . . 105 4.13 B-scan showing a Rayleigh wave incident on a wedge sample with a
10◦ apex angle. The theoretical arrival times of Lamb waves that are mode converted from A1 and S1 first order Lamb waves at a frequency of 1.0 MHz are overlaid. . . 106 4.14 A schematic diagram illustrating the increase in the region in which
mode conversion to Lamb waves occurs in angled defects, that is observed by the laser detector for a shallow angled defect and a defect that has an angle close to 90◦. . . 107 4.15 B-scans for 40◦ and 90◦ angled defects for the case in which the
source is moved over the defect. . . 108 4.16 Time window taken over the arrival time of the incident Rayleigh
wave for a 90◦ defect for scans taken when the laser line source and the detector are on the same side of the defect (red), when the source is passing over the defect (blue) and when the defect lies between the source and the detector (black). . . 109 4.17 Peak to peak amplitude tracking for a Rayleigh wave incident on
surface-breaking defects angled at 40◦ and 90◦ to the sample surface for the case in which the laser source is moved over the defect. . . . 110
4.18 Amplitude enhancment factors as a function of defect angle for the case in which the laser source is moved over the defect for experimen-tal and FEM simulation data. . . 111 4.19 Scanning laser source frequency B-scans for two different defect
4.20 Magnitude of the frequency content of the time windowed Rayleigh wave at a frequency of 0.98 MHz as a function of source position for a scanning laser source experiment over a 40◦ angled defect (a) and the variation in frequency enhancement factor at 0.98 MHz as a function of defect angle (b). . . 114
4.21 A schematic diagram showing the truncation of a laser line source as it passes over the defect lip for a sudden change in the illuminated area for an acutely angled defect (a) and the more gradual change in the illuminated area for an obtuse defect (b). . . 115
5.1 A schematic diagram showing both plan view and side profile of sim-ple v-shaped defects, of depth x in mm, in aluminium plates. The percentage defect depth is given by h = 1x.5.100%. . . 120 5.2 Top view of machined defects in 0.5 mm (a) and 1.5 mm (b) thickness
sheets, for a 50% through-thickness defect produced by milling with a fine drill tip (a) and by laser micro-machining (b). Defect line profiles are shown as a guide for the eye. . . 121
5.3 Experimental (a) and FEM (b) A-scans for a defect free plate with a thickness of 1.5 mm, showing simultaneous arrival of several Lamb wave modes. . . 122
5.4 B-scan for a 75% through-thickness defect in a 0.5 mm thick sheet with incident (i), reflected (r) and transmitted (t) fundamental Lamb wave modes labelled for both symmetric (S0) and antisymmetric (A0) wave modes. The DC level at the detector is shown and can be seen to drop significantly at the defect position. . . 123
5.5 Lamb wave dispersion curve showing the frequency dependant group velocity of several Lamb wave modes. Two regions of interest for enhancement studies are highlighted, A and B, on the A0 and S0 modes respectively. . . 125
5.6 Sonograms with calculated Lamb wave mode arrival times overlaid for the case where the detector is far away from the defect and for when it passes over the defect for a 75% through-thickness defect in a 1.5 mm thick sheet. . . 126
5.8 FEM modelling peak frequency magnitude tracking for the A0 and S0 fundamental waves as the laser detector is passed over a 75% through thickness defect in a 1.5 mm thick sheet. . . 128
5.9 Enhancement factors as a function of defect through thickness for the A0 fundamental wave mode in 0.5 mm (a) and 1.5 mm (b) aluminium sheets. . . 129
5.10 Enhancement factors as a function of defect through thickness for the S0 fundamental wave mode in 0.5 mm and 1.5 mm aluminium sheets. 130
5.11 Schematic diagrams of the two test models used to approximate the interactions of Lamb waves with a defect. . . 133
5.12 Interaction interfaces for a square based notch defect showing the direction of incident, i, reflected, r, and transmitted, t, waves at each interface. . . 134
5.13 Interaction interface for a open mouthed crack defect showing the direction of incident A0 wave, A0i, reflected A0 wave, A0r,and mode converted S0 wave,S0r. . . 140
5.14 Experimental, modelling and theoretical enhancement factors as a function of defect through-thickness for the A0 fundamental wave mode in 0.5 mm and 1.5 mm aluminium sheets. . . 141
5.15 Multi-peaked signal enhancements for different depth defects; the en-hancement peak position closest to the defect (0 mm) is dictated by the phase change upon reflection. . . 143
5.16 A-scan filtered at 1.63 MHz, showing the waveshapes of the incident A1, A0 and S0 wave modes in a 1.5 mm thick defect free aluminium plate. . . 144
5.17 Resultant waves caused by interference between a simulated incident sinusoidal wave with a reflected wave for an out-of-phase reflection (a) and an in-phase reflection (b). . . 145
5.18 Filtered waveshapes (at 1.63 MHz) at alternate enhanced and non-enhanced positions, illustrating a beating behaviour within the time window of interest as the detector is moved away from the defect. . . 147
6.1 A schematic diagram showing both plan view and side profile of sim-ple v-shaped defects, of depthxin mm, in aluminium plates for scan-ning laser source experiments. The percentage defect depth is given by h = 1x.5.100%. . . 151 6.2 B-scan for a 75% through-thickness defect in a 1.5 mm thick sheet
with incident (i), reflected (r) (only the reflected A0 wave is visible) and transmitted (t) Lamb wave modes labelled for both symmetric (S0) and antisymmetric (A0) wave modes. The DC level of the de-tector signal is shown in the right hand panel. . . 152 6.3 Sonograms with calculated Lamb wave arrival times overlaid for the
case in which the laser source is far away from the defect (a), and for direct illumination of the defect (b) for a 75% through-thickness defect.154 6.4 Experimental peak frequency magnitude tracking for the S0 (a) and
A0 (b) fundamental waves as the laser spot source is passed over a 75% through-thickness defect in a 1.5 mm thick sheet. . . 155 6.5 Enhancement factors as a function of defect depth for v-shaped
de-fects in aluminium plates for the S0 and A0 wave modes. . . 156 6.6 Schematic diagram showing the experimental setup used to
investi-gate the influence of laser source truncation on Lamb wave enhance-ment. The beam profile incident on the sample surface is shown for free generation and partial beam obstruction. . . 158 6.7 Frequency magnitude tracking of the S0 (a) and A0 (b) wave modes
on a defect free sheet as the laser source is truncated. . . 159 6.8 Sonogram for FEM simulated data for Lamb waves incident on a 75%
through-thickness defect taken in the far-field of the defect, showing incident (subscript i) and reflected (subscript r) regions of interest. . 161 6.9 Enhancement factors as a function of defect depth calculated from a
superposition of the incident and reflected waves for the A0 and S0 wave modes in FEM simulations. . . 163 6.10 A schematic diagram showing the scanning laser set-up used to study
the influence of the defect opening angle on the scanning laser source enhancement. . . 164 6.11 Variation in enhancement factor as a function of defect opening angle
for a full-thickness defect. . . 165 6.12 Frequency magnitude tracking of the S0 mode at a frequency-thickness
6.13 Frequency magnitude tracking of the A0 mode at a frequency-thickness of 1.65 MHz.mm for different through-thickness percentage defect depths, each trace has been offset for clarity. . . 167
6.14 Phase differences between reflected and incident waves from FEM simulated data for three frequency-thicknesses within the A0 and S0 regions of interest as a function of the defect depth. . . 168
7.1 Image of artificially grown 3 mm deep defect in 10 mm thick stainless steel plate. . . 171
7.2 Group velocity dispersion curve for Lamb wave modes propagating in flat steel plates (vL=5960 ms−1, vS=3235 ms−1). . . 172 7.3 Sonograms produced from A-scans taken with the laser source away
from the defect (a) and when the source illuminates the defect (b) for a 3 mm deep defect. The colour scale has been adjusted so that the base level is that of the background noise. . . 173
7.4 Peak magnitude tracking in region C for scanning laser source exper-iments for 1.4 mm, 2.3 mm and 3.0 mm deep defects. Scans have been offset to one another for comparison. On the left hand side of the scan both laser source and detector are on the same side of the defect. . . 174
7.5 Sonograms produced from A-scans taken with the laser detector away from the defect (a) and when the detector is close to the defect (b) for a 3 mm deep defect. The colour scale has been adjusted so that the base level is that of the background noise. . . 177
7.6 Peak magnitude tracking in region D for scanning laser detector ex-periments for 1.4 mm, 2.3 mm and 3.0 mm deep defects. Scans have been offset to one another for comparison. On the left hand side of the scan both laser source and detector are on the same side of the defect. . . 178
7.7 Image of the 1.4 mm deep defect used for raster scanning, showing the direction of the raster scan. The image has been rotated by 90◦ to the left, relative to the image in figure 7.8 so as to fit on the page. 180
7.9 A schematic diagram of pipwork sample A (a) and a close-up image of the inspection region showing two stress corrosion defects labelled SCC1 and SCC2 (b). . . 184
7.10 Sonograms produced from A-scans taken with the laser source away from the defect (a) and when the source is close to the defect (b) on pipework sample A, with the regions of interest E and G shown. The colour scale has been adjusted so that the base level is that of the background noise. . . 185
7.11 Peak frequency magnitudes within the sonogram regions for the lower frequency-thickness region E (a), and for the higher frequency-thickness region G (b) for pipework sample A. . . 186
7.12 Product tracking scan formed from the product of the peak frequency magnitude tracking of the low and high frequency-thickness regions in pipework sample A. . . 187
7.13 Enhancement surface map produced from a raster scan over the dam-aged region of pipework sample A. The colour scale has been adjusted so that the base level is that of the background noise. . . 188
7.14 A schematic diagram of pipework sample B (a) and a close-up image of the inspection region showing two stress corrosion defects labelled SCC3 and SCC4 (b). . . 188
7.15 Sonograms produced from A-scans taken with the laser source away from the defect (a) and when the source is close to the defect (b) for a scan across the defect region on pipework sample B. . . 189
7.16 Peak frequency magnitudes within the sonogram regions for the lower frequency-thickness region (a), and for the higher frequency-thickness region (b) for pipework sample B. . . 190
7.17 Product tracking scan formed from the product of the peak frequency magnitude tracking of the low and high frequency-thickness regions in pipework sample B. . . 191
7.18 Enhancement surface map produced from a raster scan over the dam-aged region of pipework sample B. The colour scale has been adjusted so that the base level is that of the background noise. . . 192
7.20 Sonograms produced from A-scans taken with the laser source away from the defect (a) and when the source is close to the defect (b) for a scan across the defect region on the irregularly shaped titanium sample.194 7.21 Peak frequency magnitudes within the sonogram regions for the lower
frequency-thickness region (a), and for the higher frequency-thickness region (b) for the irregularly shaped component. . . 195 7.22 Product tracking scan formed from the product of the peak frequency
magnitude tracking of the low and high frequency-thickness regions for the irregularly shaped component. . . 196 7.23 Enhancement surface map produced from a raster scan over the
Acknowledgments
First and foremost I would like to thank my supervisor Dr. Rachel Edwards
for the excellent guidance, support and advice that she has given me throughout
this project. I would also like to thank Dr. Benjamin Dutton and Dr. Fransisco
Hernandez-Valle without whom the work on Rayleigh waves and real defects would
have taken a lot longer! I would also like to thank the rest of my colleagues in the
Warwick Ultrasound group and my original office for their friendship and ‘witty’
banter that have helped to make the whole PhD experience enjoyable.
A big thank-you to my fianc´e Madison for standing by me each day (even
the exceptionally long ones!) and helping to inspire me to keep going everyday,
your love and support have helped immensely. I would also like to say how glad I
am for the support and faith that my family have kept in me, and how lucky they
were to be spared a read-through of the thesis for spelling mistakes! I would also
like to thank the University of Warwick canoe polo squad for the great fun we’ve
had together over the years and for the opportunity to vent my pent-up energies
generated by long hours in the lab. Thanks finally to any who I have not mentioned
by name, there are so many that it would require an extra chapter to mention them
all.
Lastly, I would like to acknowledge the funding provided by the European
Declarations
The research presented in this thesis is my original work, and was produced
under the supervision of Dr. Rachel Edwards in the Department of Physics at the
University of Warwick, UK between October 2009 and September 2013. Every effort
has been made to accredit all contributions to those who have aided me during my
research, and all consulted literature has been referenced.
No part of this work has been previously submitted to the University of Warwick,
nor to any other academic institution for the purposes of obtaining a higher degree.
Some parts of the work have been published as journal submissions, and a complete
List of publications
1. A. R. Clough and R. S. Edwards. Scanning laser source Lamb wave
enhance-ments for defect characterisation. Under Review. 2013
2. F. Hernandez-Valle, A. R. Clough and R. S. Edwards. Stress corrosion
crack-ing detection uscrack-ing laser/laser and laser/EMAT techniques. Under Review.
2013
3. A. R. Clough and R. S. Edwards. Detection of open and partially closed
surface defects in plates using ultrasonic enhancement. In: AIP Conference
Proceedings, Review of Progress in Quantitative Nondestructive Evaluation.
32A:pp. 367-374. July 2012.
4. F. Hernandez-Valle, R. S. Edwards, A. R. Clough, M. Rosli and B.
Dut-ton. Laser generation and detection for surface wave interaction with different
defect geometries. In: AIP Conference Proceedings, Review of Progress in
Quantitative Nondestructive Evaluation. 32A:pp. 324-329. July 2012.
5. A. R. Clough and R. S. Edwards. Lamb wave near field enhancements for
surface breaking defects in plates. Journal of Applied Physics. 111.p.104906,
2012. DOI: 10.1063/1.4719983
6. R. S. Edwards, B. Dutton and A. R. Clough. Interaction of laser
gener-ated ultrasonic waves with wedge-shaped samples. Applied Physics Letters.
7. R. S. Edwards, R. Perry, D. Cleanthous, D. J. Backhouse, I. J. Moore, A. R.
Clough and D. I. Stone. Measuring elastic constants using non-contact
ultra-sonic transducers. In: AIP Conference Proceedings, International Congress
on Ultrasonics. 1433:pp. 511-514, 2012.
8. R. S. Edwards, A. R. Clough and M. H. Rosli. Detection and
characterisa-tion of surface cracking using scanning laser techniques. In: AIP Conference
Proceedings, International Congress on Ultrasonics. 1433:pp. 563-566, 2012.
9. R. S. Edwards, B. Dutton, A. R. Clough. Scanning laser source and scanning
laser detection techniques for different surface crack geometries. In: AIP
Conference Proceedings, Review of Progress in Quantitative Nondestructive
Evaluation. 1430:pp. 251-258, 2012.
10. R. S. Edwards, B. Dutton and A. R. Clough. Enhancement of ultrasonic
surface waves at wedge tips and angled defects. Applied Physics Letters.
99:p. 249901, 2011. DOI: 10.1063/1.3629772
11. B. Dutton, A. R. Clough, M. H. Rosli and R. S. Edwards. Non-contact
ul-trasonic detection of angled surface defects. NDT & E International. 44:pp.
353-360, 2011. DOI: 10.1016/j.ndteint.2011.02.001
12. B. Dutton, A. R. Clough and R. S. Edwards. Near field enhancements from
angled surface defects: A comparison of scanning laser source and scanning
laser detection techniques. Journal of Nondestructive Evaluation. 30. June
2011. DOI: 10.1007/s10921-011-0091-y
13. A. R. Clough, B. Dutton and R. S. Edwards. Ultrasonic Rayleigh wave
enhancements in aluminium. In: AIP Conference Proceedings, Review of
14. R. S. Edwards, B. Dutton, M. H. Rosli and A. R. Clough. Non-contact
ultra-sonic characterisation of angled surface defects. In: AIP Conference
Proceed-ings, Review of Progress in Quantitative Nondestructive Evaluation. 30A:pp.
Abstract
This thesis is concerned with the detection of surface-breaking defects, such as stress corrosion cracking, using an ultrasonic scanning approach in which a laser source and detector are scanned over the near-field of a defect. Large increases in the amplitude and frequency content of an incident ultrasonic wave are present when either the source or the detector is very close to the defect, leading to a phe-nomenon known as ultrasonic near-field enhancement. The extent of the ultrasonic enhancement varies with defect characteristics such as defect depth and angle to the surface.
Ultrasonic enhancement is observed in both experiment and finite element simulations using Rayleigh waves for both scanning laser detection and scanning laser source methods. The near-field enhancement is shown to vary as a function of the angle of the defect to the horizontal for Rayleigh wave enhancements, allowing the positioning and characterisation of artificial angled defects that are similar to rolling contact fatigue defects in railtrack. The mechanisms behind the near-field enhancement of Rayleigh waves at angled defects are identified, and this aids in the understanding of the behaviour of ultrasound as it interacts with surface-breaking defects.
Ultrasonic enhancements are also reported to be present in individual Lamb wave modes for interactions with artificial open-mouthed defects in thin plates, which are similar to the open end of stress corrosion defects. The mechanisms be-hind both the scanning laser detection and scanning laser source enhancements are identified and used to explain the variation in the enhancement as a function of increasing defect severity. Positioning of these defects is also achieved by identifica-tion of the enhancement locaidentifica-tion.
Chapter 1
Introduction
This thesis is concerned with the development of a dual laser scanning sys-tem that can be used to identify and characterise surface-breaking cracks, with a focus towards partially-closed defects, in a variety of materials, through the use of ultrasonic surface waves. Both Rayleigh and Lamb surface ultrasonic waves are used in this work and interesting phenomena are identified when either the detec-tion or the generadetec-tion laser is passed directly over a defect. An understanding of the physical processes behind these phenomena is developed and used to identify im-portant features of defects, such as their depth, position and geometric alignment. The detection of surface-breaking cracks in such a nondestructive manner allows damaged components to be identified and replaced, preventing costly material fail-ure. The techniques presented here offer an alternative to traditional methods of detecting defects by visual inspection, which may struggle to identify certain types of partially-closed defects.
1.1
Nondestructive testing
spread between components[4,5]. The latter method also has disadvantages in that
regular maintanance may lead to the replacement of perfectly healthy components, thereby increasing the plant running costs. To avoid these issues many industries take a nondestructive testing approach in which the health of components can be regularly monitored, with replacements only made when necessary[6,7].
Nondestructive testing (NDT) involves the inspection of a component or se-ries of components without altering the physical condition of the component. In certain cases this means that testing can be carried out in-situ without the need for removing a component, leaving no adverse side effects for the system[8,9]. Nonde-structive testing can be applied at many different points in the engineering process, from component production[10]to the maintainance of components in use[11]. There are many different nondestructive testing techniques avaliable, all of which aim to give an assessment of a component to determine whether it is still fit for purpose.
The following sections outline some of the various nondestructive testing methods avaliable and provide a brief overview of their applications and merits. There is no ‘magic bullet’ in nondestructive testing and methods are suited to the detection of specific types of defects, such that there are advantages and disadvan-tages to all the techniques presented here.
1.2
Nondestructive testing as a tool for research and
industry
Early detection of defects is vital to many industrial applications to prevent costly economic and environmental damage arising from component failure[12,13]. Many components or systems operate in high stress environments which can precip-itate defect growth from the material surface, meaning that detection of millimetre scale partially-closed defects, such as the stress corrosion cracks detailed in section 1.4.2, is essential[14]. Stress corrosion cracking defects are particularly prevalent in the petrochemical and nuclear industries, but have been reported in many other industries[15,16]. Nondestructive identification and characterisation of these defects allows damaged components to be replaced and minimises plant downtime, allowing smoother and more efficient repairs to take place[17].
Nondestructive techniques have been sucessfully used to monitor many dif-ferent component health issues, including the monitoring of corrosion damage and its resulting wall thickness changes[18,19], monitoring the integrity of welds and
Some of the inspection techniques require direct contact with the sample, which can be challenging for a moving surface or a scanned transducer[23]or in the presence of elevated temperatures[24], and some require surface preparation (for example pol-ishing of the surface or removal of cladding layers) which leads to an extended plant shutdown.
This thesis concentrates on the detection and characterisation of surface-breaking defects, with the eventual aim of detecting small, partially-closed defects without the need for surface polishing. Many different techniques have been applied to surface defect detection, involving both contact techniques, such as ultrasound generated using piezoelectric transducers[25,26] (section 2.2.1), and non-contact
ap-proaches, such as laser ultrasonics[27](section 2.2.4), electromagnetic acoustic trans-ducers (EMATs)[28] (section 2.2.3), thermography[29] (section 1.3.7) and eddy
cur-rent techniques[30] (section 1.3.10), with many more availiable. The ever expanding
range of NDT applications means that research into new techniques is essential to meet the demand for reliable defect detection techniques in industry.
1.3
Overview of nondestructive testing techniques
The following section provides an overview of some of the various nonde-structive techniques employed for the detection of defects. Some of the advantages and disadvantages of each technique are given and help to illustrate the need for continuing research in this area in order to improve the inspection process.
1.3.1 Visual inspection
Visual inspection of a component is the oldest form of nondestructive testing, and in its simplest form involves an experienced tester performing a visual check of a component, usually as a precurser to the application of more rigorous inspection methods. Such inspection is often assisted by magnifying optics but it is still a lengthy, time consuming method, and is sensitive only to large defect sizes[6,7,31]. This form of inspection is usually employed as a means to identify a region of possible component failure in order to reduce the area over which a more detailed inspection is to take place.
probability of the detection of closed cracks by this method is very low[32].
In addition to simple visual surface inspection there exist several methods of optical inspection, one of which is the use of optical-fibre endoscopes to investigate internal structures or components with access issues[6,7]. The flexible endoscope
provides direct imaging of difficult to reach parts of a system without the need for the removal of external casings, and is used in applications such as the inspection of power plants, in which the removal of external cladding would result in a temporary plant shutdown[33]. This inspection method has also been used for the inspection of parts within structures, such as turbine blades, without the need to dismantle the entire assembly, however, it still relies on an experienced operator identifying defects visually. Visual inspection is commonly used to detect defects with sizes of the order of millimetres.
1.3.2 Fibre optic inspection
Changes in the light transmitted through an optical fibre forms the basis of the fibre optic inspection technique. Fibre optics are either positioned on the sam-ple surface or embedded within the structure, and variations in the phase, intensity, polarisation and arrival time of the light transmitted along these fibres are moni-tored. These variations are caused by movement of the material under test, such as that generated by a propagating ultrasonic wave, and allow the measurement of many material variables, such as material strain and pressure variations[34]. This inspection method is popular in civil engineering where sensors require long term placement within a structure, and as fibre optics are highly resistant to corrosion they are the perfect candidate for long term monitoring of civil engineering struc-tures, such as bridges and buildings[35].
At each inspection an ultrasonic wave is propagated into the material and the resulting variations in the propagation of the light in the fibre optic are measured, and recorded as a reference for when no defect is present. Changes in the behaviour of the fibre optic variations are detected when a defect is present in the structure[36].
Figure 1.1: Schematic diagram of a typical experimental setup for optical fibre inspection.
the order of millimetres.
1.3.3 Dye penetrant inspection
Liquid penetrant inspection utilises the propensity for fluids to accumulate around surface discontinuities to identify surface-breaking defects[31,38]. The liquid
penetrant will accumulate through capilliary action in a higher concentration at the position of a surface-breaking crack, and this location is easily identifiable if the con-centration gradient with respect to the non-damaged surface is sufficiently high[31].
The penetrant, usually a brightly coloured or fluorescent liquid, is applied to the material under test and after a short delay any excess liquid that is not drawn into a defect is removed. A secondary liquid known as a developer is then applied, allowing the location of the residual penetrant to be clearly identified, usually with a change of colour[7].
The success of penetrant testing depends on the test material and the pene-trant chosen, and variations in porosity or surface condition can produce erroneous results[39]. The liquid needs to be fully removed in order to prevent contamination or corrosion of the system after testing is complete. The advantages of penetrant inspection lie in the fact that it is cheap, portable, requires little time to apply, and gives reliable defect locations, with some degree of information about the size and shape of the defects.
Figure 1.2: Pipework section that has undergone dye penetrant inspection; note the collections of penetrant around areas of rough surface which are liable to give a false defect indication.
surface region in the middle of the image. Penetrant testing is limited to components at moderate temperatures and in most cases will involve the removal of cladding, or a surface layer such as paint. Penetrant testing has been used in many areas of industry, including quality control of nuclear power plants, in which large inspection areas need to be covered quickly[40]. Issues with liquid penetrant inspection often
occur during the cleaning process prior to inspection as cleaning liquid can enter the surface defects in the same manner as the penetrant, making it hard for the dye to be retained and giving false inspection results[32]. Dye penetrant inspection is
capable to resolving defects with sizes of a few millimetres, and a good overview of penetrant techniques can be found in[7,31,38]. Dye penetrant inspection is commonly used to detect defects with sizes of the order of millimetres.
1.3.4 Magnetic flux leakage inspection methods
Magnetic particle inspection is a technique that is specific to ferromagnetic materials and exploits the magnetic flux leakage that occurs in the vicinity of a surface-breaking defect or discontinuity[41]. A uniform magnetic field is applied across the sample, and the presence of a surface discontinuity acts to distort the lines of magnetic flux. A fine powder of ferromagnetic particles is applied to the sample surface and are magnetised by the leakage field and held in place at the defect, as shown in figure 1.3.
S N
S N
Magnetic field lines
Crack Magnetic particles
Figure 1.3: Schematic diagram of a defect under magnetic particle inspection with magnetic particles attracted to the flux leakage that occurs at a defect site.
geometry is possible[42].
Magnetic particle inspection on small tightly closed defects is challenging and they are often overlooked in testing[32]. However, magnetic particle inspection
has been sucessfully used, with both dry ferromagnetic powder and as a liquid sus-pension, for the testing of welds[43], particularly those on offshore structures where underwater access makes other methods challenging[44].
Magnetic flux leakage inspection can also be carried out by scanning a probe over the material to detect the flux leakage field[45]. The leakage of magnetic flux from a magnetised material is commonly employed as a means of detecting defects in pipelines, rail tracks and other metal components[6,19,45–47]. This method has the advantage of being noncontact and does not require any surface preparation. How-ever, the method can only be applied to inspect ferromagnetic and magnetically permeable materials and therefore its application is limited for industrial applica-tions[45,48,49]. Magnetic flux techniques are commonly used to detect defects with
sizes of the order of hundreds of micrometres.
1.3.5 Electromagnetic radiography
Electromagnetic radiography is a technique that utilises the penetrating na-ture of electromagnetic radiation to detect internal flaws in materials, with both x-ray and gamma ray radiography in use[50]. Standard radiographic inspection
op-erates through the generation of electromagnetic radiation on one side of the sample under test; the radiation penetrates into the material and the intensity of the radia-tion is evaluated on the far side of the material[6]. The intensity of the transmitted
radiation is dictated by the density of the material through which it has passed, with more dense material, like lead and iron, causing a higher degree of attenuation[7].
X-ray or neutron source
Radiation
Defect
Shadow zone
Detector
Component under test
Figure 1.4: An example of an experimental setup that could be implemented for electromagnetic or neutron inspection by through-transmission monitoring.
the defect compared to the radiation that has travelled through the undamaged sample[7], as shown in figure 1.4. Electromagnetic radiography is an effective tool for detecting open cracks, inclusions of foreign material and voids within the struc-ture. Techniques that examine the Compton scattered radiation that is directed back towards the x-ray source have also be used to obtain information about near surface defects, with the advantage that access is only required to a single side of the component[51,52].
One of the strengths of radiography is the ability to build up 3D images of complicated sample structures through the use of computed tomography (CT), in which many scans from different angles are combined to produce a full image[53,54]. However, the use of ionising radiation means that there are safety considerations limiting the exposure of testing personnel. Due to the high costs, both in terms of the x-ray source equipment and in computational time spent producing a CT im-age, this technique is limited to applications in which the detection of small defects outweighs the cost of the inspection process.
1.3.6 Neutron radiography
Neutron radiography uses beams of neutrons that penetrate into the mate-rial to perform nondestructive testing in a manner similar to electromagnetic ra-diography. Changes in the transmission of a neutron beam or in the extent of the backscattering experienced by the neutrons are used to determine different mate-rial characteristics, such as the differences between the test matemate-rial and a void, in order to identify defects[7,56]. Contrast is provided by the difference in the degree of interaction between the neutrons and the material atoms, which is dictated by the neutron cross-section, the value of which is not a simple measure of density or atomic number, and the higher the neutron cross section the more attenuation the beam will undergo[7].
The image produced by neutron radiography is a 2D shadow pattern, which shows areas of greater or lesser interaction with the neutron beam as it passes through the material under test[56], as outlined in figure 1.4. This makes it ideal for investigating materials in which a highly interacting material is covered by different layers, with for example a metal jacket (low neutron cross section) over hydrogen rich material (high neutron cross section)[57].
The most readily avaliable source of neutrons is from a nuclear reactor, plac-ing limits on testplac-ing capabilities and ensurplac-ing that a component has to be removed completely in order to be tested[57]. Neutron radiography has been used to detect surface cracks through the addition of a contrast agent with a large neutron cross section[58] and is also used for the measurement of residual stresses within
materi-als, particularly in single crystal turbine blades[59]. Neutron radiography is often used to complement x-ray radiography as neutrons do not interact with orbiting electrons, thereby giving a low attenuation for heavier elements, such as lead, which are conventionally sensitive to x-rays, allowing both methods to look at different aspects of a component[7]. Neutron radiography is commonly used to detect defects with sizes of the order of micrometres.
1.3.7 Thermographic inspection
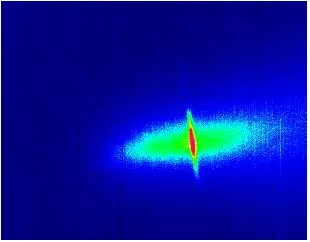
Figure 1.5: Surface-breaking defect imaged by an infra-red camera following the scanning of a continuous wave laser over the defect. This is a cumulative image formed from summation of the images from a video sequence, courtesy of Dr. Sue Burrows.
heat studied using an infra-red imaging camera[29]. Conventionally this is achieved
through illuminating the sample with high powered flash lamps to heat the surface. An infrared image is produced of the sample after heating, and variations in the thermal properties of voids, cracks and delaminations with respect to the undam-aged material are used to identify material damage[60,61]. Thermography has the advantage of being a noncontact inspection method that is capable of investigating large areas rapidly, however, it can struggle to determine the presence of closed de-fects that provide little impedance to heat flow[62].
Recent work has looked at combining thermography with other nondestruc-tive methods, in particular with laser irradiation (see section 2.2.4) to produce a technique that is sensitive to closed defects and that can be targeted at specific re-gions of a sample instead of causing widespread heating, such as that achieved with flash lamps[63]. The thermal behaviour, as observed with an infra-red camera, of the sample under pulsed laser heating has been shown to differ dramatically between regions with no surface damage and those with surface-breaking defects present, due to changes in the boundary conditions at the damaged sample surface[64]. This scanning approach allows the defect position and geometry to be determined reli-ably without widespread heating of the sample, which may produce damage to heat sensitive coatings, with an example of a thermographically examined defect shown in figure 1.5.
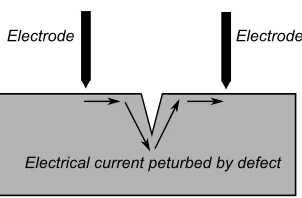
Electrode Electrode
[image:37.595.245.396.103.202.2]Electrical current peturbed by defect
Figure 1.6: Schematic diagram of the process by which an induced electrical current is perturbed by the presence of a surface-breaking defect in ACPD and ACFM.
by the presence of an ultrasonic wave, thereby enabling the detection of closed de-fects[62,65]. The ultrasonic excitation can be performed in a noncontact manner so
as to maintain the remote nature of thermographic inspection, and remove any pos-sibility of damage to heat-sensitive components[62]. Tradiational thermography is
commonly used to detect defects with sizes of the order of milimetres, however tech-niques such as thermosonics can detect smaller defects of the order of micrometres.
1.3.8 Alternating current potential difference (ACPD) method
ACPD is an electromagnetic crack depth sizing technique that utilises the disruption caused by a crack on the flow of current in the surface of a material to give a measure of the defect depth[66,67]. A current is induced between two electrodes
that are placed onto the material under test, such that the current flows within the sample parallel to the sample surface. For a region without a defect, the voltage detected between these two points is constant, however, if a defect is present the current is forced to flow around and under the defect, introducing an extra path length for the current to flow along to reach the second electrode. The resulting change in the detected voltage from this extra path length is used to estimate the defect depth[68]. This method is highly accurate and the use of alternating current avoids extreme heating of the sample, however, it requires direct contact with the material[66], as shown in figure 1.6, and the voltage changes observed are dependent
1.3.9 Alternating current field measurement (ACFM) method
Alternating current field measurements (ACFM) are used for the noncon-tact detection and sizing of surface-breaking defects, with measurement possible through several millimetres of surface coating[67]. ACFM measurements are similar in concept to the ACPD method (section 1.3.8) with an ACFM probe inducing an alternating current into the test material, which in turn induces a uniform magnetic field above the surface. The presence of a defect causes the electric current to flow around and underneath the discontinuity and disrupts the uniformity of the induced field and the change in the field is used to obtain information about the defect posi-tion and severity. This method has many applicaposi-tions, from high speed inspecposi-tion of conducting materials, e.g. rail lines[69], to the inspection of stress cracking in storage containers[70]. Like the ACPD technique the ACFM method requires
cali-bration to the component material before testing can take place as the changes in the current flow are dependent upon the material under test. ACPD techniques are commonly used to detect defects with sizes of the order of hundreds of micrometres.
1.3.10 Eddy current testing
Eddy current testing is an electromagnetic inspection method that is used for its high sensitivity to small surface cracks in electrically conductive materials[71,72]. In conventional eddy current testing a wire carrying an alternating electric current of a single frequency is held near to the test sample, generating an alternating mag-netic field within the skin depth of the sample, the depth of which is dictated by the chosen frequency[73,74]. The varying magnetic field induces eddy currents within
the skin depth of the material, and these in turn produce their own magnetic field, the influence of which is observed through changes in the impedence of a second detector coil or by variations in the impedence of the original coil, as shown in fig-ure 1.7[71]. The presence of defects in the material surface act to alter the phase
and amplitude of the measured current, thereby providing a measure of the surface condition[72,75,76].
Whilst conventional eddy current testing is highly effective at detecting small defects, the single frequency character, and the subsequent fixed skin depth, makes determination of defect depths difficult. To achieve depth sensitivity a non-contact technique known as pulsed eddy current testing was developed in which a broadband chirp signal is used instead of a single frequency[71]. This broadband pulse acts to induce eddy currents at a range of skin depths, with each depth being associated with a frequency component in the excitation signal, allowing the changes in the induced eddy currents to be observed as a function of depth, thereby giving depth sensitivity to the technique[71].
Although highly sensitive, both conventional eddy current and pulsed eddy current testing are restricted to the skin depth of a conducting material and hence are only sensitive to surface defects or near-surface defects. Despite this they find many applications in NDT, particularly in aircraft inspection where large areas of conducting materials require inspection[77,78]. Eddy current techniques are com-monly used to detect defects with sizes of the order of hundreds of micrometres.
1.3.11 Ultrasound
Inspection of a material through the study of the changes in the propagation of ultrasonic sound waves (waves with frequency≥20kHz) is a common nondestruc-tive testing method[20,21,79–83]. Ultrasonic inspection is the method of nondestructive
testing that is utilised in the work presented in this thesis, and an in-depth discus-sion of ultrasonic methods, experimental techniques and a mathematical treatment of ultrasonic propagation can be found in chapter 2. Many different methods exist for generating and detecting ultrasound within a material, with examples ranging from conventional contact piezoelectric methods[26,84] (section 2.2.1) to non-contact methods such as laser ultrasonics[22,27,85] (section 2.2.4) and electromagnetic
acous-tic transducers[28,86] (section 2.2.3).
Ultrasonic techniques have been sucessfully used in a variety of NDT ap-plications including surface and sub-surface defect detection[21,22,80,87], corrosion
welds[20], to name but a few. These inspections are carried out using many
differ-ent ultrasonic wave types, including longitudinal and transverse bulk waves[26,87,88], Rayleigh surface waves[89,90]and Lamb surface waves[89,91], the details of a selection of which are found in section 2.1. A passive ultrasonic method known as acoustic emission in which transient acoustic waves are generated by the localised release of stresses in a material has also been used in several successful applications[92,93].
As a consequence of the wide array of experimental methods and ultrasonic wave probes avaliable there is a large variety of different inspection techniques in use. Ultrasonic testing methods include time of flight methods, such as the pulse-echo and time of flight diffraction (TOFD) techniques, which measure variations in the arrival time of ultrasonic waves due to the presence of material defects (section 2.3)[87,94]. Other techniques utilise changes in the wave amplitude that arise from
the interaction with a defect in the far-field regime[90] and in the near-field[22,95] of
the defect (section 2.3.1).
Ultrasonic inspection is the main focus of the work presented here, with a focus on laser generated and detected surface waves, with a detailed explanation of the propagation of ultrasound found in section 2.1. A discussion of the previous research that has been performed with ultrasound is found in section 2.2.
1.4
Defects in industrial applications
The work contained within this thesis focuses on the detection and charac-terisation of macroscopic surface-breaking defects, which are common in many areas of industry. Of particular interest are defects in the rail[96], nuclear[97] and petro-chemical[12] industries, the early detection of which acts to forestall economic and environmental costs from component failures. Real defects can form complicated branched structures, with defects able to propagate to different depths and grow in a direction that is not perpendicular to the sample surface, however, new detection techniques are generally tested on perpendicular notch defects. Two such examples of real defects are rolling contact fatigue defects in rail tracks[96]and stress corrosion cracking defects, which can grown in many different industrial materials[17].
1.4.1 Rolling contact fatigue
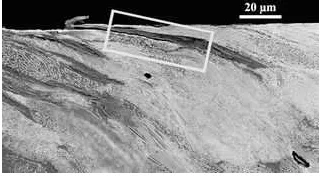
Figure 1.8: Micrograph of RCF defect propagating at an angle of approximately 25◦ from the rail head. Image courtesy of Birmingham University.
with any specific material faults or imperfections[96]. RCF defects are caused by a
combination of the high normal and tangential stresses between the train wheel and the rail, causing severe shearing of the surface layer of the rail and fatigue of the material. Following the nucleation of a defect on the top surface the crack propa-gates through the heavily deformed top surface of the rail head at a shallow angle of approximately 25◦, giving a defect that can grown to several millimetres deep[98,99]. Defect growth is driven by the action of water trapped in the defect, which is put under large amounts of pressure whilst a train moves over the damaged region; the large forces involved help to drive the crack growth into the material[98]. In some
cases the crack will propagate back towards the top surface, shearing off a small section of the rail top layer (known as spalling[99]) but in more severe instances the sloped defect will propagate downwards in the rail until failure occurs, as shown in figure 1.8, making early detection of these angled defects essential for preventing rail failure.
To simulate these types of defect, artificial angled surface-breaking defects were produced using laser micro-machining, a process which is described in section 1.4.3, with the calibration defects themselves presented in section 4. These artificial angled defects act as a good approximation of the early stages (angled defect growth) of RCF cracking and allow a method for early defect detection and characterisation to be developed.
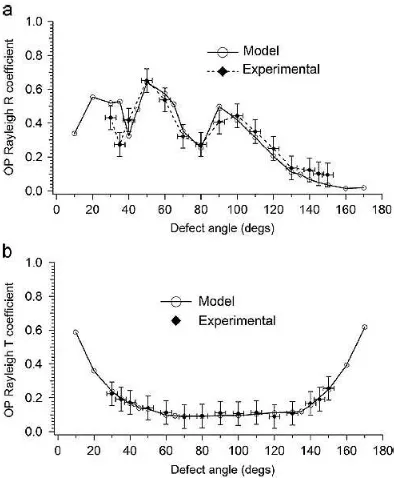
Figure 1.9: Variation in the reflection (a) and transmission (b) coefficients of the out-of-plane Rayleigh wave component for a defect of varying angle. Image taken from[107].
of defects similar to those found in RCF[105].
The main focus of this previous research has been on defects that propagate perpendicular to the sample surface, however, previous work has also shown that defects that are inclined to the horizontal, for example RCF defects, have differ-ent reflection and transmission characteristics to perpendicular defects, as shown in figure 1.9[106,107]. Therefore, the work presented in chapter 4 uses the near-field enhancement technique (section 2.3.1) to characterise not only the position of a de-fect, but also its angle to the sample surface, which is of benefit to the successful characterisation of defects such as RCF[95,107].
1.4.2 Stress corrosion cracking
rate due to the action of cyclic stresses on a component and is therefore detectable prior to component failure[17]. Defects from either mechanism have devastating con-sequences if they occur in sensitive components, such as in pipelines[108]and nuclear reactors[109].
SCC requires three factors; a susceptible material, a corrosive agent appropri-ate for the specific mappropri-aterial and sufficient tensile stress[17]. There are three different mechanisms by which SCC can occur; active path dissolution, hydrogen embrittle-ment and film-induced cleavage[17]. All of the SCC mechanisms involve the action of a corrosive agent on the material of the structure, producing a position of weakness within the structure, usually located at a grain boundary or a pre-existing surface imperfection[17].
Active path dissolution occurs along a path of higher corrosion susceptibility, such as a grain boundary, at which corrosive agents can gather, meaning it is easier for corrosion to occur at these positions when compared to the rest of the structure. The action of stress on this form of corrosion acts to open the defect, exposing the internal part of the defect to the corrosive agent, thereby accelerating the corrosion growth[17].
Hydrogen embrittlement is caused by the dissolution of hydrogen atoms into the metal, which is possible as they are far smaller than the atoms of the metal. The hydrogen atoms are drawn to regions of higher stress, such as crack nucleation sites, and the presence of hydrogen impurities at the crack tip acts to embrittle the metal, making cleavage easier and accelerating crack growth[17].
The final mechanism, film-induced cleavage, is common in structures in which a metal is coated with a brittle film, such as a painted pipeline, where a crack that originates in the film layer can continue to propagate into the metal underneath. If the original defect in the film was caused by corrosion then the corrosive process will continue within the metal[17].
The corrosion process can only take place if the correct corrosive agent for the chosen material is present. This can be as simple as the accidental transport of aerated water (introducing CO and CO2) in a carbon steel pipeline that is only
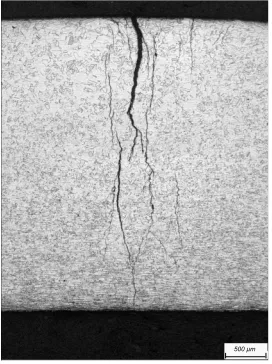
500 µm
Figure 1.10: Micrograph of SCC defect showing complicated branching nature. Im-age courtesy of BP.
The methods commonly used to detect SCC defects include acoustic emission (in which a transient ultrasonic wave is locally generated on cracking and can be used to identify the cracking event)[110], eddy current testing (which is only sensi-tive to near surface defects in conductors)[76], dye penetrant testing (with resulting
plant shutdown)[111], radiographic testing (with its associated cost)[51] and ultra-sonic testing[112]. Currently the ultrasonic techniques are limited to recording the time of flight diffraction that occurs at the defect[112], however, this is relatively
insensitive to defects on the sample surface, driving the need to develop a more re-liable ultrasonic technique such as the near-field technique presented in this thesis. SCC defects form complicated defect structures with many branches of dif-ferent depths and orientations to the surface, as shown in figure 1.10, which makes the interaction of ultrasound with the defect difficult to interpret. SCC defects have a complicated reflection and transmission character due to the partially-closed na-ture of the defect and ultrasound will be transmitted through sections of the defect that are closed and reflected by those that are open, this makes it difficult to reliably determine the variation of either coefficient with defect depth, making it challenging to characterise the defect by conventional means[113,114].
as to simulate an open SCC defect in a storage container (see chapters 5 and 6). Artifical calibration defects have been sucessfully used in many applications as a means of understanding the physics of a simplified system prior to testing it on real defects[22,95,104,107,115,116]. The artificial defects used here enabled an understanding
of the near-field interactions to be developed, which was then validated for a vari-ety of real defects (chapter 7), using the understanding obtained from the artificial defects.
1.4.3 Laser micromachining for artificial defect manufacture
As a starting point for developing an understanding of the near-field effects, simplified artificial defects were studied without the complicated partially-closed branching structure of real defects. Artificial defect manufacture by laser micro-machining uses a high powered laser to produce a narrow, highly accurate cut into the sample material[117,118]. It has the benefit of being a non-contact machining