Size Effect on Dynamic Behavior of Dross in Model Hot Dip Plating Bath
Jun Kurobe
1and Manabu Iguchi
21Steel & Technology Development Laboratories, Nisshin Steel Co., Ltd., Amagasaki 660-0092, Japan
2Division of Materials Science and Engineering, Graduate School of Engineering, Hokkaido University, Sapporo 060-8628, Japan
The motions of top and bottom dross with different diameters in hot dip plating baths were investigated using a transparent cold model vessel with a reduced scale of one-tenth. Polystyrene particles of the same density and diameter were used as models both for the top and bottom dross, and NaCl aqueous solutions with different densities were used as models for the plating melts. The typical streak lines of the top and bottom dross model particles were nearly the same as the main stream lines in the model bath regardless of the dross diameter. The top and bottom dross model particles were enriched in the region enclosed with the belt. Some of the model particles were trapped in the clearances between the sink roll and the belt. As the dross diameter became large, the number of top dross model particles floating on the bath surface increased and that of bottom dross model particles staying on the bottom wall increased.
(Received November 19, 2002; Accepted February 17, 2003)
Keywords: hot dip plating bath, top dross, bottom dross, cold model, Froude number, streak line, particle frequency, particle holdup
1. Introduction
Intermetallic compounds and oxides, usually called dross, are generated in a continuous hot dip plating bath through chemical reactions between the plating melts, strips and oxygen in the atmosphere.1–16)There are two types of dross; top dross and bottom dross. The adhesions of these dross to the strip lower the quality of the hot dip plating sheets significantly, and accordingly, a variety of methods have been proposed to remove the dross out of the bath.1) No efficient method, however, has not been developed yet. For the development of an efficient method of removing the dross, it is of essential importance to elucidate the motions of the top and bottom dross in a real hot dip plating bath. Unfortunately, information on the motions of the dross is very limited,2–5)as mentioned in a previous paper.6)
Fundamental fluid flow phenomena in a real hot dip plating bath and the effects of the strip velocity on the dynamic behavior of the two types of dross have so far been investigated using a one-fifth and one-tenth scale cold model.6,7)Some typical streak lines of model particles for the two types of dross were nearly the same as the main stream lines in the bath. The model particles were enriched in the region enclosed with the belt. This was confirmed by measurements using a newly developed particle detection sensor. The number of particles crossing a measurement position for one second,fp, called particle frequency, and the
fraction of residence time of the particles at the measurement position to total measurement time, p, called particle
holdup, were highest in the region enclosed with the belt. These quantities increased with an increase in the belt velocity.7)
The main objectives of this study are to reveal the size effects on the dynamic behavior of top and bottom dross in a real hot dip plating bath. Model experiments were carried out using a one-tenth scale cold model. Models for the plating bath, top dross, bottom dross, and plating melt were determined based on the Reynolds number similitude and the Froude number similitude. By referring to previous papers,3,8,9) the top and bottom dross were assumed to be
spherical in shape and three different diameters were chosen as representative diameters for each type of dross.
2. Experiment
2.1 Concept of model design
Although details of two dynamic similarity laws used for model design are given in the previous paper,7) some important aspects of them are reproduced here for a better understanding of the flow field considered. The dynamic similitude for the fluid flow phenomena between a real hot dip plating bath and its cold model bath is given by the following Reynolds number.6)
Re¼LLvs=L ð1Þ
where L is the density of the plating melt, L is the
characteristic length, vs is the strip velocity, L is the
viscosity of the plating melt. The sink roll diameter was chosen as the characteristic length,L. The Reynolds number in the model was decided to be the order of magnitude of105
as the flow in the bath is turbulent.
Concerning a real hot dip plating bath, the physical properties of the melt is fixed and the diameters and densities of the top and bottom dross are different. However, it should be noted that in this model experiment polystyrene particles with a mean diameter, dp, of 1.0 mm and a density, p, of 1:05103kg/m3 are used as models both for the top and
bottom dross. The size and density of the model particles therefore were fixed regardless of the type of dross. NaCl aqueous solutions with different densities were chosen as the models for the plating melts. The density of the NaCl aqueous solution was changed depending on the type of dross.
The following modified Froude number was employed to provide a dynamic similitude for the determination of the density of the model liquids.
Fr¼Lv2s=ðjjdpgÞ ð2Þ
where(¼pL) is the density difference between the
dross and the plating melt,gis the acceleration due to gravity, Special Issue on Solidification Science and Processing for Advanced Materials
dpis the diameter of dross, and the strip velocity,vs, is used
as the characteristic velocity.
Equation (2) gives the following relation between a real process and its model.
M=LM ¼ ðR=LRÞðvsM=vsRÞ2ðdpR=dpMÞ ð3Þ
where the subscriptsM andRdesignate the model and real processes, respectively. Fe2Al5 and FeZn7 were chosen as
representative top and bottom dross, respectively. The density of Fe2Al5 is 4:2103kg/m3 and that of FeZn7 is
7:25103kg/m3.14–16) By referring to previous
investiga-tions,3,8,9)the diameters of the top dross,dpR, were assumed
to be 40, 60 and 100mmand those of the bottom dross were assumed to be 60,150 and 300mm.
Substitution of the diameters and densities of the top dross, bottom dross, model particles and plating melt (molten zinc) into eq. (3) gives the densities of the model working fluids, as shown in Table 1. The densities of the model working fluids,
LM, were1:06103,1:07103 and1:08103kg/m3for
the top dross of dpR¼40, 60 and 100mm, respectively.
Those for the bottom dross of dpR¼60, 150 and 300mm
were 1:04103,1:03103 and1:02103kg/m3,
respec-tively. Accordingly, 8.6%, 10.0%, and 11.5% NaCl aqueous solutions were used for the top dross model particle measurements and 6.0%, 4.5%, and 3.0% NaCl aqueous solutions were used for the bottom dross model particle measurements.
2.2 Experimental apparatus
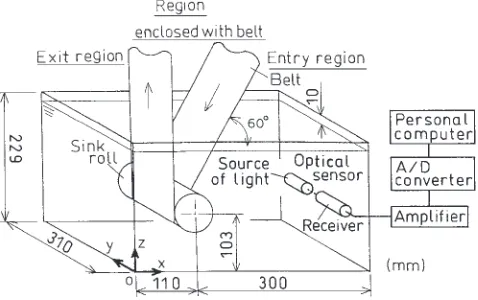
Figure1shows a schematic of the experimental apparatus. The main specifications of the cold model are shown in
Table2. A sink roll was placed in a transparent acrylic vessel. An endless belt was driven by two driving rolls. The origin of the Cartesian coordinate system (x,y,z) was placed at one of the corners of the vessel. The flow field in the bath was divided into three regions as mentioned in the previous paper;6) the entry region, the exit region, and the region enclosed with the belt. The belt velocity, vsM, was set at
1.5 m/s.
Model particles of 32 g in mass were fed into the bath from the bath surface in the entry region for every measurement. This amount of model particles were chosen so that the measurements of streak lines, particle frequency and particle holdup could be carried out with sufficient accuracy.
2.3 Streak line measurement
A streak line is defined as the line on which lie model dross particles that at some earlier instant passed through a certain point in the bath. In other words, the resulting particle trail is called the streak line.17)The streak lines of model particles were observed using a high-speed video camera at 200 frames per second.
2.4 Measurement of local particle frequency and local particle holdup
The particle frequency,fp, and particle holdup,p, can be
calculated from the following equations (see Fig. 2).
fp¼N=tMðHzÞ ð4Þ p¼ ðtpi=tMÞ 100ð%Þ ð5Þ
whereNis the number of particles crossing the laser beam of the particle detection sensor which is already shown in Fig. 1,
tM is the total measurement time andtpiis the time duration
for the i-th particle to cross the beam. The distance between the light source and the detector, the sampling frequency of the output signal and the total measurement timetM, were set
[image:2.595.307.550.84.136.2]at 20 mm, 5 kHz and 2 min, respectively. The accuracy of the present measurement method is given in the previous paper.7) It should be stressed that the measurements were carried out Table 1 The densities of model working fluids.
Cold model Real process
dpM pM LM dpR pR LR (mm) (kg/m3) (kg/m3) (mm) (kg/m3) (kg/m3)
Top 1.0 1:05103 1:06103 40 4:2103 6:66103 dross 1.0 1:05103 1:07103 60 4:2103 6:66103 particle 1.0 1:05103 1:08103 100 4:2103 6:66103
Bottom 1.0 1:05103 1:04103 60 7:25103 6:66103 dross 1.0 1:05103 1:03103 150 7:25103 6:66103 particle 1.0 1:05103 1:02103 300 7:25103 6:66103
[image:2.595.47.290.84.200.2]Fig. 1 Experimental apparatus for 1/10 scale cold model.
Table 2 Main specifications of cold model.
Sink roll 70 mm210 mm
Belt t0:2mmw120 mm
Vessel t5 mmw410 mmD310 mmH229 mm
Transparent acrylic resin
[image:2.595.50.289.618.768.2] [image:2.595.306.539.640.770.2]after the flow in the bath became steady.
It should be noted that when both the particle frequency,
fp, and particle holdup, p, are high at a measurement
position, many dross particles pass there slowly. Namely, the dross particles are enriched around there.
3. Experimental Results and Discussion
3.1 Typical streak lines
3.1.1 Top dross model particles in the entry and exit regions
Some typical streak lines of top dross model particles for
dpR¼60mm and vsM¼1:5m/s are reproduced from the
previous paper7) and shown in Fig.3. The most definite streak line is denoted by aT, where the subscript T designates
the top dross model particle. The streak lines denoted by bT,
cTand dTare also pronounced. These streak lines are similar
to the main stream lines reported in the previous paper.6) The streak lines of top dross model particles for
dpR¼40mm and 100mm were approximately the same as
those shown in Fig.3. Since the density of the top dross model particle was slightly smaller than that of the NaCl aqueous solution, many top dross model particles gathered on the two parts of the bath surface denoted by A and B. 3.1.2 Bottom dross model particles in the entry and exit
regions
Some typical streak lines of bottom dross model particles for dpR¼60mm in the NaCl aqueous solution of LM ¼1:04g/cm3 are also reproduced from the previous
paper7)and shown in Fig.4. The main streak lines denoted by aB, bB, cB, and dB are approximately the same as the main
stream lines mentioned above, where the subscript B designates the bottom dross model particle. As the density of the bottom dross model particle was slightly larger than that of the NaCl aqueous solution, many bottom dross model particles stayed on the bottom wall and some of them were frequently lifted up,i.e., ejected into the bulk of the bath,4,9) as indicated by the solid lines bB3, bB4and bB5.
Some typical streak lines of bottom dross model particles fordpR¼150and 300mmare shown in Fig. 5. These streak
lines are approximately the same as the streak lines shown in
Fig.4. Compared with Fig. 4, however, the number of particles lifted from the bottom wall decreased appreciably but that of particles staying on the bottom wall increased. Bottom dross model particles were hardly observed in the central part of the bottom wall.
3.1.3 Top and bottom dross model particles in the region enclosed with belt
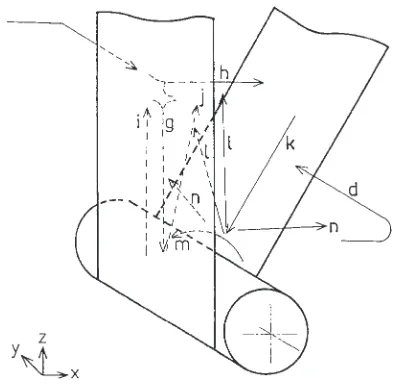
Top and bottom dross model particles are most likely to gather in the region enclosed with the belt. The number of dross model particles in this region increased as the belt velocity,vsM, increased.7)The typical streak lines of the top
and bottom dross model particles in this region were very similar to the stream lines shown in Fig.6. The stream lines shown in Fig.6were labeled with d, g, h, i, j, k, l, m and n. The arrows denote the direction of flow. In addition, these streak lines were found to be hardly dependent on the diameter of the dross,dpR.
It is interesting to note that both the top and bottom dross model particles are carried deep into the clearances between the belt and the sink roll. The possibility that the dross particles are captured in the clearances is considerably high. Fig. 3 Typical streak lines of top dross model particles fordpR¼60mm.
Fig. 4 Typical streak lines of bottom dross model particles for dpR¼60mm.
[image:3.595.311.545.70.253.2] [image:3.595.310.544.301.484.2] [image:3.595.54.286.586.770.2]We therefore investigated the motions of the dross model particles moving in the two clearances more in detail.
The typical motions of top and bottom dross model particles in the two clearances were observed with a high-speed video camera in the middle plane ofy¼151mm. The results of the motions of the top and bottom dross model particles are schematically shown in Figs.7 and 8, respec-tively. The time interval between successive particle images was the same. The velocity of a top dross model particle entering the clearance on the entry side decreased as it approached the bottom of the clearance, as shown in Fig.
7(a). This is because the particle have to move against a
pressure rise or an adverse pressure gradient in the clearance. On the other hand, the velocity of a bottom dross model particle entering the clearance on the entry side hardly decreased, as shown in Fig.8(a), because the density of the bottom dross model particles was larger than the NaCl aqueous solution. The streak lines of top and bottom dross model particles on the exit side clearance were approximately the same, as shown in Figs.7(b) and (c) and Figs.8(b) and (c). The velocity of a model particle entering the clearance on the exit side was considerably lower than that in the clearance on the entry side. The adhesion of the top and bottom dross model particles to the belt took place in the two clearances regardless of the dross diameter.
Both the top dross particles and bottom dross particles entered into the clearance between the sink roll and the belt. The velocity of the top dross particle entering the clearance on the entry side was different from that of the bottom dross particle.
3.2 Contour lines of particle frequency fp and particle
holdupp
3.2.1 Top dross model particle
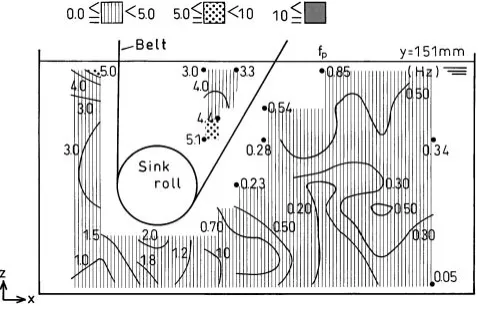
The contour lines of particle frequency,fp, of top dross
model particles for dpR¼40, 60 and 100mmin the middle
plane of y¼151mm are shown in Figs.9, 10 and 11, respectively. Data could not be obtained in the regions designed by white color mainly due to experimental difficulty. The distributions of particle frequency, fp, were
approximately the same regardless of the diameter of the top dross,dpR. The particle frequency,fp, is eventually high near
the belt in every figure, implying that many top dross model particles move along the streak line indicated by aTin Fig.3. Fig. 6 Flow pattern in the region enclosed with belt.
Fig. 7 Top dross model particle motion in the clearances between belt and sink roll (y¼151mm, vsM¼1:5m/s). (a) entry side, (b) exit side (inflow), and (c) exit side (outflow).
[image:4.595.329.512.69.344.2] [image:4.595.69.267.70.264.2] [image:4.595.81.257.472.750.2]In the region enclosed with the belt, the measuredfp values
are very high compared with those in other regions. This is because the model particles trapped once in this region are difficult to escape from there before a steady state is established.
The experimental results of particle holdup, p, for
dpR¼60mmin the middle plane ofy¼151mm are shown
in Fig.12. The measuredpvalues are high in the lower part
of the exit region, in the region enclosed with the belt, and in the left-half part of the entry region. The three sub-regions designated by F1, F2, and F3in the left part of the entry region
are regarded as stagnant regions.7)
The contour lines of particle holdup,p, fordpR¼40and
100mm in the middle plane of y¼151mm are shown in Figs. 13and14, respectively. The stagnant regions shown in Fig. 9 Contour lines of particle frequency for top dross model particles
[image:5.595.310.551.72.232.2](dpR¼40mm).
Fig. 10 Contour lines of particle frequency for top dross model particles (dpR¼60mm).
[image:5.595.48.291.278.438.2]Fig. 11 Contour lines of particle frequency for top dross model particles (dpR¼100mm).
[image:5.595.306.550.397.552.2]Fig. 12 Contour lines of particle holdup for top dross model particles (dpR¼60mm).
[image:5.595.50.289.488.643.2]Fig. 13 Contour lines of particle holdup for top dross model particles (dpR¼40mm).
[image:5.595.307.548.605.758.2]Fig.12 cannot be seen and the measured p values in the
whole bath were lower than those for dpR¼60mm. At a
glance, this result seems strange. The reason can be explained as follows: Under the present experimental conditions the relaxation time of a model particle is expressed by18)
¼LMdpMðpMþLM=2Þ=ð18LMÞ ð6Þ
where LM is the kinematic viscosity of the NaCl aqueous
solution. The relaxation time is a measure for the response time of a particle to a change in liquid flow velocity around it. In eq. (6) pM and dpM are fixed, LM is lower for
dpR¼40mm than for dpR¼60mm, and LM is higher for
dpR¼40mmthan fordpR¼60mm. This fact means that the
relaxation time is shorter for dpR¼40mm than for
dpR¼60mm. Accordingly, the top dross model particles
for dpR¼40mmrespond to a change in the liquid velocity
more quickly than those for dpR¼60mm. Therefore, top
dross model particles fordpR¼40mmare less captured in the
stagnant regions (F1, F2, and F3) than those fordpR¼60mm.
On the other hand, the buoyancy force acting on a top dross model particle is expressed by
FB ¼ ð=6ÞðLMpMÞgd3pM ð7Þ
This force increases as the density difference, (LMpM),
increases. Accordingly, particles fordpM ¼100mmare more
likely to be forced to move vertically upwards than those for
dpR¼60mmand are not able to stay in the stagnant regions
(F1, F2, and F3).
The spatial mean values of fp, denoted by fpm, were
calculated for the three regions in the middle plane of
y¼151mm to find out the regions where the top dross model particles are enriched. The top dross model particles floating on the bath surface were excluded in the calculation. As shown in Figs.9,10and11, the spatial mean values in the entry region, the exit region, and the region enclosed with the belt were 0.76, 3.3 and 6.5 Hz fordpR¼60mm, 0.67, 2.7 and
5.5 Hz for dpR¼40mm, 0.56, 2.4 and 4.1 Hz for
dpR¼100mm, respectively. Accordingly, the top dross
model particles of every diameters of dross, dpR, are most
likely to gather in the last region before a steady state is established. This result is consistent with the finding obtained by flow visualization with the high-speed video camera. 3.2.2 Bottom dross model particle
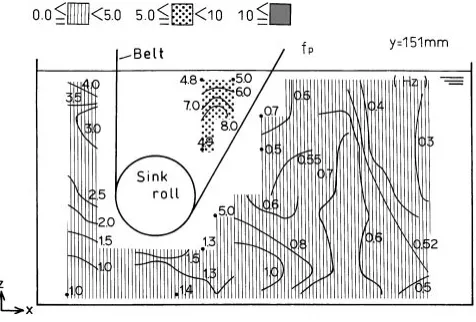
The contour lines of particle frequency,fp, of the bottom
dross model particles for dpR¼60, 150 and 300mm are
shown in Figs.15,16and17, respectively. The distributions of fp are similar to those for the top dross model particles
shown in Figs.9through11. The spatial distributions offp
were approximately the same for all the dross diameters,dpR.
The magnitude offp, however, became low everywhere in
the bath as thedpRbecame large. The number of bottom dross
model particles staying on the bottom wall increased as the
dpRincreased, because the gravitational force acting on the
bottom dross particles increased as dpR increased, as
suggested from eq. (7). The mechanism of the formation of these three stagnant regions can not be clearly explained at present. However, the existence of the three stagnant regions is very important because the efficiency of dross removed is lowered.
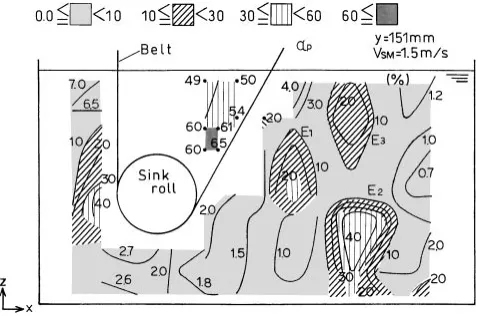
The contour lines of particle holdup,p, fordpR¼60mm
in the middle plane ofy¼151mm are shown in Fig.18. The particle holdup,p, was high in the central part of the exit
region, the region enclosed with the belt and three sub-regions in the entry region. Around the sub-sub-regions indicated by E1, E2, and E3in the entry region, thepvalues were high,
[image:6.595.309.547.72.233.2]whereas the fp values shown in Fig. 15 were low there.
[image:6.595.308.547.284.437.2]Fig. 15 Contour lines of particle frequency for bottom dross model particles (dpR¼60mm).
Fig. 16 Contour lines of particle frequency for bottom dross model particles (dpR¼150mm).
[image:6.595.307.550.490.643.2]These regions are also considered to be stagnant regions.7) The contour lines of the measuredpvalues fordpR¼150
and 300mmin the middle plane ofy¼151mm are shown in Figs. 19and20, respectively. The stagnant regions appearing in Fig.18cannot be seen and the measuredp values in the
whole bath were lower than those fordpR¼60mmthrough
the effect of less buoyancy force acting on the model particles.
The spatial mean values of particle frequency,fpm, were
calculated for the three regions in the middle plane of
y¼151mm to find out the regions where the bottom dross model particles are enriched. The particles staying on the bottom wall were excluded in the calculation. As shown in Fig.15,16and17, the spatial mean valuesfpm in the entry
region, the exit region, and the region enclosed with the belt were 0.76, 2.1 and 7.1 Hz for dpR¼60mm, 0.32, 0.89 and
2.5 Hz for dpR¼150mm, 0.07, 0.19 and 0.87 Hz for
dpR¼300mm, respectively. Accordingly, bottom dross
model particles of every diameters of dross, dpR, are most
likely to gather in the last region before a steady state is established just like the top dross model particles.
Judging from the present model experiments, it can be concluded that both the top and bottom dross in a real hot dip plating bath are likely to gather in the region enclosed with the strip regardless of the dross diameter. Kurihara et al.4) reported that the dross in real processes were abundant in the region enclosed with the strip. In the case of top dross, the dross ofdpR¼60mmwould stay longer in the bulk of the real
bath without floating on the bath surface than those of
dpR¼40mmand 100mm. Also, in the case of bottom dross,
the dross ofdpR¼60mmwould stay longer in the bulk of the
real bath without sedimentation on the bottom wall than those of dpR¼150mmand 300mm. Nomuraet al.9)reported that
the dross of diameters ranging from 50 to 80mmare most abundant in the real baths.
4. Conclusions
Main findings obtained in this study can be summarized as follows:
(1) The typical streak lines for the top dross model particles in a model bath were approximately the same as the main stream lines in the bath. Many top dross model particles stayed on the bath surface in the vicinity of the side walls parallel to the belt in the entry and exit regions, as shown in Fig.3.
(2) The typical streak lines for the bottom dross model particles were also approximately the same as the main stream lines in the bath. Many bottom dross particles stayed on the bottom wall under the sink roll and in the entry region. The number of particles staying on the bottom wall in the entry region increased and the particles moving in the bulk of the bath decreased as the dross diameter became large.
(3) The typical streak lines for the top and bottom dross model particles in the region enclosed with the belt were approximately the same regardless of the dross diameter. These streak lines were very close to the main stream lines in this region. The model particles were often carried deep into the two clearances between the belt and the sink roll, and some of them were caught in the two clearances. This may be one of the main causes for the adhesion of the dross to the strip in a real hot dip plating bath.
(4) The particle frequency, fp, of the top dross model
particles was hardly dependent on the dross diameter. The top dross model particles for dpR¼60mm were
[image:7.595.50.289.72.230.2]captured in the stagnant regions (F1, F2, and F3) in the Fig. 18 Contour lines of particle holdup for bottom dross model particles
[image:7.595.48.290.402.554.2](dpR¼60mm).
[image:7.595.49.288.606.758.2]Fig. 19 Contour lines of particle holdup for bottom dross model particles (dpR¼150mm).
entry region. However, those fordpRof 40 and 100mm
were hardly captured in these regions.
(5) The particle frequency,fp, of the bottom dross model
particles became low as the dross diameter, dpR,
increased. Many bottom dross model particles for
dpR¼60mm were entrapped in the stagnant regions
(E1, E2, and E3) in the entry region. However, the
entrapment of bottom dross particles ofdpR¼150and
300mmin the stagnant regions was not observed. (6) Both the top and bottom dross model particles were
most likely to gather in the region enclosed with the belt regardless of the dross diameter.
REFERENCES
1) ex. M. Shouji and S. Ito: Nippon Kokan Technical Report91(1981) 493–496.
2) Y. Fukushima, C. Takeuchi, K. Tada, Y. Fujii, T. Noguchi and T. Nara: CAMP-ISIJ3(1990) 1566.
3) H. Koumura, C. Kato, K. Mochizuki and N. Morito: CAMP-ISIJ7 (1994) 1532.
4) M. Kurihara, H. Kobayashi, N. Taguchi, J. Inagaki and Y. Suzukawa: CAMP-ISIJ8(1995) 657.
5) T. Hashimoto, H. Ishihara, S. Yamanaka, K. Kurita, S. Miyauchi and A. Yamauchi: CAMP-ISIJ6(1993) 1561.
6) J. Kurobe, M. Iguchi, S. Matsubara, K. Nakamoto and Z. Morita: Tetsu-to-Hagane´81(1995) 733–738.
7) J. Kurobe and M. Iguchi: Sci. Tech. Adv. Materials1(2000) 251–259. 8) H. Koumura, C. Kato and N. Morito: CAMP-ISIJ4(1991) 1631. 9) S. Nomura, J. Inagaki, M. Yamashita, M. Iwabuchi and N. Taguchi:
CAMP-ISIJ8(1995) 656.
10) H. Yamaguchi and Y. Hisamatu: Tetsu-to-Hagane´60(1974) 96. 11) T. Ooi, S. Shimada and T. Kondou: CAMP-ISIJ5(1992) 1736. 12) H. Koumura, C. Kato, K. Mochizuki and N. Morito: CAMP-ISIJ6
(1993) 1562.
13) H. Ishihara, S. Yamanaka, K. Asano, Y. Takatani, T. Kurimoto and H. Oishi: CAMP-ISIJ7(1994) 1531.
14) S. Yamaguchi: Metals & Technology Kinzoku64(1994) 35–41. 15) A. R. Borizillo and W. C. Hahn Jr: Trans. ASM62(1969) 729. 16) H. Barlik: Galvanizing, E & F. N. Spon Ltd., London, (1950) 164. 17) V. L. Streeter and E. B. Wylie: Fluid Mechanics, 8th ed. (1985) 88–89. 18) Soc. Chem. Eng. Jpn: Handbook of Chem. Eng., 6th ed. (1999)