As in every economic activity, producers are seeking to produce in an economically efficient manner; this is also the case in dairy farming. costs and revenues of dairy farming are influenced by numerous external factors relating to market conditions (such as the increase in feed prices), natural conditions (lower yields due to natural disasters or climate changes), or policy changes (milk quota increase and its future
abolition). Due to the fact that forage costs already present up to 55% of the total variable cost, ration formulation is becoming the fundamental lever in dairy management. With the increasing volatility of fodder prices, this becomes an even more important issue.
Formulation of an efficient ration is a complex and time-consuming process. it should take into
consid-Combination of linear and weighted goal programming
with penalty function in optimisation of a daily dairy
cow ration
Kombinace lineárního a váženého cílového programování
s trestnou funkcí při stanovení denní krmné dávky pro dojnice
J. Žgajnar, L. Juvančič, S. Kavčič
Biotechnical Faculty, University of Ljubljana, Biotechnical Faculty, Domžale,
Slovenia
Abstract: The aim of the paper is to present a developed spreadsheet tool for the formulation of a daily dairy cow ration. it is constructed on the basis of two linked sub-models developed on the MS Excel platform. it merges the common linear programming model and the weighted-goal programming model with a penalty function. The first sub-model is included in the tool to make an estimate of the least-cost magnitude that might be expected. The obtained result is entered into the second sub-model as the goal that should be met as closely as possible. The tool was tested at two different values of preferential weights for dairy cows with a 25 kg daily milk yield. The results obtained confirm the benefits of the applied approach. in contrast to the common linear program tools, which terminate at formulation of the least-cost ration, our tool provides more efficient rations (in both economic and nutritive terms) by fine-tuning the nutritive goals and by allowing for harmless deviations from these goals by application of penalty functions.
Key words: spreadsheet ration optimization, economics of dairy breeding, linear programming, weighted goal pro-gramming with penalty function
Abstrakt: cílem příspěvku je prezentace metodického tabulkového nástroje pro stanovení denní krmné dávky pro dojnice. Ten byl vytvořen na základě dvou propojených dílčích modelů na základě MS Excelu. Kombinuje běžný model lineárního programování a váženým cílovým programováním s trestnou funkcí. První submodel představuje nástroj k odhadu mini-málních nákladů. získané výsledky jsou vloženy jako cíl, jehož má být co nejtěsněji dosaženo, do druhého submodelu. Tento nástroj byl testován na základě dvou rozdílných hodnot diferenčních vah pro dojnice s denní dojivostí 25 kg. získa-né výsledky potvrdily přednosti aplikovazíska-né metody. na rozdíl od běžných nástrojů lineárního programování, které končí formulací minimálních nákladů, předkládaný metodologický nástroj nabízí efektivnější denní dávky (jak v ekonomickém, tak nutričním smyslu) přesnějším vyvážením nutričních cílů a umožněním přijatelných odchylek od těchto cílů zavedením trestné funkce.
eration nutritional, economic, and environmental factors. however, rations are most often constructed by experience, textbook-based knowledge, or by tri-al-and-error methods (by hand). in all these cases, non-nutritional factors, such as economics and the environment, might be neglected, which deteriorates the efficiency of diets.
review of the existing literature offers numerous examples of utilizing operation research techniques for solving nutrition management problems. The most common is the least cost ration optimization based on linear programming (LP) technique, start-ing with Waugh (1951). As argued by castrodeza et al. (2005), LP has until nowadays been most widely used in livestock ration formulation, which holds especially true for the blending industry.
Even though LP approach is suitable for solving nutrition management problems, it has some draw-backs and might therefore not be sufficient in for-mulation of a ration that would be effective in both economic and nutritive terms (rehman, romero 1984, 1987). reasons for this lie in the very assumptions of the LP method: single-objective functions and fixed (rigid) constraints – right-hand side (rhS). This means that only one objective might be optimized at once (e.g., cost minimization). ration formula-tion is quite a complex process, and the reducformula-tion of several objectives into only one – cost minimization – usually proves too rigid (rehman, romero 1984). Since nutrition management demands multi-objective consideration (Lara, romero 1994), indirect impacts on the environment and animal well-being, which are usually negative, must be taken into consideration. The reduction of negative externalities is costly. in decision-making terms, this would lead to the prob-lem where one would face several objectives that are usually in contradiction with one another.
The fact that all nutrient requirements are estimated on the basis of numerous equations’ points at the second basic LP assumption – how nutrient constraint should be met – it assumes that no constraints’ (e.g., given nutrition requirements) violence are allowed at all, irrespective of deviation level (rehman, romero 1984). in many real situations, this might manifest in fact that the LP model has no feasible solution. however, a relatively small relaxation in rhS would not seriously affect animal welfare, but it would result in a feasible solution (rehman, romero 1987; Lara, romero 1994). This is especially true if we consider that the estimated nutritional requirements have also some deviations (errors).
one of the possible approaches to overcoming this drawback is to change all arbitrary ‘conflicting’ constraints, but Ferguson et al. (2006) are stating that
this might manifest in an ‘open’ equation system, thus possibly yielding a meaningless solution. Besides that, expert knowledge is needed, and that could be the problem for the potential end user. Another problem concerning rhS is the fact that constraints are usually defined in only one direction. This could reflect in the rise of the primary costs or, what is lately becoming even more important, it could increase pollution with surplus elements and the greenhouse gas (ghg) emis-sions (Brink et al. 2001) due to unbalanced rationing at different stages. imposing additional constraints could solve this drawback, but it could rapidly lead to an over-constrained and too complex model that has no feasible solution at all (Lara 1993).
When ration optimization is the case, the draw-backs mentioned might be reduced by the multi criteria decision making (McDM) concept (rehman, romero 1984). The most pragmatic and commonly used method within the McDM techniques is the weighed goal programming (WgP) (Tamiz et al. 1998). its mathematical framework is familiar with the LP, which enables simplex algorithm utilization (rehman, romero 1993). hence it follows that very commonly used spreadsheet program, such as the MS Excel, might be used as a basic platform. The latter is especially important when one tries to prepare an end-user optimization tool.
The objective of this paper is to present how math-ematical programming techniques could be applied to prepare a user-friendly tool to support daily manage-ment tasks in the dairy sector. This also explains the reasoning for developing this tool in the MS Excel framework, since that software is available on most personal computers. After a brief overview of the optimization techniques and penalty function utilized, a short description of the applied approach follows. Then, the basic characteristics of the analysed case are presented followed by results and discussion. Brief conclusions close the last section.
MATERIALS AND METHODS
Weighted goal programming with a penalty function
satisfied completely, partly, or in some extreme cases, some of them might also not be met. This violence is enabled by deviation variables. They are measured using positive and negative deviation variables that are defined for each goal separately, thus present-ing over- or under-achievement of the goal. The WgP formulation is expressed as a mathematical model with a single objective (achievement) func-tion. Since the objective function minimizes the sum of total deviation from set goals, the obtained result should yield compromise solution between contradictory goals. This is also the main difference between the LP and WgP since the objective func-tion in the WgP paradigm minimizes the undesirable deviations from the target goal values and does not minimize or maximize goals themselves like in the LP (Ferguson et al. 2006).
The quality of the obtained results is therefore strongly dependent on the selection of preferential weights. Since any deviation is undesired, the relative importance of each deviation variable is determined by the belonging weights. They can be set either by expert estimation or with analysis of shadow prices. To reduce bias in the obtained result, an alternative technique to define weights could be used (gass 1987).
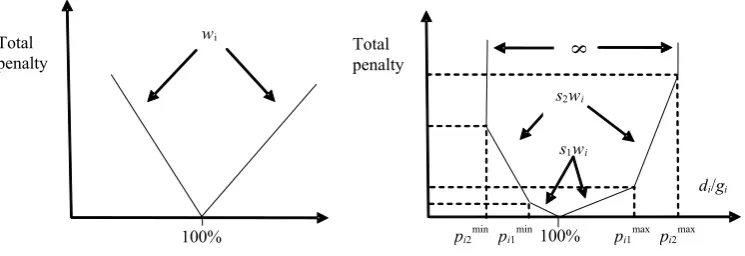
objectives set as goals are usually measured in dif-ferent units of measurement and could not therefore be just summed up, because this would manifest in incommensurability (Tamiz et al. 1998). To over-come this issue, deviations are scaled by using the normalisation technique (desired-actual)/desired). rehman and romero (1987) emphasized that in the WgP, any marginal change within one goal is of equal importance (constant penalty) no matter how distant it is from the target value (Figure 1).
This addresses another issue in the ration formula-tion example. namely, in some situaformula-tions a too large deviation might fail to meet the animals’ desired nu-trition requirements, and thus the obtained solution
will be useless. To keep deviations within the desired limits and to distinguish between different levels of deviations, the penalty function (Figure 1) might be introduced into the WgP (rehman, romero 1984).
Penalty function (PF) enables the fine-tuning of the positive and negative deviation intervals for each goal separately. Depending on the goal’s characteristics (nature and importance of 100% matching), these intervals might be different (Figure 1). Sensitivity of PF is dependent on the number and size of the defined intervals and the penalty scale utilised (si for
i = 1 to n). namely, any deviation is treated on the basis of the predefined several-sided penalty function and cannot exceed the defined margins of the outer intervals. Since the PF is connected with the WgP through objective function, it is an important factor in minimizing the sum of total deviations.
Description of the tool
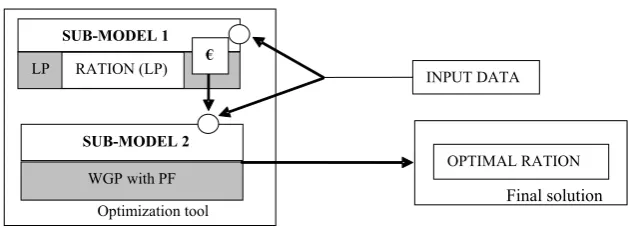
The presented tool has been developed as a spread-sheet in the MS Excel framework. it is structured as a two-phase model (sub-models) based on math-ematical programming techniques (LP and WgP with PF). The first sub-model is a classical example of the least-cost ration formulation. its purpose is to get a rough estimate of the ration cost, which is needed in the second sub-model (Figure 2). Since nutrition requirements might be in contradiction, especially in the case of higher daily milk yields, the first sub-model considers only the most important constraints.
The presented tool is developed as an open system, which means that all input data are recalculated for the analysed case. This is enabled by another model already developed (Žgajnar et al. 2007) that calculates the animals’ daily requirements and is linked with the presented tool (Figure 2).
di/gi
100%
wi
pi2min pi1min 100% pi1maxpi2max Total
penalty
s2wi
8
Total penalty
[image:3.595.109.482.594.722.2]s1wi
Mathematical formulation of the first and the second model
The first sub-model (LP) is formulated as shown in equations (1), (4), and (7). it mostly relies on eco-nomic (cost) function (C) and satisfies only the most important nutrition requirement coefficients (bi). it might neglect some ratios (the tool has the option to switch them on or off ), such as if the model is over-constrained and has no feasible solution. This is important since, when it happens, the second sub-model cannot yield a reasonable solution.
in the first optimization phase one is searching for the ration at the lowest possible cost (Figure 2). Except the minimum requirements that should be met, prices are the most important factor that dictates ration formulation. For on-farm produced forage, the total cost approach was considered, while for purchased feed, market prices were applied.
Equations of the first (LP) and the second sub-model (WgP with PF):
¦
n uj j j
X c C
1
min (1)
¦
¦
ki i i i i i i i k
i i g
d d w s g d d w s Z 1 2 2 2 1 1 1 1
min (2)
¦
n j i g i d i d i d i d j X ij a1 1 2 1 2
(3a)
for all i = 1 to r and gi ≠ 0
¦
nj j j i i i i
C
d
d
d
d
X
c
1 1 2 1 2
(3b)
for all i = 1 to r and C ≠ 0
¦
n dj i b j X ij a 1 (4)
for all i = 1 to m
i g i p i g i
d1 d min1 (5a)
for all i =1 to r
i g i p i g i d i
d1 2 d min2 (5b) for all i = 1 to r
i g i g i p i
d1d max1 (6a)
for all i = 1 to r
i g i g i p i d i
d1 2 d max2 (6b)
for all i = 1 to r
0 , 2 , 2 , 1 ,
1 t
j X i d i d i d i
d (7)
Where:
Z,C = objective function
aij = the quantity of the ith nutrient in one unit of jth feed
Xj = the level of jth feed cj = jth feed cost
bi = the amount of the ith resource available – right hand side (rhS)
gi = expected daily requirement of the ith nutrient (goal)
wi = weight expressing the relative importance of achieving the ith goal
s1 and s2 = penalty coefficients for the first and the sec- ond level of over- or under achievement of the goal
di1+, d
i1–, di2+, di2 = positive and negative deviation vari-
ables including over- and under-achievement of the ith goal
pi1min < 1, p
i1max > 1 = penalty function parameters defin-
ing first deviation interval of ith nutrient pi2min < 1, p
i2max < 1 = penalty function parameters defin-
ing second deviation interval of ith nutrient
[image:4.595.156.472.67.181.2]The second sub-model (WgP with PF) is formu-lated as shown in equations (2) to (7). The objective (achievement) function (2) expresses the aggregate unwanted deviations and is therefore subject to minimization. it is defined as the weighted sum of deviations. Since the PF is in place also, its coefficients (s1 and s2) are considered. Preferences of defined
Figure 2. Scheme of the optimization tool
WGP withPF OPTIMAL RATION
LP
SUB-MODEL 2 SUB-MODEL 1
Final solution Optimization tool
goals are reflected by weights (w) associated with the corresponding positive or negative deviations. The scale of deviations is controlled through the defined penalty intervals (5a, 5b, 6a, 6b). Because of the normalization process, only goals that have nonzero target values (3a, 3b) could be relaxed; all the rest must be considered as fixed constraints (4). The obtained target value (C) in the first sub-model (LP) enters into the second one (WgP with PF) as the cost goal (3b) that should be met as close as possible. This is also the only case where negative deviation is not penalised and also not restricted with intervals. The main assumption of the linear programming is the non-negativity that is considered for the first sub-model (X ≥ 0) as for the second one in equation (7).
Input data
The presented tool has been tested on a simple ra-tion formulara-tion example for a 650 kg dairy cow in the 150th day of lactation (total milk yield envisaged
is 7 000 kg) with a daily milk yield of 25 kg and nu-tritional requirements for the 90th day of pregnancy.
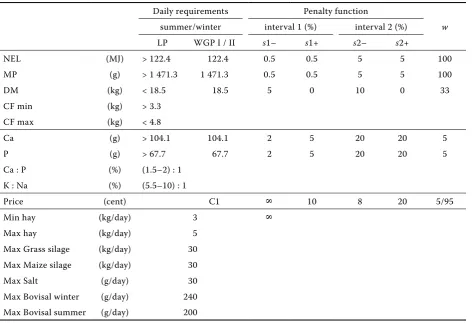
The most important constraints and goals for the analysed case are presented in Table 1.
A basic set of constraints (LP and WgP support-ed by PF) is more or less the same in both models. nutritional constraints presented in Table 2 differ only in mathematical sign when nutrient requirements are transformed into goals. in the case when least-cost criterion is considered (LP), only the most important (non-conflicting) minimum or maximum constraints must be met. This might manifest in an ‘unrealistic’ diet. nevertheless, this simplification has been made due to the fact that the LP module is needed foremost to give a rough estimation of the lowest possible diet cost. Undisputedly, an unbalanced ration is cheaper, and on one hand, this assures a feasible solution that is necessary, but on the other hand, the WgP with PF is encouraged to draw the price close to the one that might be achieved in practice.
[image:5.595.64.540.445.768.2]in the everyday ration formulation process, one also has to consider constraints concerning quantities of feed, which must be included into the ration. in this case study, we assumed that the ration should include at least 3 kg of hay, but its quantity should not exceed 5 kg. Both sub-models should also not exceed the maximum quantity of grass and maize silage (Table 1).
Table 1. Daily nutrition requirements for dairy cow with 25 kg milk yield and requirements for 90th day of pregnancy, presented as constraints (LP) and set of goals in WgP
Daily requirements Penalty function
w summer/winter interval 1 (%) interval 2 (%)
LP WgP i / ii s1– s1+ s2– s2+
nEL (MJ) > 122.4 122.4 0.5 0.5 5 5 100
MP (g) > 1 471.3 1 471.3 0.5 0.5 5 5 100
DM (kg) < 18.5 18.5 5 0 10 0 33
cF min (kg) > 3.3
cF max (kg) < 4.8
ca (g) > 104.1 104.1 2 5 20 20 5
P (g) > 67.7 67.7 2 5 20 20 5
ca : P (%) (1.5–2) : 1
K : na (%) (5.5–10) : 1
Price (cent) c1 8 10 8 20 5/95
Min hay (kg/day) 3 8
Max hay (kg/day) 5
Max grass silage (kg/day) 30
Max Maize silage (kg/day) 30
Max Salt (g/day) 30
Max Bovisal winter (g/day) 240
Since the tool has been used to formulate both the winter and summer diet separately, there are also different quantities of the allowed mineral vitamin mixtures included (declared by the producer).
The initial version of the WgP model involves six goals supported by the PF (Table 1). The relative im-portance of each goal is defined with weights ranging between 0 and 100. As the most important goals to be met in our case, there are regarded the satisfaction of energy (nEL) and protein (MP) requirements (100), in both cases the deviation intervals are very restricted, since only 0.5% positive and negative deviations are allowed in the first stage and 5% in the second one. A much lower weight is foreseen for the dry matter intake that presents the consumption capacity. in this case, the deviation intervals are defined only for the underachievement of the goal, while for the practical reasons (consumption capacity), overachievement is not allowed. Besides that, an additional constraint is included to ensure that the proportion of dry matter derived from voluminous forage does not exceed 14 kg of DM. Since the nutritionists’ doctrine ensures that it is more important to satisfy the ratio between ca and P and also between K and na than to meet the estimated mineral requirements, we consider
rela-tively low weights for mineral (ca, P) goals. All the remaining minerals are controlled through several safety measures, which prevent deficits as well as toxic concentrations.
With the applied approach we have tested how the ‘optimal’ ration would change due to different preferences concerning the cost goal. This analysis manifests in two scenarios. in the first scenario, the cost of the obtained ration (WgP i) was of minor importance (w = 5), while in the second scenario (WgP ii), its importance was increased (w = 95). in both scenarios, the deviation intervals remain the same (+10% and +20%).
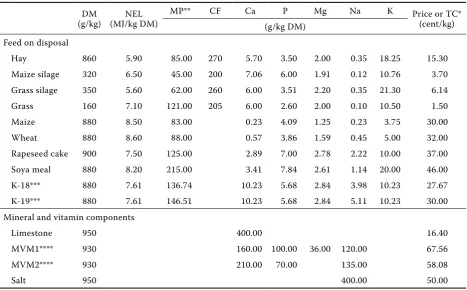
The ingredients assumed to be available for formu-lating the rations and their characteristics are given in Table 2. The described feed characteristics are mostly dependent on soil structure, application of fertilizers, and intensity of production. consequently, high vari-ability in nutrition quality might arise in practice. Due to this fact, a chemical analysis for each feed used (when analysing the practical case) should be performed to prevent errors in the formulated ration.
[image:6.595.64.532.432.722.2]We assumed that all voluminous forage (hay, maize silage, grass silage, and grass) is produced on the farm. of course grass might be included only in summer
Table 2. nutritive value of feed on disposal DM
(g/kg) (MJ/kg DM)nEL
MP** cF ca P Mg na K Price or Tc*
(cent/kg) (g/kg DM)
Feed on disposal
hay 860 5.90 85.00 270 5.70 3.50 2.00 0.35 18.25 15.30
Maize silage 320 6.50 45.00 200 7.06 6.00 1.91 0.12 10.76 3.70
grass silage 350 5.60 62.00 260 6.00 3.51 2.20 0.35 21.30 6.14
grass 160 7.10 121.00 205 6.00 2.60 2.00 0.10 10.50 1.50
Maize 880 8.50 83.00 0.23 4.09 1.25 0.23 3.75 30.00
Wheat 880 8.60 88.00 0.57 3.86 1.59 0.45 5.00 32.00
rapeseed cake 900 7.50 125.00 2.89 7.00 2.78 2.22 10.00 37.00
Soya meal 880 8.20 215.00 3.41 7.84 2.61 1.14 20.00 46.00
K-18*** 880 7.61 136.74 10.23 5.68 2.84 3.98 10.23 27.67
K-19*** 880 7.61 146.51 10.23 5.68 2.84 5.11 10.23 30.00
Mineral and vitamin components
Limestone 950 400.00 16.40
MVM1**** 930 160.00 100.00 36.00 120.00 67.56
MVM2**** 930 210.00 70.00 135.00 58.08
Salt 950 400.00 50.00
rations. Since these forages are usually not tradable, we estimate the total cost of their production on the basis of ‘model calculations’ prepared by the Agricultural institute of Slovenia (KiS 2007). All other forage and mineral-vitamin components on disposal could be purchased at market prices (Table 2). The question raised might be what should be grown on the farm to improve profitability, but this issue is very complex and is beyond the scope of the paper.
RESULTS AND DISCUSSION
The tool has been tested on a simple everyday ex-ample (650 kg dairy cow with a milk yield of 25 kg/day and 90th day of pregnancy). it was run four times,
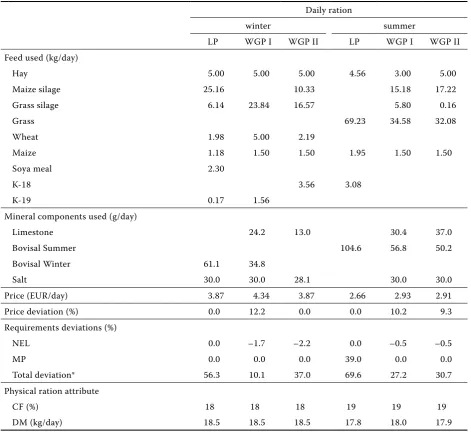
two times for the winter period and two times for the summer period, where grass was also at the cows’ disposal. The formulated daily rations for both peri-ods are presented in Table 3, including LP solutions. The latter serve only to estimate the diet least-cost and might not be really applicable since they are simplified.
There is a significant difference between the com-positions of winter and summer rations, as well as the rations within each season (Table 3). The first difference is self-explanatory – there is grass available in the summer season – while the second difference manifests itself through different preferential weights and a PF in place.
[image:7.595.63.535.315.749.2]in winter rations (WgP i and WgP ii), protein re-quirements are mainly covered with grass silage and
Table 3. obtained daily rations formulated with LP and WgP with cost penalty function scenarios Daily ration
winter summer
LP WgP i WgP ii LP WgP i WgP ii
Feed used (kg/day)
hay 5.00 5.00 5.00 4.56 3.00 5.00
Maize silage 25.16 10.33 15.18 17.22
grass silage 6.14 23.84 16.57 5.80 0.16
grass 69.23 34.58 32.08
Wheat 1.98 5.00 2.19
Maize 1.18 1.50 1.50 1.95 1.50 1.50
Soya meal 2.30
K-18 3.56 3.08
K-19 0.17 1.56
Mineral components used (g/day)
Limestone 24.2 13.0 30.4 37.0
Bovisal Summer 104.6 56.8 50.2
Bovisal Winter 61.1 34.8
Salt 30.0 30.0 28.1 30.0 30.0
Price (EUr/day) 3.87 4.34 3.87 2.66 2.93 2.91
Price deviation (%) 0.0 12.2 0.0 0.0 10.2 9.3
requirements deviations (%)
nEL 0.0 –1.7 –2.2 0.0 –0.5 –0.5
MP 0.0 0.0 0.0 39.0 0.0 0.0
Total deviation* 56.3 10.1 37.0 69.6 27.2 30.7
Physical ration attribute
cF (%) 18 18 18 19 19 19
DM (kg/day) 18.5 18.5 18.5 17.8 18.0 17.9
purchased fodder K-19 (WgP i) and K-18 (WgP ii). it is obvious that prices play a significant role since more restricted cost conditions (WgP ii) have a significant impact on the inclusion of (expensive) grass silage. This is even more obvious in the summer season, where the main source of protein is much cheaper grass (WgP i) and some negligible quantity of grass silage (WgP ii). grass is therefore the crucial trig-ger for the difference between summer and winter rations composition. As already stated, the second difference is caused by preferential weights and the penalty system in place.
The penalty system enables one to control the de-viations from the set target values (goals). The more severe cost penalty system (through higher relative importance w = 95) in the second scenario has a significant impact in both seasons from the nutri-tion quality aspect. Even though the WgP ii ranutri-tions are more balanced, in the summer season they are by 9.3% more expensive, while in the winter season, there is no difference in estimated cost at all. At a first glance, the least cost ration seems better, since the energy and protein requirements are fully met. Anyhow, if one considers also the sum of the total deviation as a measure of the ‘quality’ of obtained results, it is obvious that the WgP ii ration is better than the LP’s one, since the LP neglects some nutri-tion objectives. This fact is even more powerfully manifested in the first scenario (WgP i), where the importance of the cost goal is reduced (w = 5). As a result, prices increase in comparison to the second scenario for 0.9 to 12.2%, but total deviations (as a quality parameter) improve from 3.5 up to 26.9%, re-spectively. This could be explained as the competition between nutrition quality and economics. however, when rations are not balanced – even if the individual parameter requirements are fulfilled – one cannot expect to achieve the anticipated daily yields. This is especially true when very high (> 35 kg) daily milk yields are analysed.
CONCLUSIONS
The aim of this paper was to present a simple spread-sheet tool that can support daily management tasks – the dairy cow ration formulation. The applied ap-proach – a combination of the LP paradigm and the WgP with PF – proves to be a useful ‘engine’ in an end-user application. it enables one to formulate close to least-cost ration, not taking a too high a risk of worsening the ration’s nutritive value, which is the main common drawback of the LP. rations might be additionally improved with fine-tuning enabled
through the PF that differs between the deviation sizes for each goal separately. This significantly re-flects in the obtained rations, especially in the sum-mer season. This can be illustrated with the case presented in this paper, where the formulation of a daily ration only by the least cost criterion resulted in a 39% surplus of proteins in the summer ration, which might seriously affect the animals’ health. in spite of a slightly higher price, cost efficiency can be improved through numerous factors. on one hand, surpluses cost money and have a negative impact on production (daily milk yields). on the other hand, they also increase greenhouse gas emissions (Brink et al. 2001).
general efficiency is becoming more and more important in nutrition management and this seems to be emphasised in line with the general globaliza-tion impacts (input price rise, price volatility, and environmental as well as climate change aspects). The developed tool might be useful also for the assessment of impact consequences by preparing calculations for different situations and technology types. it may also be useful in assessing variable costs of feed used or to provide an answer on different sector questions such as how market changes are affecting the ‘optimal’ animal diets through longer periods.
Acknowledgements
Thanks are due to Lecturer Ajda Kermauner Kavčič and Asist. Prof. Andrej Lavrenčič for their support in evaluation of obtained rations.
REFERENCES
Brink c., Kroeze c., Klimont z. (2001): Ammonia abatement and its impact on emissions of nitrous oxide and methane in Europe – Part 1: method. Atmospheric Environment, 35 (36): 6299–6312. castrodeza c., Lara P., Pena T. (2005): Multicriteria
fractional model for feed formulation: economic, nutritional and environmental criteria. Agricultural Systems, 86 (1): 76–96.
Ferguson E.L., Darmon n., Fahmida U., Fitriyanti S., harper T.B., Premachandra i.M. (2006): Design of optimal food-based complementary feeding rec-ommendations and identification of key “Problem nutrients” using goal programming. The Journal of nutrition, 136 (9): 2399–2404.
KiS (2007): Model calculations (unpublished). Agri-cultural institute of Slovenia, Ljubljana.
Lara P. (1993): Multiple objective fractional program-ming and livestock ration formulation: A case study for dairy cow diets in Spain. Agricultural Systems,
41 (3): 321–334.
Lara P., romero c. (1994): relaxation of nutrient requirements on livestock rations through interac-tive multigoal programming. Agricultural Systems,
45 (4): 443–453.
rehman T., romero c. (1984): Multiple-criteria deci-sion-making techniques and their role in livestock ration formulation. Agricultural Systems, 15 (1): 23–49.
rehman T., romero c. (1987): goal Programming with penalty functions and livestock ration formu-lation. Agricultural Systems, 23 (2): 117–132. rehman T., romero c. (1993): The application of the
McDM paradigm o the management of agricultural
systems: Some basic considerations. Agricultural Systems, 41 (2): 239–255.
romero c., rehman T. (2003): Multiple criteria anal-ysis for agricultural decisions. 2nd ed. Elsevir, Amsterdam.
Tamiz M., Jones D., romero c. (1998): goal pro-gramming for decision making: An overview of the current state-of-the-art. European Journal of operational research, 111 (6): 569–581.
Waugh F.V. (1951): The minimum-cost dairy feed. Journal of Farm Economics, 33 (3): 299–310. zgajnar J., Kermauner A., Kavcic S. (2007):
Esti-mation of ruminants’ nutritional requirements and livestock ration optimization (in Slovene). in: Slovensko kmetijstvo in podezelje v Evropi, ki se siri in spreminja. 4. konferenca DAES. Kavcic S. (ed). Ljubljana, Drustvo agrarnih ekonomistov Slovenije, Domzale, pp. 279–288.
Arrived on 27th november 2008
Contact address:
Jaka Žgajnar, BSc, University of Ljubljana, Biotechnical Faculty, zootechnical Department, chair for Agricultural Economics, Policy and Law, groblje 3, Si-1230 Domžale, Slovenia