JOURNAL OF FOREST SCIENCE, 59, 2013 (10): 391–397
On the way to continuous cover forest at middle
elevations – the question of forest structure
and specific site characteristics
L. Bílek, J. Remeš, O. Švec, D. Zahradník
Faculty of Forestry and Wood Sciences, Czech University of Life Sciences Prague, Prague, Czech Republic
ABSTRACT: The transformation process of even-aged forest stands to irregular forest stands on waterlogged sites after
20 years effort was analysed. Data from two 1-ha PRP was analysed with special focus on structural (Shannon Evenness Index, Simpson Index and Gini Index) and species (Shannon Evenness Index and Simpson Index) diversity. Different development on study plots confirmed that the highest structural diversity is not often compatible with the concept of species diversity. On PRP 1 high diameter differentiation has led to lower values of species diversity, while on PRP 2 rather moderate diameter differentiation supported higher species diversity in lower DBH classes. The Gini Index was confirmed to be the best indicator for monitoring the diameter differentiation in the course of stand transformation.
Keywords:Dauerwald; stand transformation; diversity; production; waterlogged site
Supported by the Ministry of Agriculture of the Czech Republic, Project No. QI102A085, and by the Technology Agency of the Czech Republic, Project No. TB010MZP050, and by the Czech University of Life Sciences Prague, Project No. IGA FLD 201320134365.
Since the beginning of the 19th century, different methods of natural regeneration and single-tree ori-ented systems of management have been developed in Western Europe, mainly in southern Germany and in Switzerland (Schmidt 2009). The continuous cover forest, as “Dauerwald” introduced into forestry practice by Alfred Möller in the 1920s, is a concept of forest management which tries to avoid sudden jumps between forest generations and in one of its forms – the selection forest – represents a silvicultural system where the age of individual trees is no more decisive for their harvest, as it is usual in the age-class forestry and its traditionally described forms. New discus-sions on this topic in forest literature have shown that the near-natural silviculture has to be formulated in a much broader sense than only renewal on a tree-by-tree basis but also as the renewal and growth of tree-by-trees in discrete generations using progressive group felling – “Femelschlag”; all this with the same goal in mind,
po-tential for using natural processes for economic rea-sons (Schütz 1999a, 2009; Knoke et al. 2001). The resulting scenario also emerges as the optimal choice, particularly for cautious and thus risk-avoiding forest owners who do not have the opportunity to diversify risks by means of large-scale forest properties (Hane-winkel 2002; Roessiger et al. 2011).
This liberal definition is also much better reflect-ing the existreflect-ing forest practice, where the site and climatic characteristics are often limiting for creat-ing a functional selection forest. The application of the concept does however still demand a high level of silvicultural competence. The forest manager must determine, based on the knowledge of the forest site and structure of the forest stand, which method of treatment will be best suited to the actual situation (Schütz 2002, 2009), taking into consideration the overall management goal and of course the past forest stand development.
In the research area, recurrent snow damage and wind breaks in even-aged stands of pine and spruce with subsequent weed infestation and waterlogging were the main impulse for the transformation of for-est management from age-class forfor-estry to Dauerwald (Remeš, Kozel 2006) characterised by continual re-newal, use of natural regeneration and liberal felling policy. Since the abandonment of clear-cut and start of the forest transformation in 1993 on large tracks of forest stands height and diameter differentiation has increased, in some parts the complex forest structure has developed till now.
This paper analyses the transformation process of cultural even-aged spruce and pine forest stands to irregular forest stands after 20 years effort on sites naturally dominated by oak and silver fir. The general aim is to evaluate a possibility of achieving permanent uneven-aged stands with complex forest structure; an optimal management goal in relation to the forest site is discussed.
MATERIAL AND METHODS
The area of interest is managed by Forests of the Czech Republic, State Enterprise. This territory is a part of the Konopiště Forest Enterprise, Říčany Forest District. The average temperature of the area is 7.5°C, the vegetation period lasts about 150 days, total annual precipitation amounts to 600 mm, with less than 400 mm within the vegetation pe-riod. The site type on both plots according to the Czech typological system of forest management planning was classified as 4P – Querceto-abietum,
elevation is 480 m a.s.l., with flat relief.
Data was collected from two 1-ha (100 × 100 m) per-manent research plots (PRP 1 Triangle: 49°58'19''N, 14°43'13''E; PRP 2 Swamp: 49°58'19''N, 14°43'28''E). Within each PRP all woody stems ≥ 8 cm DBH were repeatedly measured after six-year periods in 2000, 2006 and 2012. For each stem, diameter (double mea-surement in NS and EW), total height and crown height (Vertex hypsometer, to the nearest 0.1 m) were measured. Stand density, volume and stand basal area were calculated by standard mensurational meth-ods using volume equations (Petráš, Pajtík 1991).
As spatially inexplicit indices quantifying diameter diversity, the Shannon Evenness Index (SEI) (Shan-non, Weaver 1949; Pielou 1969), the Simpson Index (D)(Simpson 1949) and the Gini Index (Gini 1921) were computed. The Gini Index was calculated from original individual tree data. In our study, a re-ciprocal form of the Simpson index (1-index value) was adopted in order to increase the index with in-creasing diversity. We calculated the basal area (G) proportions.
SEI =
–∑
pi × ln pi(1)
ln (S)
D = 1
–∑
pi2(2)
where:
S – number of diameter classes,
pi – proportion of basal area in diameter class i (m2·ha–1). Shannon Evenness Index takes values between 0 for only one diameter class and 1 when all diam-eter classes are equally abundant. Simpson Index can assume values between 0 and 1 and is inter-preted as the probability that any two trees taken at random belong to different diameter classes. The Gini Index was obtained from the area under the Lorenz curve, which in turn was derived by plotting the cumulative basal area proportions of trees per hectare against the cumulative propor-tions of the number of stems per hectare, after sorting the sample trees according to ascending di-ameter (Sterba 2008).
The Gini coefficient quantifies the deviation from perfect equality, and has a minimum value of zero, when all trees are of equal size, and a theoretical maximum of one in an infinite population in which all trees except one have a value of zero (Lexerød, Eid 2006).
As a measure of spatially inexplicit species diversity the Shannon Evenness Index (Shannon, Weaver 1949) and the Simpson Index (Simpson 1949) were used. Here the number of diameter classes was
re-s
i=1
s
placed by the number of tree species, the basal area of diameter class was replaced by the number of indi-viduals for each species. Species diversity indices were computed both for the whole plot and for the particu-lar diameter classes.
RESULTS
Liocourt model curve (Liocourt 1898) was used to model an ideal selection forest structure for PRP 1 and PRP 2 (Fig. 1a,b). Based on this model curve,
0 20 40 60 80 100 120 140
10 14 18 22 26 30 34 38 42 46 50 54 58 62 74 78 82
N (indd·h a –1) 2000 2006 2012 (a) 0 10 20 30 40 50 60 70 80
10 14 18 22 26 30 34 38 42 46 50 54 58 62 74 78 82
V
(m
3·h
a
–1)
Model standing volume 2000 2006 2012 (c) 0.00 0.20 0.40 0.60 0.80 1.00 1.20 1.40 1.60
10 14 18 22 26 30 34 38 42 46 50 54 58 62 66 78 82
In ce re ment ( m 3·h a –1·y r –1) 2000–2006 2006–2012 (e) 0 2 4 6 8 10 12 14 16 18 20
10 14 18 22 26 30 34 38 42 46 50 54 58
Cu
t (m
3·h
a
–1)
DBH classes (cm)
Spruce Pine Birch total cut
(g)
10 14 18 22 26 30 34 38 42 46 50 54 58 62 66
10 14 18 22 26 30 34 38 42 46 50 54 58 62 66 0 20 40 60 80 100 120 140 (b) 0 10 20 30 40 50 60 70 80 (d)
10 14 18 22 26 30 34 38 42 46 50 54 58 62 66
10 14 18 22 26 30 34 38 42 46 50 54 DBH classes (cm)
0 2 4 6 8 10 12 14 16 18 20 (h) 0.00 0.20 0.40 0.60 0.80 1.00 1.20 1.40 1.60 (f)
Model curve Liocourt A = 110, q = 1.3
PRP 1 PRP 2
Fig.1.Diameter curve (a, b); standing volume (c, d), current annual volume increment (e, f) and total cut from 2000 to 2012
Table 1. Development of standing volume, stand basal area, tree numbers, felling, ingrowth, current annual volume incre-ment and increincre-ment in 2000, 2006 and 2012 on PRP 1
Year Spruce Pine Larch Birch Total
Standing volume (m3·ha–1)
2000 108.52 140.76 2.61 0.91 252.87
2006 143.05 148.80 3.27 3.95 299.07
2012 149.69 113.62 4.85 4.36 272.52
Stand basal area (m2·ha–1)
2000 9.93 11.58 0.23 0.15 21.89
2006 13.04 12.09 0.29 0.54 25.97
2012 14.38 8.68 0.42 0.67 24.15
Tree numbers (indd·ha–1)
2000 160 81 2 10 253
2006 239 78 6 31 354
2012 388 54 11 23 476
Felling (m3·ha–1) 2000–2006 1.06 1.92 0.00 0.30 3.28
2006–2012 29.53 47.67 0.00 1.62 78.82
Ingrowth (m3·ha–1) 2000–2006 4.77 0.00 0.24 1.02 6.03
2006–2012 11.06 0.00 0.44 0.34 11.84
Current annual volume
[image:4.595.64.532.498.756.2]increment (m3·ha–1) 2000–20062006–2012 4.195.13 1.692.08 0.190.07 0.280.37 7.266.74 Increment (%) 2000–20062006–2012 3.582.80 1.121.83 2.093.93 9.366.46 2.422.47
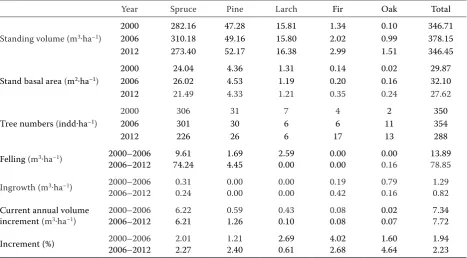
Table 2. Development of standing volume, stand basal area, tree numbers, felling, ingrowth, current annual volume incre-ment and increincre-ment percent in 2000, 2006 and 2012 on PRP 2
Year Spruce Pine Larch Fir Oak Total
Standing volume (m3·ha–1)
2000 282.16 47.28 15.81 1.34 0.10 346.71
2006 310.18 49.16 15.80 2.02 0.99 378.15
2012 273.40 52.17 16.38 2.99 1.51 346.45
Stand basal area (m2·ha–1)
2000 24.04 4.36 1.31 0.14 0.02 29.87
2006 26.02 4.53 1.19 0.20 0.16 32.10
2012 21.49 4.33 1.21 0.35 0.24 27.62
Tree numbers (indd·ha–1)
2000 306 31 7 4 2 350
2006 301 30 6 6 11 354
2012 226 26 6 17 13 288
Felling (m3·ha–1) 2000–2006 9.61 1.69 2.59 0.00 0.00 13.89
2006–2012 74.24 4.45 0.00 0.00 0.16 78.85
Ingrowth (m3·ha–1) 2000–2006 0.31 0.00 0.00 0.19 0.79 1.29
2006–2012 0.24 0.00 0.00 0.42 0.16 0.82
Current annual volume
increment (m3·ha–1) 2000–20062006–2012 6.226.21 1.260.59 0.430.10 0.080.08 0.070.02 7.347.72 Increment (%) 2000–20062006–2012 2.012.27 1.212.40 2.690.61 4.022.68 1.604.64 1.942.23
a model standing volume was calculated and compared with standing volume of forest stands in 2000, 2006 and 2012 (Fig. 1c,d).Current annual volume increment and the sum of harvested wood volumes for particular tree species and DBH classes are shown in Fig. 1e–h.
Basic stand development characteristics are listed in Table 1 for PRP 1 and in Table 2 for PRP 2. Current annu-al volume increment is very similar on both plots with
indi-are slightly below and slightly above the initial values from 2000 on PRP 1 and PRP 2, respectively. The Gini index indicates on both plots continuous diameter differentiation with the highest values at the end of the observation period in 2012.
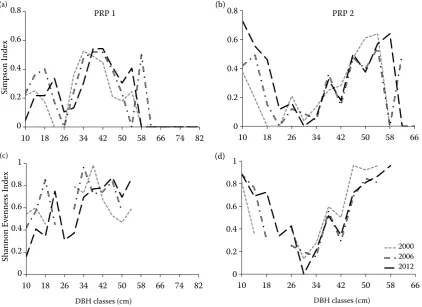
On PRP 1 Shannon Evenness Index as a measure of species diversity increased from 0.592 to 0.638 during the first observation period and then it dropped again to 0.467 in 2012.Similar development was also found out in Simpson Index with the initial value of 0.496 in 2000, 0.490 in 2006 and 0.320 in 2012. On PRP 2 Shan-non Evenness Index continually increased from the initial value of 0.305 to 0.369 in 2006 and 0.424 in 2012. Simpson Index basically confirmed the same growth of tree species diversity from the initial value of 0.227 to 0.268 in 2006 and 0.389 in 2012. Fig. 2 documents both diversity indices calculated for particular DBH classes on PRP 1 and PRP 2. Shannon Evenness Index curves are discontinuous in case that only one species was present in the particular DBH class.
DISCUSSION
Often antagonistic demands on forestry in general and on close-to-nature silviculture in particular have been described in numerous articles (e.g. Schütz viduals are spruces, on PRP 2 mostly oak and silver fir
contributed to the secondary stand. On both plots the felling intensity was rather low during the first period; on the contrary, during the second observation period the removed wood volumes amounted to 79m3·ha–1 on both plots.
Diameter diversity and/or diversity of basal areas on PRP 1 and PRP 2 are presented in Table 3. Shan-non Evenness Index and Simpson Index identically indicate the highest diameter diversity on both PRP in the middle of the observation period in 2006, and in 2012 again lower values of structural diversity, which
0 0.2 0.4 0.6 0.8
10 18 26 34 42 50 58 66 74 82
Sim
ps
on
In
dex
(a)
0 0.2 0.4 0.6 0.8 1
10 18 26 34 42 50 58 66 74 82
DBH classes (cm)
Shannon E
venne
ss Inde
x
(c)
0 0.2 0.4 0.6 0.8
10 18 26 34 42 50 58 66
(b)
0 0.2 0.4 0.6 0.8 1
10 18 26 34 42 50 58 66
2000 2006 2012
DBH classes (cm)
(d)
[image:5.595.64.291.98.243.2]PRP 1 PRP 2
Fig. 2.Simpson Index (a, b) and Shannon Evenness Index (c, d) diversity indices calculated for particular DBH classes
[image:5.595.90.513.417.724.2]on PRP 1 and 2 in 2000, 2006 and 2012
Table 3. Shannon Evenness, Simpson and Gini indices as measures of diameter diversity on PRP 1 and 2 in 2001, 2006 and 2012
Index Year PRP 1 PRP 2
Shannon Evenness
2000 0.764 0.742
2006 0.819 0.784
2012 0.751 0.757
Simpson
2000 0.847 0.819
2006 0.872 0.850
2012 0.839 0.839
Gini
2000 0.442 0.345
2006 0.522 0.358
1999a,b). The development of forest structure on PRP 1 and PRP 2 confirmed to a certain extent that the high-est structural diversity is not often compatible with the concept of species diversity. On PRP 1 individual selection favoured the dominance of spruce in the regeneration layer and led to an overall decrease of tree species diversity in lower DBH classes (Fig. 2a,c). On the contrary, on PRP 2, where historically larger regeneration patches with artificial regeneration of silver fir and oak were created, the species diversity reached the same values in lower dbh classes as in the upper layer with a still higher proportion of pine and larch (Fig. 2b,d). Considering the horizontal struc-ture of both stands, the main difference is that on PRP 1 new cohorts are interspersed among older co-horts, while on PRP 2 new cohorts are forming fam-ily groups or clusters of artificial regeneration. Both strategies for converting even-aged stands to uneven-aged ones may lead to a fully implemented selection system (Nyland 2003), yet with different structural development of these stands. Surprisingly, both strat-egies after 20 years of implementation has led to the same wood removals with the same or even higher standing wood volumes in 2012 compared to 2000. The question of species diversity remains crucial.
The three evaluated structural coefficients were selected in order to include indices represent-ing different properties. While the Gini Index is mainly influenced by the range, the Simpson In-dex is defined as a dominance measure and the Shannon Evenness Index is a measure of evenness. An additional advantage of these three selected indices is that the index value does not change when the density of each diameter class is raised in the same proportion. This makes it possible to compare diameter diversity in different stands or in one stand over time, independently of the stand density (Lexerød, Eid 2006). Indices ranging be-tween 0 and 1 are also easy to interpret and allow a quick comparison between each other.
In this study we also omitted frequently used distance dependent indices, since they consider-ably increase sampling costs and are therefore less suitable for practical forest management. Surpris-ingly, Shannon Evenness Index and Simpson In-dex showed almost identical values for both PRPs, while the Gini coefficient clearly indicated differ-ences among plots and particular periods in ac-cordance with the diameter curve (Fig. 1a,b) and its shift from 2000 to 2012. This observation is in accordance with Lexerød and Eid (2006), who showed the highest discriminant ability and best logical ranking for the Gini index. Also Valbuena et al. (2012) pointed out a certain inconsistency
of diversity indices when comparing forest struc-tural types and recommended measures of equita-bility of tree sizes.
Based on data from the Norwegian National Forest Inventory, Lexerød and Eid (2004) found that the Gini coefficient varied from 0.16 to 0.68 in coniferous forests, with a mean value of 0.45. The theoretical value of 1 indicates total inequal-ity with all individuals except that with the value of zero. This is an impossible situation in forest stands, since all stems have a basal area larger than zero.
Lexerød and Eid (2006) analysed an empiri-cal data set with diameter distributions typiempiri-cal of even-aged and uneven-aged forest stands, as well as approximations of other distributions with the Gini coefficient varying from 0.21 to 0.51, with a mean value of 0.38. In simulated diameter distri-butions the Gini coefficient varied from 0.16 to 0.57, with a mean value of 0.40 (the range of 0.16 to 0.30 indicating normal distribution; the range of 0.44–0.57 indicating J-shaped distribution).
Compared to these values the diameter dif-ferentiation expressed as the Gini coefficient on PRP 1 in 2012 is extremely high and is close to the upper limit of this indicator. On the other hand, distinctly lower values of Gini index on PRP 2 in-dicate quite a uniform diameter distribution. Ac-cording to Duduman (2011) DBH distribution on PRP 1 can be characterised as uneven-sized with a shift from irregular to balanced, and on PRP 2 as two-sized.
Gini Index is the best tool able to monitor a shift from even- to uneven-sized forest stands as result of continuing transformation efforts.
References
Duduman G. (2011): A forest management planning tool to cre-ate highly diverse uneven-aged stands. Forestry, 84: 301–314. Gini C. (1921): Measurement of inequality on income.
Eco-nomic Journal, 31: 22–43.
Hanewinkel M. (2002): Comparative economic investigations of even-aged and uneven-aged silvicultural systems: a critical analysis of different methods. Forestry, 75: 473–481. Hofmann G. (1998): Alfred Möller Leitbild einer
zukunfts-orientierten Waldwirtschaft. Allgemeine Forst Zeitschrift/ Wald, 53: 674–678.
Knoke T., Moog M., Plusczyk N. (2001): On the effect of volatile stumpage prices on the economic attractiveness of a silvicultural transformation strategy. Forest Policy and Economics, 2: 229–240.
Lexerød N., Eid T. (2004): Potensielt areal for selektive hogster i barskog – en kvantifisering basert paå Landsskogtakseringens prøveflater. [Potential area for selective cutting in coniferous forests – quantification based on the National Forest Inven-tory data.] Rapport fra skogforskningen, 7: 1–35.
Lexerød N.L., Eid T. (2006): An evaluation of different diameter diversity indices based on criteria related to forest manage-ment planning. Forest Ecology and Managemanage-ment, 222: 17–28. Liocourt F. (1898): De l’amenagement des sapinieres. Bulletin
de la Societe forestiere de Franche-Comte et des Provinces de I’Est, 4: 396–409.
Nyland R.D. (2003): Even- to uneven-aged: The challenges of conversion. Forest Ecology and Management, 172: 291–300. Pielou E.C. (1969): An Introduction to Mathematical Ecology.
New York, Wiley Interscience: 286.
Remeš J., Kozel J. (2006): Structure, growth and increment of the stands in the course of stand transformation in the
Klokočná Forest Range. Journal of Forest Science, 52: 537–546.
Roessiger J., Griess V.C., Knoke T. (2011): May risk aversion lead to near-natural forestry? A simulation study. Forestry, 84: 527–37.
Saniga M., Szanyi O. (1998): Modely výberkových lesov vo vybraných lesných typoch a geografických celkoch Slovenska. [Models of selective cultivation of forests in selected forest types and geographic areas of Slovakia.] Vedecké štúdie 4, TS TU Zvolen, 50.
Schmidt U.E. (2009): Wie erfolgreich war das Dauerwald-konzept bislang: eine historische Analyse. [Continuous cover forests – a success? A historical analysis.] Schweizerische Zeitschrift für Forstwesen, 160: 144–151.
Schütz J.P. (1999a): Close-to-nature silviculture: is this concept compatible with species diversity? Forestry, 72: 359–366. Schütz J.P. (1999b): Naturnaher Waldbau: gestern, heute,
mor-gen. [Near-natural silviculture: yesterday, today, tomorrow.], Schweizerische Zeitschrift fur Forstwesen, 150: 478–483. Schütz J.P. (2002). Silvicultural tools to develop irregular and
diverse forest structures. Forestry, 75: 329–337.
Schütz J.P. (2009): La forêt pérenne: aimable rêverie sylvicole ou concept d’avenir? (essai). [The continuous cover forest: a pleasant forestry daydream or a concept for the future? (essay).] Schweizerische Zeitschrift für Forstwesen, 160: 132–136.
Shannon C., Weaver W. (1949): The Mathematical Theory of Communication. Urbana, The University of Illinois Press: 125. Simpson E.H. (1949): Measurement of diversity. Nature, 163:
688–688.
Sterba H. (2008): Diversity indices based on angle count sampling and their interrelationships when used in forest inventories. Forestry, 81: 587–597.
Valbuena R., Packalén P., Martín-Fernández S., Mal-tamo M. (2012): Diversity and equitability ordering profiles applied to study forest structure. Forest Ecology and Manage-ment, 276: 185–195.
Received for publication September 12, 2013 Accepted after corrections October 15, 2013
Corresponding author:
Ing. Lukáš Bílek, Ph.D., Czech University of Life Sciences Prague, Faculty of Forestry and Wood Sciences, 165 21 Prague 6-Suchdol, Czech Republic