https://www.scirp.org/journal/jtts ISSN Online: 2160-0481 ISSN Print: 2160-0473
DOI: 10.4236/jtts.2019.94027 Sep. 24, 2019 439 Journal of Transportation Technologies
Evaluating Hazard Response Behavior of a
Driver Using Physiological Signals and
Car-Handling Indicators in a Simulated
Driving Environment
Joseph Kamau Muguro, Minoru Sasaki
*, Kojiro Matsushita
Department of Mechanical Engineering, Gifu University, Gifu, Japan
Abstract
Road traffic accidents are a major cause of casualties and costly implications to all the stakeholders. Research focusing on the driver as one of the causal agent of accidents has been studied for centuries and with the advent of modernized driver assistance technologies. This paper sought to evaluate re-sponse of a driver using active-driving performance indicators like reaction time and physiological signal response (surface electromyogram), to under-stand hazard response behavior. Simulation of driving scenes was done using Unity3D engine and VR Head mounted display. The driver was presented with stimulus (collision objects) of different size and distance. From the re-sults, an event scene that the driver considered hazardous was marked with increased electromyography response distinct from non-event scenes. From the results, we noted an increase in pedal misapplication during hazard re-sponse. The proposed approach is applicable in a real time driving analysis for on-road risk level classification.
Keywords
SEMG, Driver Response Behavior, 3D-VR, Hazard Response
1. Introduction
Transportation is one of the most important industry as far as human life is concerned with often challenges of costly traffic accidents amongst others. Au-tomobile manufacturers and road infrastructure developers work hand in hand to ensure the safety of road users. To this end, advanced driver assistance and How to cite this paper: Muguro, J.K.,
Sasaki, M. and Matsushita, K. (2019) Eva-luating Hazard Response Behavior of a Driver Using Physiological Signals and Car-Handling Indicators in a Simulated Driving Environment. Journal of Trans-portation Technologies, 9, 439-449.
https://doi.org/10.4236/jtts.2019.94027
Received: July 17, 2019 Accepted: September 21, 2019 Published: September 24, 2019
Copyright © 2019 by author(s) and Scientific Research Publishing Inc. This work is licensed under the Creative Commons Attribution International License (CC BY 4.0).
http://creativecommons.org/licenses/by/4.0/
DOI: 10.4236/jtts.2019.94027 440 Journal of Transportation Technologies safety features have been incorporated in the modern automobile units. Tech-nologies like autopilot, lane assist, collision detection, automatic braking systems and others are in active deployment in highly automated cars.
In spite of these efforts, traffic accidents persist to the detriment of the stake-holders and massive property damages when such occurs. Accident prevention studies have been a topic of interest over decades since the invention of automo-biles. In the face of an accident, the three main factors in play are the environ-ment, the vehicle, and the driver [1]. In the 21st century, driver has received traction after it has become apparent that most of accidents are caused by hu-man error [2].
In a feature article [2], Japan highlights the need to incorporate driver analysis to reduce road traffic accidents (RTAs). According to the report, more than 60% road accidents occur around the same intersections, which the report terms as hazardous spots. As of 2016, the country had more than 3000 spots that fit this criterion. One of the criteria for determining a hazardous spot has been the oc-currence of multiple accidents around the same spot. The report describes the measures the stakeholders are employing to reduce RTAs. They recommend the use of finely tuned measures of analyzing traffic accident and clustering the oc-currence of such with big data mining. One of the future goal of the study is to incorporate driver behavior like harsh braking, over speeding sections, etc. and use big data analysis to identify potential hazardous spots.
Another paper [3] reported an approach for forward collision avoidance based on driver braking behavior. The paper posits that braking patterns/behavior can be useful to infer the perceived risk. The objective of the paper was to model a real-time risk classification of hazardous events. The challenge with this ap-proach and the one proposed by [2] for risk-level assessment and characteriza-tion of behavior is that, drivers have differing ways of handling impeding colli-sions. Even though braking is a natural response, it is difficult to capture all the dynamics of an impending hazard. As such, this paper seeks after use of physio-logical response.
DOI: 10.4236/jtts.2019.94027 441 Journal of Transportation Technologies This paper seeks to evaluate surprise responses of the drivers, that is, the reac-tion of the driver and the effects that surprise has on car-handling performance in a threatening situation. We focus on unpredictable scenarios (hazards) and evaluate driver performance in such conditions. Previous researches dealing with H.P have not addressed the relationship between H.P and car handling. One of the contribution of this paper is to point out any existing relationship between performance and surprise in driving environment.
We considered hazard response as the process of responding to perceived im-peding threatening situation in the road that if left alone would lead to a traffic accident. That is to say, we considered anticipation and reactionary response to driving events. H.P in [5] is associated with anticipation, surprise and complexi-ty. Anticipation is the notion that the driver recognized an impeding undesirable event and takes precautionary measures.
We define surprise as any event outside of the anticipatory realm in hazard reaction, in that, any occurrence that the driver could not predict accurately has potential to surprise. Surprise has to do with the required reactionary time be-fore the undesired event occurs. Complexity as suggested by [4] could range from changing lanes, exiting or joining moving traffic, etc. In these scenarios, if time was not highly constricted (e.g. slow moving traffic), complexity would be low leading to the driver feeling less pressured to act. In this case, the number of actions required and their urgency is a measure of complexity. From the above, we considered hazard reaction as properly captured by the three models sug-gested in [5] with slight modification to merge complexity with surprise. Ac-cording to [4], surprising events does not vary with drivers experience and hence in the experimental setup, drivers experience is only a reference not a point of argument.
Several papers have addressed the reaction time in driving. This is the time taken for the driver to notice and initiate an action in a driving environment. Authors in [5] compared the response time of novice vs experienced drivers and concluded that there was no significant difference. In the experiment, we pre-sented potential (staged) crash objects appearing at a distance of 30 - 120 Meters from the driver’s current position. This corresponded to 0.7 to 3 seconds with the preset driving speed. We wish to analyze reaction time as one of the car-handling indicator of the driver as different objects appear on driveway.
DOI: 10.4236/jtts.2019.94027 442 Journal of Transportation Technologies where the driver did not take corrective action when the situation required so.
We propose to perform driver analysis using one of the readily available bio-signal, surface electromyography (sEMG), to infer threatening situation and vehicular driving data to analyze performance in surprise events. In an impeding collision, the body involuntarily prepares for impacts through a series of neuro-physiological responses. Amongst these responses includes muscle toning to protect vital parts of the body. In particular, the neck experiences a considerable amount of muscle tension to keep the neck and spine intact before and after im-peding impact. These instances of muscle toning are used to infer events that are undesirable (threatening) to the driver. We found little research geared to this inquiry points. A paper [7], sought to understand the response of a driver to darkness enhanced startle in a tunnel driving. Other than this, the authors did not find any other paper exploring neck sEMG for driver behavior analysis.
2. Methods and Experiment Design
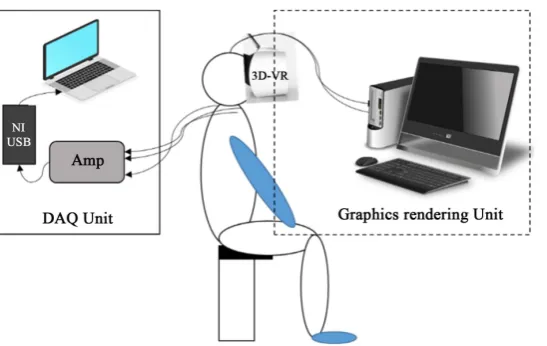
Driving simulation was designed using Unity3D engine. 3D Virtual Reality (3D-VR) Head Mounted Display (HMD) from FOVE® was used instead of fixed projec-tions or monitors. The simulation was run on a window 10 PC with Intel(R) Core i7 processor and GeForce GTX 1070 graphics card shown as graphics ren-dering unit in Figure 1.
2.1. Electromyography (EMG) Recording
[image:4.595.241.515.533.706.2]The experiment was setup to capture drivers neck EMG as shown in Figure 1. Two electrodes are connected to left and right Sternocleidomastoid (SCM) mus-cle in a bipolarconnection. We used Ag/AgCl electrodes with inter-distance place-ment of about 2 cm. The signal was pre-amplified using Polyam4B before pass-ing to DAQ unit as shown above. The signal was sampled at 2 KHz with Nation-al Instruments NI USB-6211 connected to a laptop PC running Matlab® data acquisition application. The signal was rectified and smoothed with moving av-erage filter.
DOI: 10.4236/jtts.2019.94027 443 Journal of Transportation Technologies
2.2. Driving Scene Setup
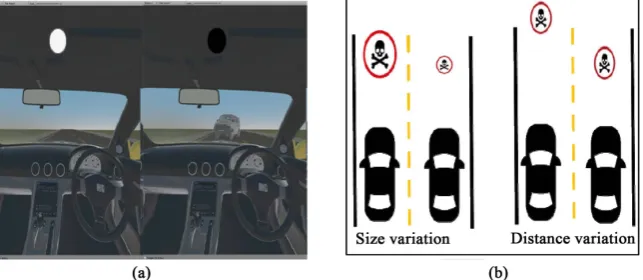
The scene is setup with the subject seated in the driver’s seat of a virtual car with a road and clear blue sky to avoid distractions of subject’s attention on scene de-tails. Figure 2 shows the scene design and conceptual organization of objects. The driver encounters 15 randomly appearing stimulus (triggered objects) to eli-cit response. The maximum attainable speed was set at 40 m/s. The driving mode lasts for about 20 minutes driving in a straight line.
Active driving mode used Thrustmaster® steering wheel and pedals (accelera-tion and braking) as reported in this paper [8]. The road characteristics are as follows; the total width is 10 M, and a walking path on both sides of width 1.5 M. The speed was to be maintained at a target speed (greater than 35 m/s). This im-plied that the driver would keep his/her leg in the acceleration pedal. The driver was instructed to keep left unless when necessary (avoiding collision). The devi-ation from middle of lane one is recorded as an index to show steering wheel ac-tivity before and after an obstacle stimulus is presented. From this index, devia-tion is classified as normal if the car is within the driving lanes, severe if the car reaches the pavements and dangerous is the car hits the walls. Since the car was located in the middle of the left lane, negative deviations indicate left turns and positive deviations (dominant) indicate position of the car in the right lane.
Prior to the experiment, the driver was given a test scene for them to familiar-ize with the car control and object avoidance as they appear. This lasted between 5 - 10 minutes or until the driver was confident of the controls.
2.3. Data Analysis
[image:5.595.216.538.551.691.2]Since the objective of the study is hazard response, only data around a trigger event was considered to avoid motion artifacts. The authors in [4] places driver’s physiological response between 1 - 3 seconds. Based on this timing information and the fact that the stimulus was set to pop-up between 0.7 - 3 seconds as de-scribed above, we considered 3 seconds prior to an event as baseline and 3 seconds later as the response window. The response window chosen captured active or passive driving reactionary behavior local to an event. The response
Figure 2. (a) Unity3D scene setup and (b) Conceptual construct with size and distance
DOI: 10.4236/jtts.2019.94027 444 Journal of Transportation Technologies prior to stimuli was chosen as 3 seconds to capture an equivalent amount of physiological data for comparison purposes. The recorded data was analyzed using custom-made Matlab® functions to high light relevant features and rela-tions as shown in the next section.
2.4. Artifacts in Neck EMG
SEMG of upper body parts are highly affected by heart pulses. Presence of elec-trocardiogram (ECG) artifacts increases the root mean square value of the EMG while lowering the median frequency of the signal. This is particularly an im-portant problem in neck sEMG because of its low amplitude nature. Artifacts in the EMG signal is due to the presence of the carotid artery near the SCM muscle (target muscle) which has one of the strongest ECG pulse in the human anato-my. From literature, the commonly employed method for elimination of ECG artifacts is the use of High pass filter with 30 Hz cutoff frequency [9]. The deme-rit with the method is the attenuation of signals below 30 Hz. In this paper, to avoid changing the spectral characteristics of the signal, we employed median filtering to the rectified and filtered signal to eliminate ECG peaks.
3. Results
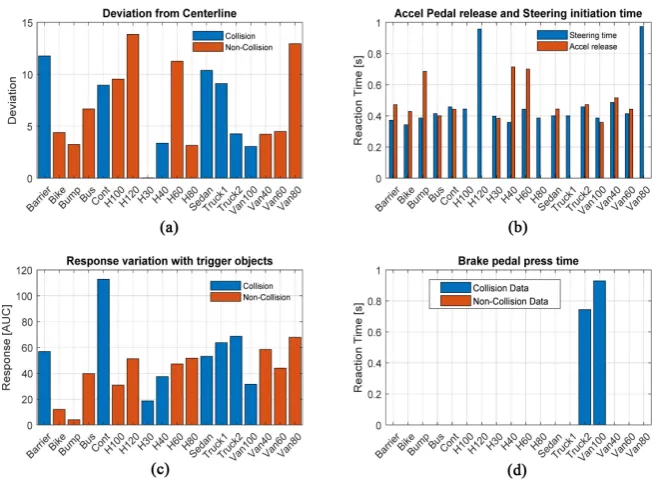
The following section shows a representative sample of sEMG signal and car-handling parameters. Each of the considered car-handling parameter, i.e. reaction time, wheel/paddle activity and deviation is further expounded below. EMG response and its relationship with various objects is described in ensuing sections as well. Figure 3(a) shows raw contaminated EMG and corresponding filtered EMG. From the figure, there is an increased EMG activity after a stimuli is presented. ECG peaks are evident when there is little or no activity on the neck. Figure 3(b) indicates that the driver is actively steering to keep within lane one and accelerating to maintain target speed.
From Figure 3(a), we noted that even during active maneuvers like braking and steering, neck sEMG did not report significant change as compared to a ha-zard (trigger) event. sEMG response was further processed using Area under Curve (AUC) and is further explained in the Section 3.5 below. From Figure 3(b), vehicle position curve changes drastically in the first trigger, a case where the car collided with an object as further confirmed by reduction of speed and acceleration pedal input. The next two triggers are a case of no collision after ac-tive steering. The car position deviates greatly (from centerline) at first and then the changes become gradual. Deviation is discussed further in Section 3.3 below.
3.1. Reaction Time
Figure 4 shows the relevant parameters extracted from car handling and EMG
DOI: 10.4236/jtts.2019.94027 445 Journal of Transportation Technologies (a)
[image:7.595.246.502.69.418.2](b)
Figure 3. EMG response and corresponding vehicular recorded parameters. (a) Raw and
filtered EMG signal; (b) Car performance indicators.
[image:7.595.210.539.465.707.2]DOI: 10.4236/jtts.2019.94027 446 Journal of Transportation Technologies
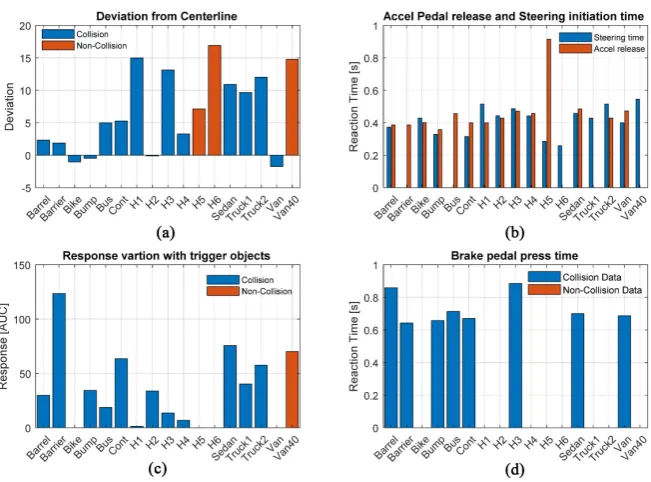
Figure 5. Non-licensed driver performance index. Performance index (a) Deviation from
mid-line; (b) Reaction time of steering and acceleration pedal; (c) EMG response and (d) braking reaction.
compared to experienced driver with no significant difference in reaction time. Significant difference is shown in the braking activity of the two, with expe-rienced driver having far less brake instances. This is attributed to the real-life driving experience gained in car environment.
3.2. Deviation Index
The plot in Figure 4(a) shows the rate of change of position on the x-axis (later-al velocity) and the corresponding AUC in bar graph. From this, lower deviation was noted whereby the driver did not engage any harsh steering maneuvers. Ei-ther the trigger object is far enough to allow for smooth transition or Ei-there was no corrective action taken (no sufficient time to make moves). As shown by H30 object, the driver did not initiate any corrective action, which led to collision; this is a case of very short reaction window for any action. On the other hand, H120 shows a case where the driver overreacts and take severe turns leading to over steer. In Figure 4(b), H120 event shows a slow reaction time and a high deviation with no acceleration pedal release.
3.3. Pedal/Wheel Activity
in-DOI: 10.4236/jtts.2019.94027 447 Journal of Transportation Technologies sufficient processing time. The two events are singled out because they resulted in collision implying that an action was needed but none was taken.
From the results in Figure 4(b), steering wheel activity and pedal release happened at the same time. These results may have been influenced by the fact that the driver was ready to take evasive turns at the sight of an object. The order of occurrence of steering time and acceleration pedal release changed from time to time but braking time was the slowest in the order of occurrence. From the results, the driver chose steering in at least all cases as shown in the braking re-sponse in Figure 4(d).
3.4. Variation of EMG Response
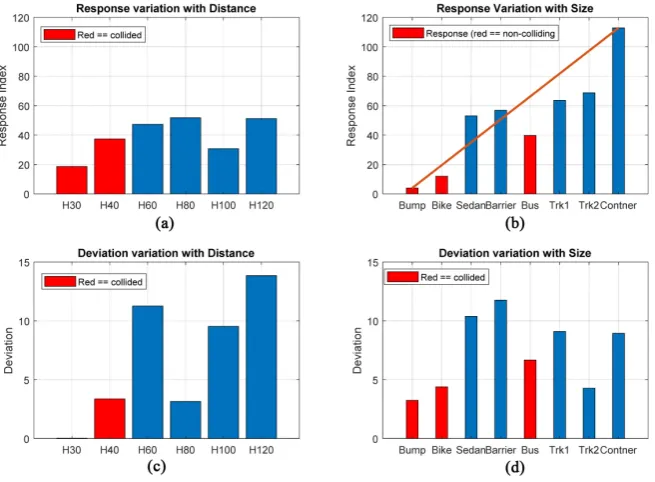
The AUC for the processed sEMG is shown below with respect to specific events. The response AUC herein referred to as response is compared with type of ob-ject, and distance of presentation as well as collision or non-collision event. We sought to understand the relationship that exists between response index with distance and size of the object. The threat level was significantly high for big ob-jects and short distance. Figure 6 shows deviation and response variations. Fig-ure 6(a) shows a slight relation of response with the appearance distance. FigFig-ure 6(b) shows a clearer relationship as expected.
4. Discussion
[image:9.595.211.539.466.707.2]This study was conducted to highlight the current needs of assistive driving technology and risk assessment in hazardous events. Hazard response index in a real-time driving would be highly informative as has been made clear by several researchers. In a driving environment, any instance or event that the driver
DOI: 10.4236/jtts.2019.94027 448 Journal of Transportation Technologies considers as hazardous shows up in various physiological processes. This is why we strongly feel that physiological analysis is the best-suited frontier to address the problem of driver behavior.
From the results, sEMG response increases with increase in perceived threat level. Deviation on the other hand did not show linear relationship with object size or distance. We will conduct further research to verify the relationship of the two indicators. In all the stimuli presented, the driver recognized and pre-pared either for collision impact or avoidance maneuvers. This parameter is as shown in reaction time of less than 1 second.
Car-handling results suggest that braking information by itself would not fully characterize driver behavior. This is from the fact that drivers showed inconsis-tent tendencies of use/non-use of brakes. As such, braking information should be considered with other complementary data. In this paper, we have focused on an experienced driver (more than 20 active years’ experience) to point out the availability of hazard response. A paper [4] presented the “volleyball-paradigm” with the conclusion that all drivers irrespective of driving experience will be surprised by sudden objects in the driveway. Our findings showed that in a sur-prised state, driving errors increases.
Reactionary response study using several other physiological signals like Elec-tro-dermal activity, ECG, etc. is possible with different computational complex-ity. The advantage of the current approach is its ease of applicability in a real driving environment. EMG devices have reached commercial level of production with products like MyoWare [10] and EMG Biofeedback sensors for neck and shoulders amongst others. Therefore, we believe that use of the proposed model for driver analysis would not be cumbersome.
The challenge we encountered when dealing with response is habituation; a situation where a repeated stimuli elicit less and less reaction. For the study of hazard response, the choice of stimuli and the frequency of appearance should be taken in to consideration. Novel information is desirable and as such, a good design of experiment and variation of stimuli is important. Another challenge was the use of 3VR-HMD. Although with its advantages in realistic scene pres-entations, users had visual discomfort in prolonged usage time.
5. Conclusions
In conclusion, this paper evaluated the response behavior of drivers using car handling performance indicator and physiological responses. For every hazard-ous event/stimuli, the driver’s reaction time was less than 1 second. Pedal mi-sapplication as well as non-braking instances was noted. The order of pedal re-lease and steering time changed with different objects with braking response time being the slowest when present. This confirms our position that braking behavior is insufficient indicator by itself for accurate behavior analysis.
DOI: 10.4236/jtts.2019.94027 449 Journal of Transportation Technologies perceived risk. From the results, the response increased with object size. This suggests that EMG response can be applied in a real driving environment cha-racterize error or hazards. The limitations present with the current research are on the number of subjects evaluated. We intend to conduct further investiga-tions to explore the relainvestiga-tionship that exists between different classes of drivers as well as exploring other physiological signals for an all-inclusive understanding of driver response. Future research in this line will lead to an accurate on-road risk level classification, which has far-reaching benefits in accident prevention sys-tems.
Conflicts of Interest
The authors declare no conflicts of interest regarding the publication of this paper.
References
[1] Miyaji, M., Danno, M. and Oguri, K. (2008) Analysis of Driver Behavior Based on Experiences of Road Traffic Incidents Investigated by Means of Questionnaires for the Reduction of Road Traffic Accidents. International Journal of ITS Research, 6, 47-56. https://doi.org/10.1109/IVS.2008.4621130
[2] National Police Agency Japan (2017) Road Traffic Accidents and Fatalities in 2017.
https://www.npa.go.jp/hakusyo/h29/english/full_text_WHITE_PAPER_2017_E.pdf
[3] Xiong, X.X., et al. (2019) A Forward Collision Avoidance Algorithm Based on Driver Braking Behavior. Accident Analysis & Prevention, 129, 30-43.
https://doi.org/10.1016/j.aap.2019.05.004
[4] Risa, T., Masayoshi, K., Tsutomu, S., Yoshiharu, Y., Hideya, M. and Toshio, O. (2017) Driving Simulation Test for Evaluating Hazard Perception: Elderly Driver Response Characteristics. Transportation Research Part F: Traffic Psychology and Behaviour, 49, 257-270.https://doi.org/10.1016/j.trf.2017.07.003
[5] Fridulv, S. and Torkel, B. (2006) Hazard Perception and Driving Experience among Novice Drivers. Accident Analysis & Prevention, 38, 407-414.
https://doi.org/10.1016/j.aap.2005.10.014
[6] Andreas, M., Matthias, J.W. and Paul, P. (2008) Darkness-Enhanced Startle Res-ponses in Ecologically Valid Environments: A Virtual Tunnel Driving Experiment.
Biological Psychology, 77, 47-52.https://doi.org/10.1016/j.biopsycho.2007.09.004
[7] Taheri, S.M., Matsushita, K. and Sasaki, M. (2017) Development of a Driving Simu-lator with Analyzing Driver’s Characteristics Based on a Virtual Reality Head Mounted Display. Journal of Transportation Technologies, 7, 351-366.
https://doi.org/10.4236/jtts.2017.73023
[8] Janessa, D.M. and Jack, P.C. (2006) Elimination of Electrocardiogram Contamina-tion from Electromyogram Signals: An EvaluaContamina-tion of Currently Used Removal Techniques. Journal of Electromyography and Kinesiology, 16, 175-187.
https://doi.org/10.1016/j.jelekin.2005.07.003
[9] Wu, Y., et al. (2017) Foot Placement during Error and Pedal Applications in Natu-ralistic Driving. Accident Analysis & Prevention, 99, 102-109.
https://doi.org/10.1016/j.aap.2016.10.019
[10] Advancer Technologies (2016) MyoWare Muscle Sensor Manual.