Managing Road Maintenance Using Geographic
Information System Application
Mohd Zulkifli B. Mohd Yunus, Hamidah Bt. Hassan
School of Professional and Continuing Education (SPACE), Universiti Teknologi Malaysia, Skudai Johor, Malaysia E-mail: [email protected]
Received July 31, 2010; revised September 2, 2010; accepted September 8, 2010
Abstract
The development and economic growth of a nation is closely related to its available transportation system. Good and efficient road transport infrastructure facilities will promote industrial and socio-economic devel-opment. To provide safety and comfort to road users, a comprehensive road maintenance schedule must be formulated and adopted to ensure those roads are in good condition at all times. Preventive maintenance works, such as road rehabilitation will help to reduce the major road repairs and expenditure. Prior to this, a good database, gathered through GIS will be necessary in order to ensure maintenance is done effectively. Geographic Information System (GIS) is said to be one of the useful tools that can be utilized to manage da-tabase in road maintenance engineering. This system is capable of storing, managing, analyzing, computing and displaying all forms of geographical data for road maintenance works. In this study, the author has adopted GIS application software – ArcView, and has reviewed and analyzed its effectiveness in managing road database. These data are then used to assist the management to ensure effective and systematic road maintenance. A typical model of roads in Penang, Malaysia is used as a case study to further clarify the ap-plication of GIS in road maintenance.
Keywords:Road Management, Geographic Information System, Database, ArcView
1. Introduction
Geographic Information System (GIS) is a system for mapping and analyzing any object on earth. It is a way of gathering, storing, and managing any type of data with spatial components. GIS data are usually stored in more than one layer. This is the fundamental aspect of GIS, and working with layers of geographical information is gen-erally known as data integration. GIS technology inte-grates powerful database capabilities with unique visual perspective of a good old fashioned-map. This makes GIS unique among various information collection sys-tems.
Basically, this system utilizes hardware, software, user, and effective management to collect, store, analyze and present the related information of a given area on the earth. Even more, it has the capability to overlap map and provide an information inquiry facility that can indi-rectly create a whole new set of information. Here, data output can be obtained in the form of tables, maps, graph or combination of this three. The other powerful aspect of GIS is its flexibility in modeling spatial objects to suit
the particular needs of the user or application. GIS pro-vides a set of tools or computer programs that allow user to perform specific operation on the map, assisted by set of attribute data.
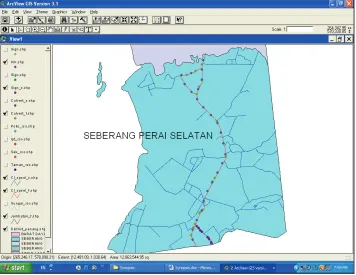
This study is conducted in Seberang Perai Selatan, Pe- nang with the objective to explore the potential of GIS in capturing, storing, updating, retrieving, displaying and pr- inting data to facilitate road database management. Road maintenance is monitored effectively within the district by using the application of ArcView software. This case study area is shown in Figure 1 [1].
1.1. GIS Capabilities
GIS consists of four subsystems, namely data acquisition, data management, analysis of data and information out- put [2]. Some of the GIS advantages are listed as fol- lows:
1) Consists of a central database storing all data re- lated, available and useable to users when required;
Figure 1. Study area.
3) Improves data currency, accuracy and consistency of data maintained;
4) Minimizes data duplication;
5) Performs analyses on spatial and non-spatial com- ponents;
6) Has a more effective presentation of data; 7) Data are managed more efficiently; and
8) Increases work productivity particularly in planning and managing infrastructures, to produce results from numerous combinations of data sets [3].
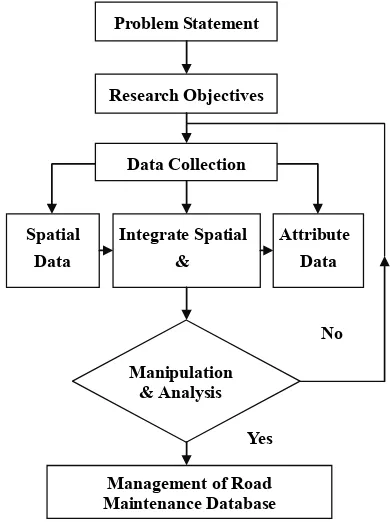
2. Methodology
This section will mainly focus on the methodology that involves handling and managing data. Within the process of data collection, two sets of data are classified; namely spatial and attribute data. Spatial data are achieved from the output of Global Positioning System (GPS) equip- ment. Processes involved in this research are illustrated in Figure 2.
2.1. Spatial Data Input
All data must be in digital format before they can be in- serted into ArcView software. These data namely spatial data, mainly focus on the federal routes, state roads and other road assets, such as bridges, culverts, kilometer posts and signage. To meet the scope of the study, data obtained from the Department of Public Work Head- quarters in Kuala Lumpur and Penang GIS (PEGIS) in Pulau Pinang were edited to enable spatial data to be arranged efficiently.
2.2. Attribute Data Input
In this study, softwares used to construct the attributes are
the Microsoft Excel and ArcView. Attribute are mainly for database feature displayed [4]. Essentially, attribute tables are constructed in each segment and they consist of construction of road centre lines, kilometer posts, sig- nage, bridges and culverts. All field data collection is attach in Table 1.
3. Application and Result
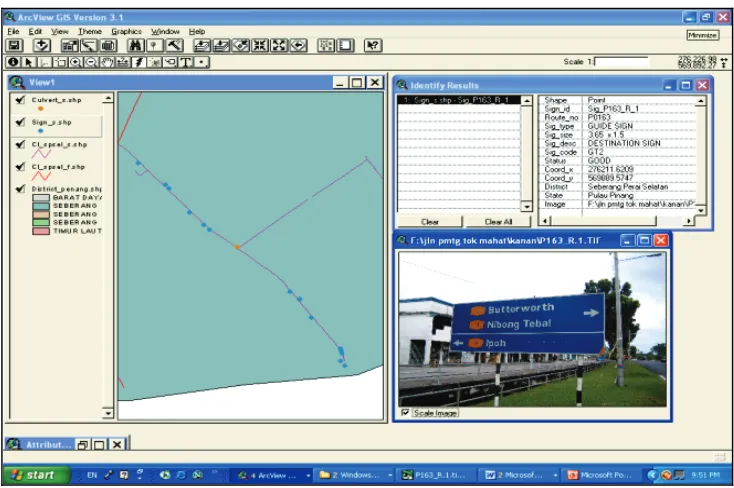
ArcView software provides an interactive map display which contains many themes or groups of similar fea- tures [5]. Thus, by activating those related theme, informa- tion on the study area can be simply obtained. All theme legends are displayed in the form of table content, as in
Figure 3. Even so, every feature in these themes has one
Problem Statement Research Objectives Data Collection Spatial Data Attribute Data Integrate Spatial & Manipulation & Analysis
Management of Road Maintenance Database
Yes
No
[image:2.595.324.519.276.537.2]Figure 2. Road maintenance flowchart.
Table 1. Attribute table.
Database Road Km Posts Signage Culverts Bridges/
[image:2.595.308.537.583.719.2]unique record that describes the feature’s characteristics in the form of theme table format [6]. Then, creating hotlink on theme features will allow users to click on the
related theme to display additional data as attached in
[image:3.595.121.477.134.409.2]Figures 4-6. This data can be an image, a text file or a document.
[image:3.595.122.477.441.704.2]Figure 3. Activation of menu screen theme.
Figure 5. Geometric and identification Fields-Bridge.
Figure 6. Geometric and identification Fields-Signage.
4. Conclusions
The adoption of GIS will lead to a more organized mana- gement of digital data especially those related to road data. Particularly, this system application will also incre- ase work productivity in managing road maintenance. Generally, this study has achieved its objectives as defin-
ed. Thus, the conclusions that can be drawn from this study on GIS system are as follows;
1) It has a capability for a fast data recall with relative ease of use,
2) It minimizes wasteful duplication of effort in the collection of geospatial information,
[image:4.595.114.481.363.607.2]consis-tency of data maintained [7],
4) It promotes data sharing culture and enhances team spirit,
5) Map data obtained is more secure and better organ-ized [8].
5. Recommendations
It is recommended that this study be pursued particularly in the development and analysis of road assets manage- ment system. To improve the management of the road maintenance, additional data such as black spot areas, road side development and other features related to road maintenance should be collected to assist in planning, cost reduction and better decision making.
6. Acknowledgements
The authors wish to thank the Dean of School of Professi- onal and Continuing Education(UTMSPACE), and Dean of the Faculty of Civil Engineering for their support of this study.
7. References
[1] J. K. R. Malaysia, “Arahan Teknik (Jalan) 2A/85,”
Manual On Traffic Control Devices, Public Work Depart- ment (JKR), Malaysia, 2009
[2] J. D. P. Edrus, “Aplikasi Sistem Maklumat Geografi Dalam Pengurusan Lubang Jara,” GIS Application on Borehole Mangement, Unpublished B.Sc. Thesis, Uni- versity Technology Malaysia, Skudai, 2005.
[3] D. B. Francis, “Aplikasi Sistem Maklumat Geografi Dalam Penentuan Kawasan Perlindungan Air Di Tambunan Sabah,” GIS Application in Determining Wa- ter Protection Area at Tambunan, Sabah, Unpublished B.Sc. Thesis, University Technology Malaysia, Skudai, 2005.
[4] M. B. A. Manap, “Determination of Waste Disposal Area in Klang by Using GIS,” Unpublished B.Sc. Thesis, University Technology Mara, Mara, 2005.
[5] McGraw–Hill, “GIS Implementation for Water and Waste- water Treatment Facilities,” WEF Manual of Practice No.
26, 2004.
[6] Meor Othman Hamzah, Asri Hassan and Mohamed Re- han Karim, “Reka Bentuk Jalan Raya Untuk Jurutera,”
Road Design for Engineers, Dewan Bahasa Dan Pustaka, 2001.
[7] Norkhair Ibrahim and Zulkifli Majid, “Prinsip Sistem Maklumat Geografi,” Principal of Geographic Infor- mation System, Universiti Teknologi Malaysia, 2002. [8] Ruslan Rainis and Noresah Mohd Shariff, “Sistem