ISSN Online: 2329-3292 ISSN Print: 2329-3284
DOI: 10.4236/ojbm.2019.74108 Aug. 7, 2019 1564 Open Journal of Business and Management
Causes and Effects of Failure to File Annual
Returns in Developing Countries Based on the
Theory of Planned Behavior and Economic
Deterrence Theory
Kelvin Seta
1, Jackson Phiri
21Graduate School of Business, University of Zambia, Lusaka, Zambia
2Department of Computer Sciences, School of Natural Sciences, University of Zambia, Lusaka, Zambia
Abstract
Companies are required by the Companies Act No. 10 of 2018 to file annual returns with the Registrar of companies within ninety (90) days following the year end. However, most companies do not comply with this requirement. Therefore, this study is aimed at determining the causes and effects of failure by companies limited by guarantee to file annual returns with Patents and Companies Registration Agency (PACRA). The research study used a case study in a descriptive form to get in-depth and detailed information on the causes and effects of failure to file annual returns with PACRA by companies limited by Guarantee. The study had a total sample size of 151 respondents with 121 from companies limited by guarantee selected within Lusaka district and 30 PACRA employees from the head office in Lusaka. The study was both qualitative and quantitative using primary and secondary data. The pri-mary data were collected using structured questionnaires using a simple ran-dom sampling technique. The analysis was done both qualitatively and quan-titatively using the statistical package SPSS. The study findings revealed that, failure to file annual returns by companies limited by guarantee was caused by a number of reasons such as: weak or non-existent penalties, complicated filing process, lack of understanding of the companies’ post incorporation ob-ligations and limited sensitization on the filing requirements for companies. Based on these results, the study made the following recommendations: PACRA should streamline the filing of annual return process to make it easi-er for the clients to file. Additionally, the penalties for non-compliance should be more punitive in order to deter any form of non-compliance. There is also a need for PACRA to restructure their sensitization programs to ensure that all their target groups are covered.
How to cite this paper: Seta, K. and Phiri, J. (2019) Causes and Effects of Failure to File Annual Returns in Developing Coun-tries Based on the Theory of Planned Beha-vior and Economic Deterrence Theory. Open Journal of Business and Manage-ment, 7, 1564-1576.
https://doi.org/10.4236/ojbm.2019.74108
Received: July 5, 2019 Accepted: August 4, 2019 Published: August 7, 2019
Copyright © 2019 by author(s) and Scientific Research Publishing Inc. This work is licensed under the Creative Commons Attribution International License (CC BY 4.0).
DOI: 10.4236/ojbm.2019.74108 1565 Open Journal of Business and Management
Keywords
Annual Return, Limited by Guarantee, Post Incorporation and Filing
1. Introduction
Patents and Companies Registration Agency (PACRA) was established to re-spond to the needs of the business community with the view of creating an effi-cient agency and merging the mandate of the Registrar previously provided for under multiple legislations [1]. The PACRA Act empowers the Registrar with the authority to oversee the administration of the Companies Act, Registration of Business Names Act, Trade Mark Act, Registered Designs Act and Patents Act.
Before the enactment of the Patents and Companies Registration Act, PACRA was known as the Patents and Companies Registration Office (PACRO) which was a semi-autonomous and self-financing executive agency under the Ministry of Commerce, Trade and Industry (MCTI). PACRO was a department under MCTI until it was hived off from the civil service and was later commercialized under the public service reform programme established by the Treasury Author-ity No. 4 of 1997 [2]. PACRO was granted administrative autonomy and man-dated to continue administering and attending to matters incidental to the Companies Act, Patents Act, Registrations of Business Names Act, Trademarks Act and Registered Designs Act.
Section 270(1) of the companies Act No 10 of 2017, requires companies to lodge an annual return in the prescribed form within ninety days after the end of the financial year. An annual return that is not filed within the period specified in subsection (1), shall attract a penalty as prescribed. There have been a lot of sensitization programs undertaken by PACRA to educate the general public on the need to comply with the Companies Act. However, this has not helped in improving compliance as still a large number of companies do not comply with the post registration obligations. This has resulted in most companies on the da-tabase having information that is not up-to-date and loss of revenue for the Gov-ernment. Hence, this study is being undertaken in order to determine the causes and effects of non-filing of annual returns among companies limited by guarantee in Lusaka. The research also sought to establish strategies that should be imple-mented by PACRA in order to improve the filing of annual returns by companies.
2. Literature Review
DOI: 10.4236/ojbm.2019.74108 1566 Open Journal of Business and Management study on Impact of Tax Knowledge, Tax Compliance Cost, Tax Deterrent, and Tax Measures towards Tax Compliance Behavior in Malaysia, the study revealed that there is a positive relationship between tax knowledge and tax compliance. Tax knowledge included such things as a tax payers understanding tax law and regulations. This equips the tax payer with knowledge in relation to issues of re-bate, relief, tax returns and deduction from different taxpayer category of joint assessment, business and self-employed. [6] conducted a study on the analysis of factors affecting tax compliance in the real estate sector. The study revealed that tax knowledge and education has significant positive effect on tax compliance in real estate sector. An increase in tax knowledge by the tax payer can lead to an increase in tax compliance. They also suggested that improved awareness of taxpayers with regards to their tax obligations can be better improved through enhanced tax education services rather than just provide them simple guidelines on filing tax returns. [7] in their study on determinants of tax compliance con-cluded that tax knowledge of taxpayer can be equipped and enhanced through education. [8] conducted a study on the role of taxation education on taxation knowledge and its effect on tax fairness as well as tax compliance on Handicraft SMEs Sectors in Indonesia. The study revealed the existence of a positive and significant relationship between tax education on tax knowledge and tax com-pliance. [9] conducted a study on the determinants of tax compliance behavior. The study revealed that there is a very insignificant relationship between tax compliance cost and compliance behavior for the corporate tax payers. Addi-tionally, the study revealed the existence of a significant negative relationship between tax deterrence sanctions and tax non-compliance behavior. Further-more, [8] in their study on the analysis of factors affecting tax compliance in the real estate sector revealed that tax compliance cost is significantly negatively re-lated to tax compliance behavior. A study on tax compliance, corruption and deterrence by [10] revealed that intentions of taxpayer to comply with tax were higher and intentions to evade tax were lower when the tax authorities and ad-ministration were perceived as fair and trustworthy as well as deterrence power was high. Another factor suggests that an individual will comply as long as he or she believes that compliance is the social norm. Conversely, if noncompliance becomes pervasive, then the social norm of compliance disappears. This pers-pective also suggests that, if government can affect the social norm of com-pliance, then such government policies represent another, potentially significant tool in government’s battle with tax evaders. A study by [11] on a model for im-proving E-Tax systems adoption in rural Zambia based on the Technology As-sessment Model (TAM) revealed the need for more awareness and tax education to the tax payers in order for E-Tax system use to improve. This applies to filing of company returns as well.
2.1. Source of the Model of This Research
DOI: 10.4236/ojbm.2019.74108 1567 Open Journal of Business and Management to develop a model that will address the research problem. The following theories were reviewed; economic deterrence theory and the theory of planned behavior.
2.1.1. Economic Deterrence Theory
Economic Deterrence theory is a theory under criminology and was developed by Becker [12]. This theory is based on the concept that, if the consequence of committing a crime outweighs the benefit of the crime itself, the individual will be deterred from committing the crime. This is founded in the idea that all indi-viduals are aware of the difference between rights and wrong and the conse-quences associated with wrong or criminal behaviors. Proponents of deterrence theory believe that people choose to obey or violate the law after calculating the gains and consequences of their actions. In relation to the problem of failure to file annual returns with the companies’ registry by companies in Zambia, it can be assumed that the consequence of not filing annual returns does not outweigh the benefit of fulfilling the obligation. The deterrence model of regulatory com-pliance states that the certainty and severity of sanctions are the key determi-nants of compliance. Under the repealed Companies Cap 388 the Registrar of companies had no powers to administratively impose sanction. All matters were to be referred to the High Court with the approval of the Director of Public Prosecutions (DPP). The Companies Act No 10 of 2017 provides for General Penalties under section 373 administered by the High Court. This could be a fine not exceeding 3, 333 penalty unit (a penalty unit is equivalent to K0.03 or USD $0.0023) or imprisonment for a term not exceeding 4 years. Further Section 370 also provides for the administrative penalty to be administered by Registrar for any failure to comply with the Act. However, these penalties are too low to enable companies to fully comply with the law. The fee for late filing of annual return is K100 (USD $7.5) per annum. This amount is too low to force a non-complying company to start filing its company returns.
2.1.2. Theory of Planned Behaviour
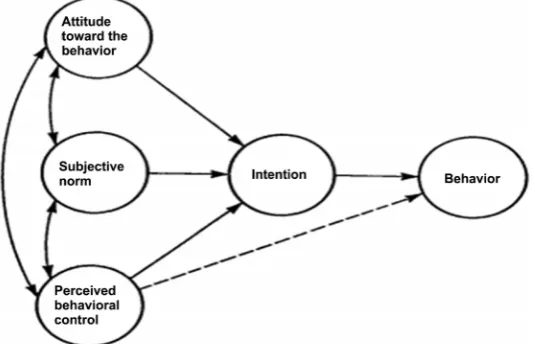
DOI: 10.4236/ojbm.2019.74108 1568 Open Journal of Business and Management society is under the influence of definite factors which originate from certain reasons and emerge in a planned way. The ability to perform a particular beha-vior depends on the fact that the individual has a purpose towards that behabeha-vior (behavioral intention). Behavioral intention in turn depends on three factors that is Attitude towards the behavior, subjective norms and perceived behavioral control [13] (Figure 1).
Figure 1. Theory of planned behavior. Source: Ajzen, 1991, p. 182. (2019).
In relation to annual returns compliance, it is clear that there are multiple factors that lead companies to behave in the manner that they do with regards to filing of annual returns despites being knowledgeable of some of the penalties that are accompanied by lack of fulfilling that obligation. This theory gives an insight on how personal factors could influence the filing of company returns by companies.
2.1.3. Proposed Hypotheses
H1: Companies without an understanding of annual returns are more likely to be non-compliant.
H2: Companies that lack awareness of effects non-compliance and penalties are more likely to be non-compliant.
H3: Companies that have been sensitized about annual returns are more likely to be compliant.
3. Methodology
DOI: 10.4236/ojbm.2019.74108 1569 Open Journal of Business and Management with PACRA by companies limited by Guarantee The researcher considered the responses of the participants of the study so as to try and understand why a lot of companies fail to file annual returns.
Primary data was collected with the aid of questionnaires with structured questions. Questions that were used in the research included closed and open-ended questions. Secondary data is information or data already collected by other researchers or institutions, usually for different purposes [14]. The sec-ondary sources of data emanated from both published and unpublished articles, magazines, journals and publications from prominent international bodies and organizations on the subject of compliance with filing company returns.
Population of a study refers to a complete set of individuals or subjects, ob-jects or events having common observable characteristics in which the research-er is intresearch-erested [15]. The target population for the study was comprised of both public and private sector. Target population is the aggregate of entire set of study units that have a potential for providing the relevant data for the research study to make inferences [16]. The Patents and Companies Registration Agency (PACRA) statistics indicated that there are approximately 475 companies Li-mited by Guarantee in Lusaka District. The study had a sample size of 150 res-pondents comprising of 120 representatives from the companies and 30 em-ployees from PACRA. Only 121 respondents participated in the study by res-ponding to the questionnaires.
[image:6.595.263.486.546.705.2]The Statistical Product and Service Solutions-SPSS version 20.0, an IBM product since 2009 [17] was used to analyze the data. The specific statistical me-thod that was used was descriptive statistics from SPSS version 20. Therefore, the response rate was 80.7%.
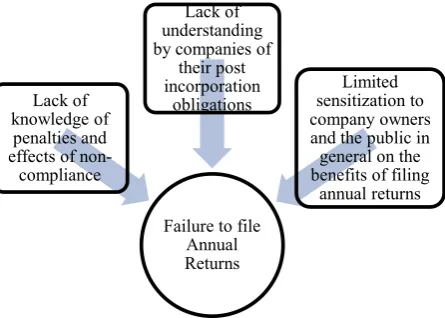
Figure 2 explains some of the factors that PACRA should take into account
when addressing the problem of failure to file annual returns. The aim of this framework is to establish the relationship between the independent variables and the dependent variable. It is important to test if the independent variables have an effect on the dependent variable and determine the impact on the dependent variable.
Figure 2. Possible causes of failure to file company returns. Source, Author (2019).
Failure to file Annual Returns Lack of
knowledge of penalties and effects of non-compliance
Lack of understanding by companies of
their post incorporation
obligations sensitization to Limited company owners and the public in general on the benefits of filing
DOI: 10.4236/ojbm.2019.74108 1570 Open Journal of Business and Management
4. Findings and Discussions
Gender Distribution
Results show that 48% (58 out of 121) of the respondents were Female while 52% (63 out of 121) were Male. Additionally, 40% (48 out of 121) of the respon-dents were Married, 9% (11 out of 121) of the responrespon-dents were Divorced, 4% (5 out of 121) of the respondents were Widowed and 47% (57 out of 121) were Single.
Understanding of Annual Returns
Moreover, results also show that 90% (109 out of 121) of the respondents agreed to having an understanding of what annual returns were while only 10% (12 out of 121) did not have an understanding of what annual returns were.
Knowledge of Existence of Penalties
[image:7.595.208.539.388.478.2]Other results also show that 85% (103 out of 121) of the respondents ac-knowledges the existence of penalties as a result of failure to file annual returns while only 15% (18 out of 121) disputed by saying there are no penalties en-forced by PACRA for failure to file returns.
Table 1 shows the various responses the respondents gave as the causes of
failure to file annual returns by companies limited by guarantee. From the table above, complicated filing procedure is the most agreed on cause amongst the respondents with the biggest share of the proportion of 93 (~77%).
Table 1. Causes of failure to file annual returns.
YES (%) NO (%) Total
Limited sensitization on annual returns 75 (62) 46 (38) 121 Lack of filing requirement knowledge 70 (57.9) 51 (42.1) 121 Lack of knowledge of the penalties 39 (32.2) 82 (67.8) 121
Weak penalties 80 (66.1) 41 (33.9) 121
[image:7.595.270.475.546.706.2]Complicated filing procedure 93 (76.9) 28 (23.1) 121
Figure 3 above shows that 48% (58 out of 121) of the respondents indicated
that they have been sensitized while 52% (63 out of 121) have not been sensitized on annual returns filing.
DOI: 10.4236/ojbm.2019.74108 1571 Open Journal of Business and Management
4.1. Statistical Significance (P-Values)
The P-value was used to test the hypotheses by cross tabulation of certain ques-tions: -
P-value = P > 0.05 (by statistical convention, 0.05 probability level was used as a critical value);
Degrees of freedom (df) = N − 1 (where N is the total number of Partici-pants/Respondents);
Pearson Chi-Square values = were shown as asymptotic value in the table after the cross tabulation of the questions had been done.
If the calculated chi-square value was less than the 0.05, the hypothesis would be accepted.
If the value is greater than the value of 0.05, the hypothesis would be rejected.
4.2. Hypotheses Testing
[image:8.595.210.539.480.679.2]Hypothesis 1: Companies without an understanding of annual returns are more likely to be non-compliant.
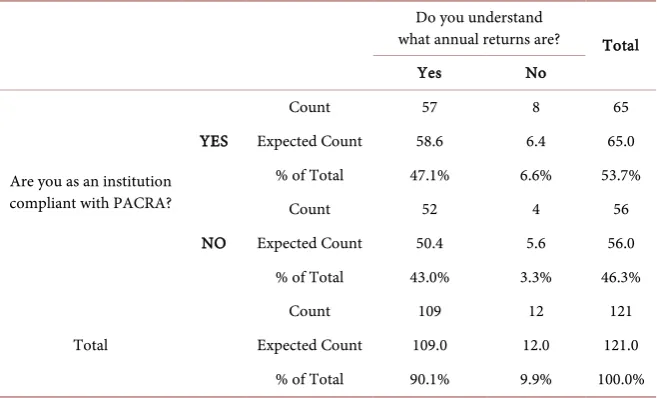
Table 2 seeks to test the hypothesis that Companies without an understanding
of annual returns are more likely to be non-compliant. Out of a total of 121 res-pondents 109 indicated that they had an understanding of what annual returns were and out of which 52 were not compliant with the requirement to file annual returns with PACRA and 57 indicated that they were compliant. Furthermore, the table indicates that out of the 12 respondents that did not have an under-standing of what annual return were, 8 of them were compliant and only 4 were not compliant with requirement to file annual returns Companies Registry.
Table 2. Are you as an institution compliant with PACRA? *Do you understand what
annual returns are?
Do you understand
what annual returns are? Total
Yes No
Are you as an institution compliant with PACRA?
YES
Count 57 8 65
Expected Count 58.6 6.4 65.0
% of Total 47.1% 6.6% 53.7%
NO
Count 52 4 56
Expected Count 50.4 5.6 56.0
% of Total 43.0% 3.3% 46.3%
Total
Count 109 12 121
Expected Count 109.0 12.0 121.0
% of Total 90.1% 9.9% 100.0%
Table 3 shows that there is no statistically significant relationship between
DOI: 10.4236/ojbm.2019.74108 1572 Open Journal of Business and Management hypothesis “Companies without an understanding of annual returns are more likely to be non-compliant” is rejected. The decision to reject the hypothesis is supported by the asymptotic significance value of 0.343 in Table 3 which is greater than the probability value (P-Value) of 0.05 indicating that research hy-pothesis should be rejected.
Table 3. Chi-square tests.
Value df Asymp. Sig. (2-sided) Exact Sig. (2 sided) Exact Sig. (1 sided)
Pearson Chi-Square 0.898a 1 0.343
0.262 Continuity Correctionb 0.413 1 0.520
Likelihood Ratio 0.919 1 0.338
Fisher’s Exact Test 0.380
Linear-by-Linear Association 0.891 1 0.345 N of Valid Casesb 121
a0 cells (0.0%) have expected count less than 5. The minimum expected count is 5.55. bComputed only for a 2 × 2 table.
[image:9.595.210.538.535.727.2]Hypothesis 2: Companies that lack awareness of the effects of non-compliance and penalties are more likely to be non-compliant.
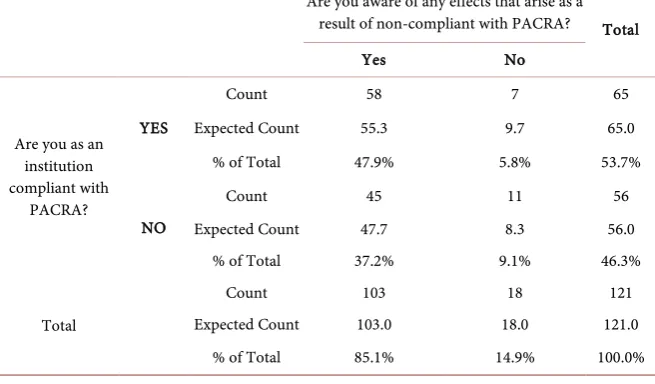
Table 4 seeks to test the hypothesis that companies that lack awareness of
non-compliance effects and penalties are more likely to be non-compliant. Out of a total of 121 respondents 103 indicated that they were aware of effects and penalties for non-compliance and out of which 45 were not compliant with PACRA and 58 indicated that they were compliant. Furthermore, the table indi-cates that out of the 18 respondents that were not aware of effects and penalties, 11 of them were compliant and only 7 were not compliant with PACRA.
Table 4. Are you as an institution compliant with PACRA? *Are you aware of any
ef-fects/penalties that arise as a result of being non-compliant with filing annual returns?
Are you aware of any effects that arise as a result of non-compliant with PACRA? Total
Yes No
Are you as an institution compliant with
PACRA?
YES
Count 58 7 65
Expected Count 55.3 9.7 65.0
% of Total 47.9% 5.8% 53.7%
NO
Count 45 11 56
Expected Count 47.7 8.3 56.0
% of Total 37.2% 9.1% 46.3%
Total
Count 103 18 121
Expected Count 103.0 18.0 121.0
DOI: 10.4236/ojbm.2019.74108 1573 Open Journal of Business and Management
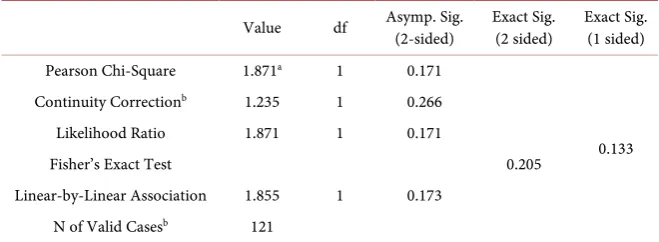
Table 5 shows that there is no statistically significant relationship between
awareness of penalties and effects of non-compliance and filing of annual re-turns. Therefore, research hypothesis “Companies that lack awareness of non-compliance effects and penalties are more likely to be non-compliant” is re-jected. The decision to reject the hypothesis is supported by the asymptotic sig-nificance value of 0.171 in Table 5 which is greater than the probability value (P-Value) of 0.05 indicating that research hypothesis should be rejected.
Table 5. Chi-square tests.
Value df Asymp. Sig. (2-sided) Exact Sig. (2 sided) Exact Sig. (1 sided)
Pearson Chi-Square 1.871a 1 0.171
0.133 Continuity Correctionb 1.235 1 0.266
Likelihood Ratio 1.871 1 0.171
Fisher’s Exact Test 0.205
Linear-by-Linear Association 1.855 1 0.173 N of Valid Casesb 121
a0 cells (0.0%) have expected count less than 5. The minimum expected count is 8.33. bComputed only for a 2 × 2 table.
[image:10.595.212.539.527.724.2]Hypothesis 3: Companies that have been sensitized about annual returns are more likely to be compliant.
Table 6 seeks to test the hypothesis that Companies that have been sensitized
about annual returns are more likely to be compliant. Out of a total of 121 res-pondents 58 indicated that they have been sensitized and out of which 26 were not compliant with PACRA and 32 indicated that they were compliant. Fur-thermore, the table indicates that out of the 63 respondents that have never been sensitized, 33 of them were compliant and 30 were not compliant.
Table 6. Are you as an institution compliant with PACRA? *Have you ever been
sensi-tized by PACRA?
Have you ever been
sensitized by PACRA? Total
YES NO
Are you as an institution compliant with PACRA?
YES
Count 32 33 65
Expected Count 31.2 33.8 65.0
% of Total 26.4% 27.3% 53.7%
NO
Count 26 30 56
Expected Count 26.8 29.2 56.0
% of Total 21.5% 24.8% 46.3%
Total
Count 58 63 121
Expected Count 58.0 63.0 121.0
DOI: 10.4236/ojbm.2019.74108 1574 Open Journal of Business and Management
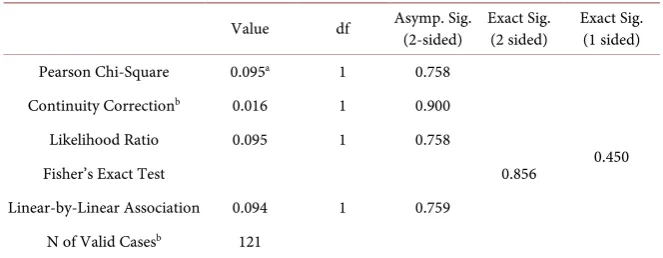
Table 7 shows that there is no statistically significant relationship between
being sensitized about annual returns and being compliant. Therefore, research hypothesis that “Companies that have been sensitized about annual returns are more likely to be compliant” is rejected. The decision to reject the hypothesis is supported by the asymptotic significance value of 0.758 in Table 7 which is greater than the probability value (P-Value) of 0.05 indicating that research hy-pothesis should be rejected.
Table 7. Chi-square tests.
Value df Asymp. Sig. (2-sided) Exact Sig. (2 sided) Exact Sig. (1 sided)
Pearson Chi-Square 0.095a 1 0.758
0.450
Continuity Correctionb 0.016 1 0.900
Likelihood Ratio 0.095 1 0.758
Fisher’s Exact Test 0.856
Linear-by-Linear Association 0.094 1 0.759 N of Valid Casesb 121
a0 cells (0.0%) have expected count less than 5. The minimum expected count is 26.84. bComputed only for a 2 × 2 table.
4.3. Summary
The analysis of the data revealed that the majority of the respondents had an understanding of what annual returns were despite the low filling levels. How-ever, this understanding did not translate into full compliance with filing com-pany annual returns. The study also showed that there was some existence of knowledge gaps in understanding post incorporation requirements for compa-nies by PACRA employees and this in a way has contributed to non-compliance. Additionally, the study revealed that the complicated filing process was one of the major cause of non-compliance. Finally, from the findings it was concluded that the research hypothesizes were not true and were all rejected.
5. Conclusion
DOI: 10.4236/ojbm.2019.74108 1575 Open Journal of Business and Management soon as possible in order to avoid the misinformation about what returns are all about.
6. Recommendations
From the study above it can be deduced that a lot of work needs to be done if companies and businesses are to fully comply with the filing of returns. The need for continued sensitization of the members of the public cannot be over-emphasized. However, the sensitization should be more focused towards the target groups, if it is to be more meaningful as opposed to using the traditional methods of radio and television which have not yielded the intended results. PACRA should also continue to sensitize their employees about the post regis-tration obligation and the companies Act in general in order to bridge the knowledge gap problem. Companies and businesses should be sensitized about the post registration obligation at the point of registration as well. Additionally, the penalties for non-compliance should be more punitive in order to deter would-be offenders. Furthermore, PACRA needs to streamline the registration processes by reducing the number of forms to be filed and also introduce a pa-perless registration of the businesses and companies.
There is need to amend the Act to ensure that businesses and companies that do not file annual returns after a specified period of time say 2 years should be deemed to be non-operational and the Registrar should deregister such busi-nesses and companies. The Registrar of companies needs to be given powers to prosecute companies that operate without having been registered with PACRA. These informal businesses and companies are also creating a problem as a per-son with a registered business or company will not be motivated to comply with the requirements of the Companies Act if some businesses and companies are left to operate without going through the formal registration process. Registra-tion of a business or company raises the cost of doing business for a registered business or company. Additionally, unregistered businesses and companies give rise to unfair competitive advantage to the business or company which is regis-tered.
Acknowledgments
The authors wish to acknowledge all those who took part in the study.
Conflicts of Interest
The authors declare no conflicts of interest regarding the publication of this pa-per.
References
[1] Patents and Companies Registration Agency. Annual Report 2013. [2] Zambia National Parliamentary Debate 2009.
DOI: 10.4236/ojbm.2019.74108 1576 Open Journal of Business and Management
[3] Roshelle, M. (2004) The Impact of Taxpayer Education on Tax Compliance in South Africa.
[4] Samwel, F. (2013) Causes and Consequences of Failure to File the Annual Return by the Tax Payer: A Case Study of Shinyanga Municipality in Tanzania.
[5] Mira Susanti, B. (2007) Tax Knowledge, Tax Ethics and Tax Non Compliant Beha-vior of Non-Accounting Postgraduates from Universiti Teknologi MARA (UiTM). [6] Muoki, N.P. and Rawlings, P.O. (2014) Analysis of Factors Affecting Tax
Com-pliance in Real Estate Sector: A Case of Real Estate Owners in Nakuru Town, Kenya. Research Journal of Finance and Accounting, 5, 4-6.
[7] Alabede, J., Zainol Ariffin, Z. and Idris, K. (2011) Determinants of Tax Compliance Behavior: A Proposed Model for Nigeria. International Research Journal of Finance and Economics, 78, 121-136.
[8] Mukhlis, I., Utomo, S. and Soesetio, Y. (2015) The Role of Taxation Education on Taxation Knowledge and Its Effect on Tax Fairness as well as Tax Compliance on Handicraft SMEs Sectors in Indonesia. International Journal of Financial Research, 6, 167-168. https://doi.org/10.5430/ijfr.v6n4p161
[9] Sapiei, N.S., Kasipillai, J. and Eze, U.C. (2014) Determinants of Tax Compliance Behavior of Corporate Taxpayers in Malaysia. E-Journal of Tax Research, 12, 383-409.
[10] Wilks, D. and Pacheco, L. (2014) Tax Compliance, Corruption and Deterrence: An Application of the Slippery Slope Model. In: Teixeira, A., Ed., Interdisciplinary In-sights on Fraud, Chapter 4, Cambridge Scholars Publishing, Cambridge, 87-104. [11] Soneka, P.N. and Phiri, J. (2019) A Model for Improving E-Tax Systems Adoption
in Rural Zambia Based on the TAM Model. Open Journal of Business and Man-agement, 7, 908-918.https://doi.org/10.4236/ojbm.2019.72062
[12] Becker, G.S. (1968) Crime and Punishment—An Economic Approach. The Journal of Political Economy, 76, 169-217. https://doi.org/10.1086/259394
[13] Ajzen, I. (1991) The Theory of Planned Behavior. Organizational Behavior and Human Decision Processes, 50, 179-211.
https://doi.org/10.1016/0749-5978(91)90020-T
[14] Blumberg, B., Cooper, D.R. and Schindler, S.P. (2008) Business Research Methods. 2nd Europeans Edition, McGraw-Hill Higher Education, London.
[15] Polit, D.F. and Hungler, B.P. (1999) Nursing Research; Principles and Methods. 6th Edition, Lippincott Williams & Wilkins, Philadelphia.
[16] Mugenda, O.M. and Mugenda, A.G. (2009) Research Methods: Quantitative and Qualitative Approaches. Acts Press, Nairobi.