Multi-Deployment of Dispersed Power Sources Using
RBF Neural Network
Yaser Soliman Qudaih,Takashi Hiyama
Computer Science and Electrical Engineering Department, Kumamoto University, Kumamoto, Japan
E-mail: [email protected]
Received June 16, 2010; revised August 2, 2010; accepted September 6, 2010
Abstract
Multi-deployment of dispersed power sources became an important need with the rapid increase of the Dis-tributed generation (DG) technology and smart grid applications. This paper proposes a computational tool to assess the optimal DG size and deployment for more than one unit, taking the minimum losses and voltage profile as objective functions. A technique called radial basis function (RBF) neural network has been util-ized for such target. The method is only depending on the training process; so it is simple in terms of algo-rithm and structure and it has fast computational speed and high accuracy; therefore it is flexible and reliable to be tested in different target scenarios. The proposed method is designed to find the best solution of multi- DG sizing and deployment in 33-bus IEEE distribution system and create the suitable topology of the system in the presence of DG. Some important results for DG deployment and discussion are involved to show the effectiveness of our proposed method.
Keywords:Dispersed Power Sources Deployment, RBF Neural Network, Power Losses Reduction
1. Introduction
The optimal deployment of the dispersed power sources has been discussed as an important factor related to the effect of the DG penetration [1-3]. Keane and O’Malley explain the background to the technical constrains faced by DG projects using linear programming method to determine the optimal allocation [1]. Almost the same approach has been analytically discussed to find the proper size and allocation of DG unit to reduce power losses of the distribution networks [2,3]. On the other hand, Nara et al. have already presented that the distribu-tion system losses can be further reduced if DGs are op-timally allocated on demand side of distribution system using Tabu search algorithm [4]. The same objective to find the power loss reduction of distribution feeder using parametric formula was proposed as in [5]. The extended efforts of this topic come from Kashem et al. where they intend to prove that the appropriate size and location of DG play a significant role in minimizing power losses in distribution systems by introduction of sensitivity analy-sis [6]. Other researchers like Le et al. and Durga et al.
point this problem from different views. The first group discusses the matter of DG size and allocation taking
economic aspects into consideration using sequential quadratic programming (SQP) algorithm [7]. Meanwhile, Durga and Mithulananthan consider the DG existence in the corridor of deregulated electricity market [8]. How-ever, all of the above mentioned efforts tried to solve the DG size and allocation problems based on analytical method and only able to provide a single solution for their objective studies. The general approach to provide the optimal results using such kind of optimization tech-niques is by iteration process. If the step time is small, the result is highly accurate but slowing the computa-tional time. Conversely, if the step time is big, the com-putational time is fast but the result is less accurate. Therefore, the analytical method will end up with high computational burden, time-consuming and less flexible for different objective functions.
comprehen-sive result was achieved by Thong et al. as they intro-duce the distributed generation to support and provide ancillary services for the power system in terms of DG systems voltage support capability, loss compensation and stability support capability [15]. According to [16], authors compare the network performance between the installation of DG and compensating capacitor for loss minimization. Also, a plenty of researches discuss the replacement of capacitor such as in [17-19] that inspire related studies for DG allocation. However, again, those methods even for capacitors allocations and related stud-ies for DG allocation are highly computationally de-manding. In addition, many other studies discuss auxil-iary systems such as energy capacitor system (ECS), to be involved in solving the problems of DG influences. However, such a study doesn’t consider the power losses issue if the location of the ECS changes [20].
Intelligent applications are also involved in solving the matter of DG size and deployment such as using genetic algorithm (GA), artificial neural network (ANN) and particle swarm optimization (PSO) as in [21-23], respec-tively. Unlike other researches which implement intelli-gent systems to solve the equations of the system with respect to the problem or to create the suitable control to the system’s behaviors, this study presents a completely different policy by developing a new powerful tool to solve the problem directly without being involved in the mathematical structure of the system. Especially for the ANN methods, they have simpler computational tech-niques and higher pattern recognition abilities than other optimization method [24,25]. Moreover, this method does not require knowledge on internal system behavior; re-quires less computational effort and provides compact solutions for multi-objective problems [26]. In some cases, only training process is required and the optimum point is directly determined without solving any non- linear mathematical equations or statistical assumptions as in the conventional optimization methods [27]. For these reasons, the ANN methods is suitable to estimate the voltage profile and total power losses under connec-tion of DG units where their outputs are intermittent and fluctuated based on environmental conditions.
In this study, the variant of ANN methods called radial basis function (RBF) neural network is utilized as a computational tool to assess the existence of DG unit. There are two structures for this purpose under the same input signals. The input signal is denoted as the potential size of DG unit in 33 nodes that can be considered as the domain operating condition of the proposed structure. The first structure is for the optimal measurement of voltage profile in 33 nodes and the second structure is only for the optimal power losses measurement. Basi-cally, one single RBF structure can be created for this
study; however the over-fitting condition may occur during the validation step. In comparison with other ANN structure, like three layered feed-forward network (TFFN) and adaptive neuro-fuzzy inference system (ANFIS) methods, the RBF method is recognizably fast during the training process and the structure in terms of number of hidden neurons is directly confirmed soon after the training process. The accuracy of this technique is noticeably high during the validation process which is similar to ANFIS network outcomes [28]. For utilizing this technique, only training process is required and after the structure is confirmed; wide different scenarios can be set including finding the optimal size and location of DG unit. The only drawback of this method that may be encountered is the difficulty in dealing with different objective of studies. But, again only training process is necessary to solve this change; therefore the method is flexible and reliable to solve different cases, targets and scenarios.
The paper is divided into five sections. Section 1 reviews the DG and their influences. It also provides an overview of other previous researches and the methods on how to find the optimal size and location of DG unit in different objectives. Section 2 describes the case study in terms of system configuration and the way to approach the load flow study. Our intentions from this part is to obtain the load flow result as training data set which may represent the voltage profile and total power losses as the function of DG sizing in each bus. Then, the RBF struc- ture which covers the training procedure and validation process will be explained in Section 3. Section 4 provi- des the simulation results including discussion part. Fi- nally, the conclusion is drawn in Section 5.
2. Case Study
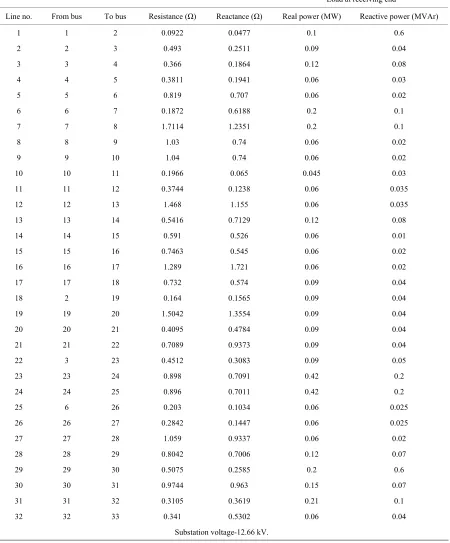
The target of the proposed design is the 33-nodes IEEE distribution system. Therefore, it is necessary to generate the power flow data of this system using the data shown in Table 1 [29].
Two outcomes are expected from the load flow study;
i.e., voltage magnitudes and total power losses based on the certain limit of DG size in each node as the ope- rating condition of the entire network. The procedure to calculate the total power losses is explained as follows and inside the mathematical equations, the voltage mag- nitude is also explicitly obtained.
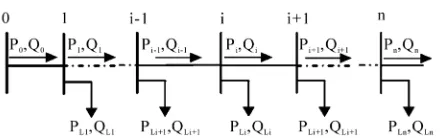
In this study, a set of simplified feeder-line flow for- mulations is employed [30]. Considering the single-line diagram depicted in Figure 1.
Table 1. The 33-bus distribution system data.
Load at receiving end
Line no. From bus To bus Resistance (Ω) Reactance (Ω) Real power (MW) Reactive power (MVAr)
1 1 2 0.0922 0.0477 0.1 0.6
2 2 3 0.493 0.2511 0.09 0.04
3 3 4 0.366 0.1864 0.12 0.08
4 4 5 0.3811 0.1941 0.06 0.03
5 5 6 0.819 0.707 0.06 0.02
6 6 7 0.1872 0.6188 0.2 0.1
7 7 8 1.7114 1.2351 0.2 0.1
8 8 9 1.03 0.74 0.06 0.02
9 9 10 1.04 0.74 0.06 0.02
10 10 11 0.1966 0.065 0.045 0.03
11 11 12 0.3744 0.1238 0.06 0.035
12 12 13 1.468 1.155 0.06 0.035
13 13 14 0.5416 0.7129 0.12 0.08
14 14 15 0.591 0.526 0.06 0.01
15 15 16 0.7463 0.545 0.06 0.02
16 16 17 1.289 1.721 0.06 0.02
17 17 18 0.732 0.574 0.09 0.04
18 2 19 0.164 0.1565 0.09 0.04
19 19 20 1.5042 1.3554 0.09 0.04
20 20 21 0.4095 0.4784 0.09 0.04
21 21 22 0.7089 0.9373 0.09 0.04
22 3 23 0.4512 0.3083 0.09 0.05
23 23 24 0.898 0.7091 0.42 0.2
24 24 25 0.896 0.7011 0.42 0.2
25 6 26 0.203 0.1034 0.06 0.025
26 26 27 0.2842 0.1447 0.06 0.025
27 27 28 1.059 0.9337 0.06 0.02
28 28 29 0.8042 0.7006 0.12 0.07
29 29 30 0.5075 0.2585 0.2 0.6
30 30 31 0.9744 0.963 0.15 0.07
31 31 32 0.3105 0.3619 0.21 0.1
32 32 33 0.341 0.5302 0.06 0.04
Substation voltage-12.66 kV.
upon the application. For instance, the distribution lines are represented as series impedance; constant load de-mand and balanced power sink of the values Zi,i+1 = Ri,i+1 + jXi,i+1and SL = PLv + jQL, respectively. The real and
reactive power flow at the receiving end of branch i + 1
and the voltage magnitude at the receiving end are res- pectively expressed by the following equations:
2 2
1 1 , 1 2
i i
i i Li i i
i
P Q
P P P R
V
Figure 1. Single-line diagram of the basic feeder in radial distribution system.
2 2
1 1 , 1 2
i i
i i Li i i
i
P Q
Q Q Q X
V
(2)
2 2
1 , 1 , 1
2 2
2 2
, 1 , 1 2
2( . . )
( )
i i i i i i i i
i i
i i i i i
V V R P X Q
P Q R X V
(3)
Equations (1-3) are known as the distflow equations. Hence, if P0, Q0 and V0 at node number 1 are estimated,
then the same equations at the other nodes can be calcu-lated by applying the above branch equations. That is known as forward update. Similarly a backward update is applied by the following set of equations:
'2 '2
1 1 , 1 2
i i
i Li i i
i
P Q
P P P R
V
(4)
'2 '2
1 1 , 1 2
i i
i i Li i i
i
P Q
Q Q Q X
V
(5)
2 2 ' '
1 1, 1,1
'2 '2
2 2
-1, -1, 2
2( . . )
( )
i i i i i i i
i i
i i i i
i
V V R P X Q
P Q
R X
V
(6)
Where, '
i i Li
P P P and '
i i Li
Q Q Q .
The power loss of the line section connecting between buses i and i+1 is calculated as:
2 2
, 1 2
( , 1) i i
Loss i i
i
P Q
P i i R
V
(7)
Total power loss in the base case and in the case of diesel generator will be calculated by summing the whole losses of all sections of the feeder as:
1 , 0 , 1 nLoss T Loss i
P P i i
(8)Based on the above mathematical model, Matlab/ Simulink model has been developed [31]. The expected load power flow measurement are the voltage profile in each bus and the total power losses as the size of DG unit is varied in every location inside the network. The opti-mal size and location of the next DG unit can be found using the proposed algorithm without any need to repeat
the power flow calculations or the training process, as will be explained in the next sections. These outcomes will be used as the training data patterns in the next sec-tion. The reason of transforming this model into intelli-gent techniques model is because of the slowness in time simulation. In the conventional model, it takes some times to wait until the objectives of power flow result for one operating condition are confirmed. With intelligent method, the entire computational burden will be avoided and the model will be flexible to deal with different sce-narios.
3. RBF Neural Network Structure
RBF neural network is a typical neural network structure using local mapping instead of global mapping as in multi layer perceptron (MLP) [32]. In MLP method, all inputs cause an output, while in RBF method; only in-puts near a receptive field produce activation function. The hidden layer is locally tuned neurons centered over receptive fields. Receptive fields are located in the input space areas where input vectors exist. If an input vector lies near the center of a receptive field, then that hidden layer will be activated. Because of this approach, the training process using RBF network is very simple. Once the set goal error is reached, the training is stopped and the number of hidden nodes is confirmed.
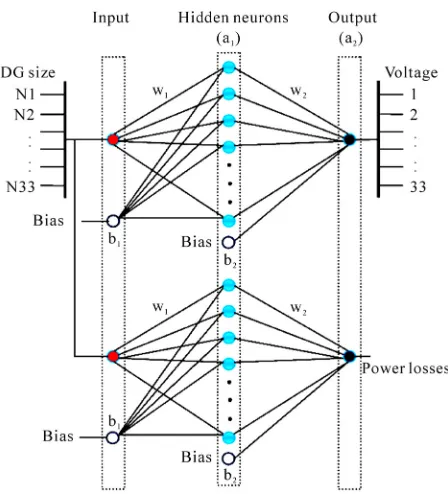
In this study, two structures of RBF neural network which is for estimation of voltage profile and total power loss is developed. Basically, a single structure for this study can be designed; however much higher error may occur during the validation process. The basic configura-tion of the proposed network is shown in Figure 2. In this figure, there are 33 input signals (N1-N33) for both estimation purposes that represent the size of the DG unit for each node. On the other hand, there are 33 output signals for voltage profile estimation and only a single output signal for the total losses.
Figure 2. ANN RBF network structure.
maximum number of neurons (MN) and the number of neurons to add between displays (DF) are 0.003, 1.0, 133, 1, respectively.
The outcomes of the training process are the number of the hidden neurons that represent the structure of RBF neural network and the training error that represents the accuracy of the confirmed structure. As results, there are 119 of hidden neurons and 0.000933 of training error for RBF based voltage estimation as shown in Figure 3, while there are 129 of hidden neurons and 0.00062 of training error for RBF based total losses estimation as shown in Figure 4.
At glance, the RBF structure is similar to the TFFN network in terms of weights and biases connection be-tween layers. The weights w1 connect the input layer to
the hidden neurons and weights w2 connect the hidden
neurons to the output layer. Also, there are two biases b1
and b2 for utilizing this network. The only difference is
the implementation of transfer function between the lay-ers. In TFFN structure, logsig function is the common utilized function in all layers, depending on the target of study and the complexity input-output data patterns. In RBF network, in the first layer, the Euclidean distance weight function is applied for all input signals and its connected weight w1 and bias b1, before preceding them
to the 'radbas' transfer function. This algorithm can be formulated as follows:
1 1 1
1 2 1 33 1
( ) [ ( ( ,1)
( , 2) ... ( ,33) ). ( ,1)]
a n radbas dist w n N
w n N w n N b n
(9)
[image:5.595.311.533.78.220.2]where n is the number of the nodes in the hidden layer
Figure 3. Error during training process for voltage estima-tion.
Figure 4. Error during training process for power loss es-timation.
and N is the number of the input node representing the node of the real system. In this structure, n is equal to 119 and 129 for estimation tasks of voltage profile and total power losses, respectively.
After this process, the output layer a2 is calculated by simply applying the ‘purelin’ transfer function between a1 and weights w2, include the bias b2 of the second layer.
The mathematical model is stated for this condition as:
2 2 1 2
1
( ) n , .
n
a m purelin w m n a n b
(10)where m is the number of nodes in the output layer. In this case, m is equal to 33 and 1 for estimation tasks of voltage profile and total power losses, respectively.
[image:5.595.312.535.267.401.2]Figure 5. Validation result for voltage profile after the train-ing process.
Figure 6. Validation result for total losses after the training process.
results are highly accurate to be applied in finding the optimal size and location of DG unit as our main objec-tives in this study.
4. Results Analysis and Discussion
To reach our objectives in this study, several tests have been performed in order to find the best solution for op-timal size and deployment of several DG units. At the beginning, all inputs from N1 to N33 are zeroed to rep-resent the base case where no DG is connected. The simulation runs to find the voltage at every node and the total losses in the system. After that, the inputs are re-placed by a ramp function at every node. The data gener-ated by ramp function is shown in Figure 7 representing the DG size increased from 0 to 5 MW gradually with a specified step. The reason of selecting these data ranges is to match with the maximum load demand of the speci-fied system and also to implement a variety of DG sizes with a small step difference. Under this scenarios, the simulation runs to find the total losses in the system and
the voltage at every node.
The optimum size of DG unit taking the minimum losses as the reference on each node can be measured by applying the ramp signal shown in Figure 7 for the con-structed RBF network presented in Figure 2. Under this approach, the optimal DG unit size at nodes no. 9, 18 and 32 can be obtained as 1.7, 0.7, 1.1 MW related to a minimum losses of 139.4, 149.2, 141.1 kW, respectively. This result is shown in Figure 8, taking the assumption of distance location; near (node No. 9), middle (node No. 18) and far (node No. 32) from the main source in upper system. This kind of information is very beneficial to the utility because the optimal size can be early identified once there will be a plan to connect DG source at any location of the network. Again, the proposed method provides excellent support to test different scenarios without heavy computational steps. By using this ap-proach, the optimum size of the DG unit at each location is illustrated in Figure 9. Similar outcomes in Figure 9
have been achieved as in [3] using analytical method. However, as mentioned before, that using analytical technique only provides a single solution for certain ob-jectives. In fact, our proposed method can handle differ-ent test scenarios and the result achieved in Figure 9 is the one solution among the wide range of objectives.
It is shown in Figure 9 that there is a potential to in-stall higher capacity of DG unit very close to the upper
Figure 7. Input data for the RBF network which represents the DG sizes.
system, then the size is gradually decreased to the middle distance of the network. Also, in some locations far away from the main source, like nodes No. 19, 23, 26 and 27; the optimal size in medium capacity of DG unit can be connected under minimum losses. However, these results do not represent basically the optimal size for the overall minimum losses of entire network, but only for those specified locations. Further clarification is necessary to find the exact position of the DG units in the entire net-work based on the minimum losses. This concept is clearly depicted in Figure 10. For instance, the optimal size of DG unit at node 1 is around 5MW, but the mini-mum loss of the network under this size is not the lowest one and so on for other nodes. Based on Figure 10, the lowest minimum losses is at node No. 6 with the optimal size of the DG unit equals to 2.66 MW, followed by node No. 26 with the size of 2.4 MW. Having this information provides hierarchical locations to install the DG unit, depending on the availability of power source on the network. If the main consideration is the minimum power losses, then nodes 7-18 and nodes 27-33 are the reason-able options. For instance, the node No. 7 can be the al-ternative solution with 2.4 MW in optimal size to replace the location of DG unit in bus 6 due to the abundance of
Figure 9. Optimal size of the DG at every node of the distri- bution system.
Figure 10. Total minimum power loss of the distribution system at every node with the 1st DG.
sunlight for PV system or the availability of biomass/fuel cells source at node No. 7. Especially the group nodes no. 27-33, this is also the other benefits from the proposed study that there is a high potential to install DG unit far away from the main source which is a common recent trend.
The proposed method is properly working to find the optimal location and size of more than one DG unit in the distribution system. Following the information in
Figure 9, bus No. 6 is the best location for single DG unit of 2.6 MW based on the minimum power losses in
Figure 10. For the second unit, the optimal place and size can be reached by using the same RBF structure taking the first DG unit into account. The updated chart for this process is shown in Figure 11. In this figure, the size of DG at bus No. 6 is zero because the first unit is already installed there. As results, the DG units of 0.7, 0.6 and 0.6 MW are optimally located in the buses 16, 17 and 18, respectively. The related minimum losses are shown in Figure 12. The advantage of this method is no further training process, therefore the computational process is fast and it has high adaptability and accuracy to different input scenarios.
As a comparison between the proposed method with
Figure 11. Updated chart for the optimal size of the second DG at every node of the distribution system.
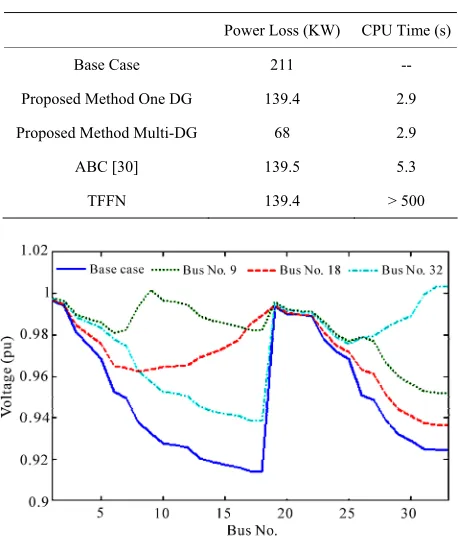
other methods in terms of performance and consuming time, Table 2 has been prepared.
In the past, there were debates about system voltage violation caused by the existence of DG unit. This is probably true if the optimal size cannot be determined before connecting the unit to the network. However, if the proper size can be decided early before the installa-tion then the presence of DG unit will improve the volt-age level quality of the entire network. In order to inves-tigate the voltage profile in the presence of DG systems, a base case defined as the system without any DG con-tribution is compared with the cases of optimum DG connected at the suitable location as declared from the above discussion. The same nodes 9, 18 and 32 are tested with the optimal DG capacity presence and the voltage profile at every bus is measured to conclude that the voltage profile of the system is not only kept in the range but noticeably improved. Figure 13 shows that without DG unit the voltage level at node 18 reaches 0.915 p.u which may be critical within the permitted range. This problem can be solved by installing a unit of 1.1MW at node No. 32. The significant voltage improvement of this point is observed when the location of unit much closer to the upper system (DG unit at node No. 9). For other cases, this method can prepare a look up chart showing all voltage ranges with respect to the presence of optimal DG unit to survey for the best voltage profile. Therefore, the only condition to be provided to reach the voltage improvement in this study is the installation of optimal size DG unit in the right location.
Another important result from our proposed method is that the voltage profile of the entire network can be mo- nitored as the DG size is changed in specified location. The 3-D graph in Figure 14 shows the placement of DG unit at node No. 18. In the figure the x-axis represents the location which is the 33 nodes of the real system and N1 to N33 in the RBF neural network, y-axis represents the size of the DG incremented with a specified step from 0 to 5 MW ramp function, that representing the power injected to the system, and z-axis represents the voltage at every node of the system in per unit. It is no-ticeable that there is no sign of voltage violation during the process till the optimum size of the DG is achieved which implies that DG contribution does not affect the voltage of the distribution system during loss reduction process in the steady state condition. Again, this result is obtained fast without having any computational burdens.
5. Conclusions
[image:8.595.308.537.89.357.2]This paper reports a simple and well defined approach to solve the problem of multi DG deployment. RBF Neural network structure has been developed to achieve the goal of this paper in a short and easy way. Different sizes of
Table 2. Comparison results.
Power Loss (KW) CPU Time (s)
Base Case 211 --
Proposed Method One DG 139.4 2.9
Proposed Method Multi-DG 68 2.9
ABC [30] 139.5 5.3
[image:8.595.311.532.412.570.2]TFFN 139.4 > 500
Figure 13. Voltage profile of the system in the base case compared with the optimum DG placed at different loca-tions.
Figure 14. Voltage profile of the system with DG allocated at Node 18.
scenario the optimal size and deployment of DG units in the medium tension distribution networks can be easily found. In addition, the contribution of dispersed power sources technology in reducing power losses and en-hancing the voltage profile is proved.
6. References
[1] A. Keane and M. O’Malley, “Optimal Allocation of Em-bedded Generation on Distribution Networks,” IEEE
Transactions on Power Systems, Vol. 20, No. 3, 2005, pp.
1640-1646.
[2] C. Wang and M. H. Nehrir, “Analytical Approaches for Optimal Placement of Distributed Generation Sources in Power Systems,” IEEE Transactions on Power Systems, Vol. 19, No. 4, 2004, pp. 2068-2076.
[3] N. Acharia, P. Mahat and N. Mithulananthan, “An Ana-lytical Approach for DG Allocation in Primary Distribu-tion Network,” Electrical Power and Energy Systems,
Vol. 28, No. 10, 2006, pp. 669-678.
[4] K. Nara, Y. Hayashi, B. Deng, K. Ikeda and T. Ashizawa, “Optimal Allocation of Dispersed Generators for Loss Minimization,” Electrical Engineering in Japan, Vol. 136, No. 2, 2001, pp. 1-8.
[5] M. H. Narazi and M. Parniani, “Determining and Opti-mizing Power Loss Reduction in Distribution Feeders due to Distributed Generation,” Power Systems Conference
and Exposition, IEEE PES, Atlanta, 2006, pp. 1914-1918.
[6] M. A. Kashem, A. D. T. Le, M. Negnevitsky and G. Led-wich, “Distributed Generation for Minimization of Power Losses in Distribution Systems,” IEEE Power
Engineer-ing Society General MeetEngineer-ing, Art. No. 1709179, 2006.
[7] A. D. T. Le, M. A. Kashem, M. Negnevitsky and G. Ledwich, “Optimal Distributed Generation Parameters for Reducing Losses with Economic Consideration,”
IEEE Power Engineering Society General Meeting, Art.
No. 4275824, 2007, pp. 1-8.
[8] D. Gautam and N. Mithulananthan, “Optimal DG Place-ment in Deregulated Electricity Market,” Electric Power
Systems Research, Vol. 77, No. 12, 2007, pp. 1627-1636.
[9] C. L. T. Borges and D. M. Falcão, “Optimal Distributed Generation Allocation for Reliability, Losses, and Volt-age Improvement,” Electrical Power and Energy Systems, Vol. 28, No. 6, 2006, pp. 413-420.
[10] D. Trebolle, T. Gómez, R. Cossent and P. Frías, “Distri-bution Planning with Reliability Options for Distributed Generation,” Electric Power Systems Research, Vol. 80, No. 2, 2010, pp. 222-229.
[11] M. Fotuhi-Firuzabad and A. Rajabi-Ghahnavie, “An Ana- lytical Method to Consider DG Impacts on Distribution System Reliability,” Proceedings of the IEEE Power En-gineering Society Transmission and Distribution Confer-ence, Art. No. 1547168, 2005, pp. 1-6.
[12] I.-S. Bae, J.-O. Kim, J.-C. Kim and C. Singh, “Optimal Operating Strategy for Distributed Generation Consider-ing Hourly Reliability Worth,” IEEE Transactions on
Power Systems, Vol. 19, No. 1, 2004, pp. 287-292.
[13] Y. Yue, Q. Kejun and Z. Chengke, “The Effect of Dis-tributed Generation on Distribution System Reliability,”
Proceedings of the Universities Power Engineering
Con-ference, Art No. 4469070, 2007, pp. 911-916.
[14] J. Morren, S. W. H. de Haan and J. A. Ferreira, “Contri-bution of DG Units to Primary Frequency Control,”
European Transaction on Electrical Power, Vol. 16, No.
5, 2006, pp. 507-521.
[15] V. van Thong, J. Driesen and R. Belmans, “Using Dis-tributed Generation to Support and Provide Ancillary Services for the Power System,” International
Confer-ence on Clean Electrical Power, ICCEP’07, Art. No.
4272375, 2007, pp. 159-163.
[16] S. Rhim, T. Rahman, I. Musirini, S. Azmi, M. Mohamed, M. Hussain, M. Faridun, “Comparing the Network Per-formance Between the Installation of DG and Compen-sating Capacitor Using EP,” International Journal of
Power, Energy and Artificial Intelligence, Vol. 1, pp 14-
21.
[17] H. N. Ng, M. M. A. Salama and A. Y. Chikhani, “Classi-fication of Capacitor Allocation Techniques,” IEEE
Transactions on Power Delivery, Vol. 15, No.1, 2008, pp.
387-392.
[18] Y. T. Hsiao and C. Y. Chien, “Optimisation of Capacitor Allocation Using an Interactive Trade-off Method,” IEE
Proceedings, Generation, Transmission and Distribution,
Vol. 148, No. 4, 2001, pp. 371-374.
[19] M. Delfanti, G. P. Granelli, P. Marannino and M. Mon-tagna, “Optimal Capacitor Placement Using Determinis-tic and GeneDeterminis-tic Algorithms,” IEEE Transactions on
Power Systems, Vol. 15, No. 3, 2000, pp. 1041-1046.
[20] Y. Qudaih and T. Hiyama, “Reconfiguration of Power Distribution System Using Multi Agent and Hierarchical Based Load Following Operation with Energy Capacitor System,” Proceedings of the 8th International Power
En-gineering Conference, Singapore, 2007, pp. 263-267.
[21] V. Calderaro, A. Piccolo and P. Siano, “Maximizing DG Penetration in Distribution Networks by Means of GA Based Reconfiguration,” International Conference on
Future Power Systems, Art. No. 1600510, 2005.
[22] J. N. Fidalgo, J. A. F. M. Torres and M. Matos, “Fair Allocation of Distribution Losses Based on Neural Net-works,” International Conference on Intelligent Systems
Applications to Power Systems, Art. No. 4441685, 2007,
pp. 1-6.
[23] W. Prommee and W. Ongsakul, “Optimal Multi-Distrib-uted Generation Placement by Adaptive Weight Particle Swarm Optimization,” International Conference on
Con-trol, Automation and Systems, Korea, 2008, pp. 1663-
1668.
[24] A. Mellit and S. A. Kalogirou, “Artificial Intelligence Techniques for Photovoltaic Applications: A review,”
Progress in Energy and Combustion Science, Vol. 34, No.
5, 2008, pp. 574-632.
“Artificial Intelligence Techniques for Sizing Photo-voltaic Systems: A review,” Renewable and Sustainable
Energy Reviews, Vol. 13, No. 2, 2009, pp. 406-419.
[26] F. Giraud and Z. M. Salameh, “Analysis of the Effects of a Passing Cloud on a Grid-Interactive Photovoltaic Sys-tem with Battery Storage Using Neural Networks,” IEEE
Transactions on Energy Conversion, Vol. 14, No. 4, 1999,
pp. 1572-1577.
[27] A. Mellit, M. Benghanem and S. A. Kalogirou, “An Adaptive Wavelet-Network Model for Forecasting Daily Total Solar-radiation,” Applied Energy, Vol. 83, No. 7, 2006, pp. 705-722.
[28] Syafaruddin, E. Karatepe, T. Hiyama, “Feasibility of Artificial Neural Network for Maximum Power Point Es-timation of Non Crystalline-Si Photovoltaic Modules,”
The 15thISAP Conference, Curitiba, 2009.
[29] M. E. Baran and F.Wu, “Network Reconfiguration in
Distribution System for Loss Reduction and Load Bal-ancing,” IEEE Transactions on Power Delivery, Vol. 4, No. 2, 1989, pp. 1401-1407.
[30] R. Srinivasa, S. V. L. Narasimham and M. Ramalingaraju, “Optimization of Distribution Network Configuration for Loss Reduction Using Artificial Bee Colony Algorithm,”
Proceedings of World Academy of Science, Engineering
and Technology, Vol. 35, 2008, pp. 709-715.
[31] Y. Qudaih and T. Hiyama, “Wealth in DG Diversity for Power Distribution System Operation Improvement,”
Transmission & Distribution Conference & Exposition:
Asia and Pacific,Dalian, 2009, pp. 1-4.
[32] A. Mellit, M. Menghanem and M. Bendekhis, “Artificial Neural Network Model for Prediction Solar Radiation Data: Application for Sizing Standalone Photovoltaic Power System,” Proceedings of IEEE Power Engineering