ISSN Online: 2157-9458 ISSN Print: 2157-944X
DOI: 10.4236/fns.2019.107057 Jul. 29, 2019 776 Food and Nutrition Sciences
Effect of Adding Walnut Powder on Physical
and Chemical Properties of Wheat Flour and
Preventing Hyperlipidemia in Mice
Gill Ali Abrar
1, Fanrui Zhao
1, Hanxiong Qin
1, Ji Wang
1,2, Chunlei Liu
1,2, Weihong Min
1,2*1College of Food Science and Engineering, Jilin Agricultural University, Changchun, China 2National Engineering Laboratory of Wheat and Corn Deep Processing, Changchun, China
Abstract
Walnuts (Juglans regia L.) are naturally rich source of many important nu-trients which could be helpful in different food processing. Walnut mainly containing polyunsaturated fatty acids (PUFA), especially alpha linoleic acid (18:3n-3; 9 g) and linoleic acid (18:3n-; 38 g). Walnuts powder was fortified with commercial high gluten wheat flour (WF) into 4 composites flour from 10% to 40%. Walnut flour improves the nutritional value due to high protein and fat content, but affects the technological properties. Parameters such as functional, pasting and rheological properties demonstrated the influence of walnut reincorporation into gluten network. The interaction of walnut flour with wheat flour is a key factor which effects on the dough quality, causing thinning and weakening the gluten structure. Flour with 30% to 40% walnut substitution was more nutritious especially in relation to protein and mo-nounsaturated fatty acid (MUFA), but responsible for more changes in tech-nological characteristics of dough. Present study was also directed to examine the effect of moderate walnut consumption on lipids profile, enzymatic an-ti-oxidant (superoxide dismutase SOD and glutathione peroxidase GSH-Px) and lipid peroxidation (Melondialdehyde MDA) in rats fed with high-fat food. The Sprague Dawley rats were housed for five weeks and assembled into normal, high fat, high fat (HF) + 10% walnut, HF + 20% walnut, HF + 30% walnut and HF + 40% walnut. The lipid profile significantly improved espe-cially by lowering the low-density lipoprotein cholesterol (LDL-c) and high-density lipoprotein cholesterol (HDL-c) level increased in the group of HF + 40% walnut. The total anti-oxidant, SOD and GSH-Px activity were in-creased by supplementation of walnut and significantly higher in HF + 40% compared to the normal group. The Melondialdehyde (MDA) or lipid perox-idation status was increased in HF + 20% walnut to HF + 30% walnut as compared to normal and HF-fed diet but reduced by HF + 40% walnut. These
How to cite this paper: Abrar, G.A., Zhao, F.R., Qin, H.X., Wang, J., Liu, C.L. and Min, W.H. (2019) Effect of Adding Walnut Powder on Physical and Chemical Proper-ties of Wheat Flour and Preventing Hyper-lipidemia in Mice. Food and Nutrition Sciences, 10, 776-792.
https://doi.org/10.4236/fns.2019.107057
Received: February 21, 2019 Accepted: July 26, 2019 Published: July 29, 2019
Copyright © 2019 by author(s) and Scientific Research Publishing Inc. This work is licensed under the Creative Commons Attribution International License (CC BY 4.0).
http://creativecommons.org/licenses/by/4.0/
DOI: 10.4236/fns.2019.107057 777 Food and Nutrition Sciences results suggest that walnut intake could be effective to protect from oxidative stress by lowering the lipid peroxidation by improving antioxidant defense system in rats fed high-fat diet.
Keywords
Walnut, Pasting Properties, Rheological Properties, Lipids, Enzymatic Anti-Oxidant, Lipids Peroxidation
1. Introduction
Walnuts (Juglans regia L.) have different types of nutrients associated with fatty acids that differ from all other nuts, making them very special. Nuts other than walnut have more monounsaturated fatty acids (MUFA), but walnut mainly containing polyunsaturated fatty acids (PUFA), especially alpha linoleic acid and linoleic acid. Nowadays, the intake of the fatty diet which holds lower amount of bioactive components, dietary fibers and other micronutrients which is respon-sible for the elevation of blood pressure, diabetes, hyper cholesterol, hyperlipi-demia and cardiac disorders. Ingestion of certain active ingredients, such as fla-vonoids, carotenoids and Glucosamine, is directly associated with decreasing the threat of hyper cholesterol, hypertension, cardiac and many other chronic dis-eases [1] [2].
DOI: 10.4236/fns.2019.107057 778 Food and Nutrition Sciences Superoxide dismutase (SOD) is an enzyme that alternately catalyzes superox-ide (
O
2−) free radicals to decompose into common molecular oxygen or hydro-gen peroxide. Superoxide is produced as a by-product of oxyhydro-gen metabolism and can lead to multiple types of cell damage [10]. SOD is an important antioxidant defense against all living cells exposed to oxygen. Glutathione peroxidase (GSH-Px) is a widespread, important hydrogen peroxidase in organisms. It cat-alyzes glutathione’s reduction reaction with peroxide diagnostically leads to protection of cell structure and functions [11]. Today many developing countries facing major problem related to nutrition aspects, which leads to infant death, poor physical and mental growth of kids and low resistance to disease. There-fore, the aim of this study was to investigate the effect of walnut on enzyme an-tioxidant activity, lipid profile, lipid peroxidation. This study was also obtained to evaluate the pasting and rheological properties for further application in the food processing industry.2. Material and Methods
2.1. Materials and Reagents
Raw walnuts and wheat flour were obtained from the retail outlet of Changchun, Jilin Province, China. All Diagnostic Kits were purchased from Nanjing Jian-cheng Institute of Bioengineering Technology Co., Ltd. (Nanjing, China). The reagents using for all analysis were analytically graded.
2.2. Sample Preparation
First of all raw walnuts were entirely cleaned to take away any adhesion impuri-ties. Then they cooked 25 - 30 minutes using stainless steel pain in order to re-move the shell. The worn walnut is then cut into small pieces. A fine time was carried out in the hot water of 90˚C - 95˚C. Then after draining the water, the walnut is placed in air dried oven at 80˚C for 3 h. Then ground in (Renker, Model: GMO 1 Grinder) and screened to produce fine walnut powder and used for further analysis to check its quality properties, such as approximate composi-tion, functional properties, paste characteristics, rheological properties and for experimental diet.
2.3. Composites of Wheat/Walnut Flour
For this purpose 5 flour composites were prepared with the formulation of 100%, 90%, 80%, 70% and 60% of wheat flour (WF) and 0, 10%, 20%, 30% and 40% of walnut flour (WWF) according to [12]. All flour blends were named as WF, WWF1, WWF2, WWF3 and WWF4 respectively.
3. Proximate Composition of Flour Blends
DOI: 10.4236/fns.2019.107057 779 Food and Nutrition Sciences
3.1. Pasting Properties
Gelatinization attributes of flour composites were determined according to [14] by (RVA) rapid visco analyzer (Perten scientific instrument, Hagersten Sweden), with little modification. 3 gram of flour was used with 30 milliliters of deionized water every single time. Then paddle was placed in a canister holding the water with flour sample. Initial 60 seconds sample were held at (50˚C) and stirred at 160 round per minute the temperature was raised up to 95˚C and heated for 3.8 minutes, after that the trial was subsequently cooled at 50˚C for 4 minutes and held at 50˚C intended for further 2 minutes. The paste properties of the flour samples i.e. breakdown, setback, pasting temperature, peak, final and trough viscosity were automatically recorded on the instrument's scale. All measure-ment was replicated thrice.
3.2. Rheological Attributes
During heating and subsequent cooling, a dynamic oscillation measurement of the suspension of 10% of flour and flour fractions in distilled water was carried out using the Anton Paar Rheometer (MCR 302, Anton Paar, Inc., Tru GapTM,
USA). The samples were loaded between two parallel plates of 3 cm in diameter with 1 mm gap. For the prevention of samples from dehydration and insulating plate were used in foam to ease heat dissipation the sample circumference and protect with silicone oil coating. Then, the sample was started heating at the rate of 1˚C/min and frequency was set at 0.1 - 10 Hz. Loss G' and the storage mod-ulus G", were constantly observed throughout the dynamic rheological testing system [15].
3.3. Efficacy Study
3.3.1. Animal Care and Experimental Design
48 male Sprague Dawley Rats of 5 weeks old (28 - 30 grams) were taken from Changchun Institute of Biological Products Co., Ltd. (license number) Scxk (Liao, 2015-0001) Changchun, China. Rat feed was purchased from Beijing Kai Cooperative Feed Co., Ltd. (license number). SCXK (Beijing) 2014–0010). The experimental study was conducted in agreement with the recommendations of the Animal Welfare Act, for the care and use of laboratory animals. The rats were randomly placed in a polypropylene cage (320 × 215 × 170 mm) with stainless steel cover and fixed under controlled conditions 22˚C ± 2˚C and rela-tive humidity of 60%, with a 12-hour light cycle and lights were turned off at 7 pm. In the first week, all rats were fed to their basic diet and water freely to maintain new environment.
DOI: 10.4236/fns.2019.107057 780 Food and Nutrition Sciences (HF) diet, but increased by 10% - 40% walnut solution 1 ml/100g of body weight by oral gavage. The physiological saline solution was given with the rate of 1 ml/100g of body weight by oral gavage on daily basis to the animals of normal and HF groups. Animals were housed for 35 days under controlled conditions and body weight gain were collected on a weekly basis.
3.3.2. Tissue and Blood Collection
After the 35 days of trial blood samples were collected after 24 h of starved time and rats were killed after blood collection immediately with cervical dislocation. After the collection of blood, the serum was separated by centrifugation at 3500 rpm for 10 minutes. All body organs were also collected to check their organ weights. Then the separated blood serum, liver and brain tissue were stored at −20˚C for further analysis.
3.3.3. Serum Lipid Profile
For analysis of serum total cholesterol (TC) values of rats were measured using the CHOD-PAP method according to [16]. Triglycerides (TG) in serum were calculated by liquid triglycerides (GPO-PAP) method followed by [17]. The ab-sorbance values were measured at 510 nm. LDL-C, and HDL-C were detected by using commercial kits and absorbance was read at 546 nm according to the company’s instructions.
3.3.4. Liver Lipid Profile
For liver lipid profile analysis tissue, 1 g sample was weighed precisely and add 9 ml homogenate medium (absolute alcohol) at the ratio of 1:9 to make 10% (vo-lume/volume). The homogenate medium was mixed with tissue sample in an ice water bath. Then homogenate solution was treated with centrifugation at 2500 rpm for 10 minutes at 4˚C and supernatant was extracted for use. The HDL-C, LDL-C, TC and TG in the supernatant were measured using commercial kits according to the company’s instructions.
3.3.5. Total Antioxidant Activity
Total antioxidant activities (T-AOC) of blood serum, liver and brain tissue were measured by 2,2’-azino-bis(3-ethylbenzothiazoline-6-sulphonic acid) using (A015-2, ABTS) commercial kit according to the company’s guidelines. The re-sults were expressed in mM and mM/mg protein on blood serum and tissue homogenate respectively against the Trolox standard curve.
3.3.6. Determination of Enzyme Antioxidant Activity
DOI: 10.4236/fns.2019.107057 781 Food and Nutrition Sciences GSH-Px active site is Se-cysteine, selenium is a necessary part of GSH-Px, and 1 mol GSH-Px contains 4 g selenium.
3.3.7. Lipids Peroxidation/Melondialdehyde (MDA) Assay
Lipid peroxidation was analyzed with the amount of thiobarbituric acid reactive substances (TBARS) by using commercial kit (A003-1) according to the company’s guidelines with (TBA) method. The results of MDA were expressed in nmol/ml for blood serum and nmol/mg protein of liver and brain tissue homogenate.
3.4. Statistical Analysis
To determine the least significant difference (p < 0.05) the data of all parameters were subjected to statistical analysis. All results were expressed by using analyti-cal software statistics 8 version 8.1 (Analytianalyti-cal Software, Tallahassee, USA), and analysis of variance (ANOVA) was performed. The graphical results were ex-pressed by using statistical software of origin pro 8.5.0 SRI (Origin lab coopera-tion, Northampton, MA 01060, USA).
4. Results and Discussion
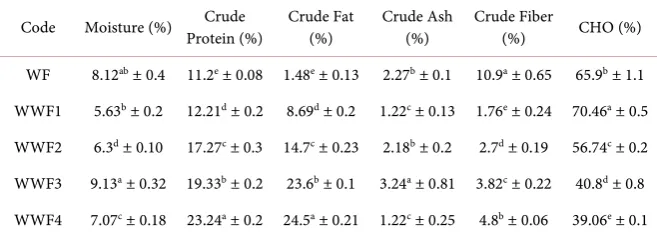
[image:6.595.209.538.579.698.2]Physico-chemical properties: The statistical data of composite flour are pre-sented in Table 1. Moisture content ranged from 5.63% - 9.13%. According to [6] usually moisture content of dried food/flour blends should not be exceeded to 9%. Consider when flour and starch-containing samples having more than 12% moisture content, storage ability will be reduced related to those who have less moisture. Flour and flour-related products overall show longer and safe shelf life with 10% moisture content. The maximum moisture content was witnessed in (WWF3) and significantly differed (p < 0.05) from all other samples. Different food commodities have different properties for retaining moisture which may occur as absorbed or blocked water [18]. Thus the addition of walnut flour with wheat flour reduced the moisture content of the composite flour samples and bind the moisture level. The crude protein content in flour composites were ranged from 11.203% - 23.24% and shows statistically significant result at (p < 0.05). The highest protein content (23.24%) were present in WWF4, whereas the
Table 1. Physico-chemical composition of flour composites.
Code Moisture (%) Protein (%) Crude Crude Fat (%) Crude Ash (%) Crude Fiber (%) CHO (%)
WF 8.12ab ± 0.4 11.2e ± 0.08 1.48e ± 0.13 2.27b ± 0.1 10.9a ± 0.65 65.9b ± 1.1
WWF1 5.63b ± 0.2 12.21d ± 0.2 8.69d ± 0.2 1.22c ± 0.13 1.76e ± 0.24 70.46a ± 0.5
WWF2 6.3d ± 0.10 17.27c ± 0.3 14.7c ± 0.23 2.18b ± 0.2 2.7d ± 0.19 56.74c ± 0.2
WWF3 9.13a ± 0.32 19.33b ± 0.2 23.6b ± 0.1 3.24a ± 0.81 3.82c ± 0.22 40.8d ± 0.8
DOI: 10.4236/fns.2019.107057 782 Food and Nutrition Sciences minimum crude protein content (11.203%) observed in WF. These findings were not surprising because the percentage of protein content in the walnut seed of dry weight basis contain 18% - 24% [19]. According to results finding a more shelf stable product due to lower moisture level while protein content increasing significantly and the objective of flour fortification was achieved [20].
The crude fat content ranged from 1.48% - 24.5%, sample with (WF) flour composite had minimum fat content (1.48%), while the highest fat (24.5%) ob-served in (WWF4). Walnuts have PUFA which helps healthful, the increasing fat content is due to high % of oil in walnut flour. Rancidity due to the presence of oil in walnut and wheat flour composites may cause a problem in storage condi-tion [21]. Therefore, proper storage will be needed to avoid the rancidity factor and retain longer shelf life of food commodities. The ash content within flour composites were ranged from 1.22% - 3.247%. The ash content was increasing with the substitution of walnut powder from 20% - 40%, while ash content was reduced with the addition of 10 percent walnut flour with wheat flour. Sample (WWF3) shows statistically significant result from other samples at (p < 0.05) due to the maximum crude ash content (3.24%), samples (WF and WWF2) were statistically not significant from each other, however, samples (WWF1 and WWF4) also not have any significant difference (p > 0.05) from each other.
The percentage of crude fiber content in flour composites ranged from 1.76 - 10.9%. The highest fiber content was observed in WF (10.9%). Fiber content was decreased surprisingly with 10% fortification of walnut flour, then it tended to improve from 20% to 40% of walnut flour fortification. The results were statisti-cally significant among all samples at 0.05%. The amount of carbohydrate (CHO %) content ranged from 39.06% to 70.46%. The results of carbohydrate content of all 5 samples were statistically significant at (p < 0.05). Sample WWF1 shows the maximum amount of carbohydrate content of 70.46%. The CHO % was correspondingly decreased with the addition of walnut powder into wheat flour. It has been also discussed in the previous study [22] who conclude that carbohydrate reduced while increasing the addition of soybean flour in wheat flour fortification.
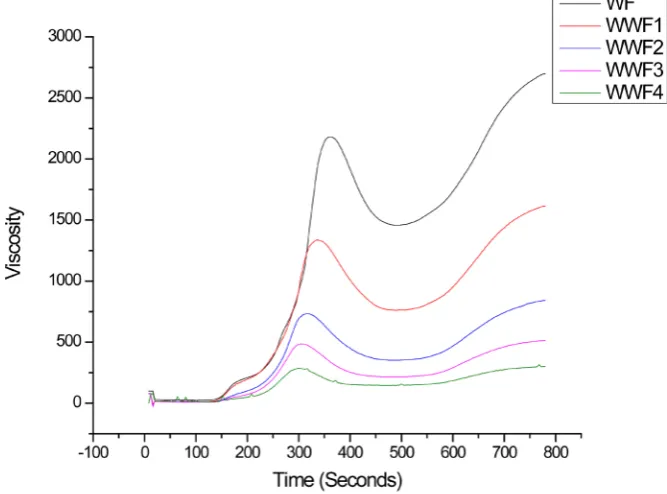
Pasting Properties: The pasting properties are a key factor in predicting the capacity of the flour samples and pasting performance. The results of pasting properties are shown in Table 2 obtained by RVA. The highest values of peak viscosity, trough, breakdown, final viscosity and setback were recorded in WF and lowest in WWF4 followed by WWF3. All values for peak viscosity, trough, breakdown, final viscosity and setback were significantly different from each other at (p ≤ 0.05). According to the results reported pasting parameters were decreased with the increase in addition of walnut flour. The viscosity of all sam-ple was graphically presented against heating time in seconds (Figure 1). Pasting properties disturbing against different composite flours could be due to the dif-ference in starch composition and connection among the structure [23].
DOI: 10.4236/fns.2019.107057 783 Food and Nutrition Sciences
Table 2. Pasting properties of flour samples.
Code PV (cp) Trough (cp) BD (cp) FV (cp) Setback PT (min) PTT (˚C) WF 2118.7a ± 212.4 1472.3a ± 159.1 646.3a ± 82.7 2648a ± 195.4 1175.7a ± 64.5 6.15a ± 0.13 69.26bc ± 0.8
WWF1 1185.7b ± 153 655.3b ± 112.95 530.3b ± 41.4 1423b ± 195.1 767.6b ± 82.5 5.6b ± 0.13 79.56abc ± 8.9
WWF2 765.67c ± 28.18 365.6c ± 13.65 400c ± 18.6 867.3c ± 24 501.6c ± 10.4 5.26c ± 0.06 85.26ab ± 0.9
WWF3 503d ± 18.6 226.3cd ± 11.01 276.6d ± 8.1 544d ± 27.1 317.6d ± 16.4 5.11c ± 0.03 86.95a ± 0.4
WWF4 309.3d ± 23 148.3d ± 4.04 161e ± 19.5 313.3e ± 14.6 165e ± 11 5.06c ± 0.2 67.03c ± 18.1 PV-peak viscosity, BD-breakdown, FV-final viscosity, PT-peak time, PTT-pasting temperature; All values are means ± standard deviation with triplicate determination, Values of each column with different superscript are significant with each other at (p ≤ 0.05).
Figure 1. Comparative impact of heating time on the viscosity of all flour samples.
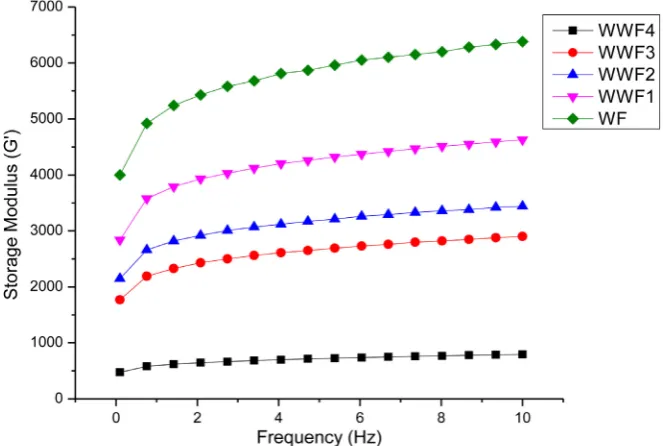
and process-capability of dough for all 5 flour composites was studied. The vari-ations of loss, storage modulus, and tan delta were shown in Figures 2-4 respec-tively. Storage (G') and loss modulus (G") of flour composites were ranged 474 - 6380 and 72.4 - 1410 respectively, however the highest G' and G" was observed in WF followed by WWF1.
[image:8.595.206.540.235.482.2]DOI: 10.4236/fns.2019.107057 784 Food and Nutrition Sciences dough, thereby lack of lubricating agent for interaction resulted in higher sto-rage and loss modulus while lowering the tan delta [24]. According to past agreement [25], starch granules can influence the rheology of dough and flour baking feature.
[image:9.595.207.542.187.420.2]Body weight gain: Animals fed with HF showed maximum weight gain on a weekly basis, whereas decreased with increasing walnut consumption. The re-sults of body weight gain expressed in Table 3. The data were not significantly
Figure 2. Loss modulus (G") values generated during heating of wheat flour and wal-nut/wheat flour fractions.
[image:9.595.207.539.466.689.2]DOI: 10.4236/fns.2019.107057 785 Food and Nutrition Sciences
Figure 4. Tan delta (G"/G') values generated by dividing loss modulus with storage modulus.
Table 3. Animal weekly body weight gain and organ weight after 35 days of trail.
Normal HF HF + 10% walnut HF + 20% walnut HF + 30% walnut HF + 40% walnut Initial Weight (g) 30.5a ± 2.2 32.3a ± 1 31.35a ± 1.7 31.75a ± 0.9 31.19a ± 1.4 31.9a ± 2.1
After first week 6.62a ± 4.7 5.17ab ± 5.4 3.19ab ± 6.1 0.64ab ± 6.7 −3.1b ± 11.4 1.24ab ± 6.8
After second week (%) 13.8a ± 11.7 11.0a ± 5.7 10.2a ± 13.0 4.80a ± 6.9 2.47a ± 13.2 8.87a ± 6.3
After third week (%) 21.55a ± 9.3 19.8a ± 5.7 10.6a ± 18.4 10.34a ± 6.9 8.7a ± 11.69 14.25a ± 5.7
After four week (%) 23.8ab ± 7.6 28.7a ± 4.2 13.4b ± 19.3 14.8b ± 5.16 14.24b ± 9.5 16.7ab ± 6.9
After five week (%) 24.6ab± 11.1 33.7a ± 3.6 22.4ab ± 13.9 21.1ab ± 6.2 20.02b ± 10.3 22.7ab ± 9.7
Liver (g) 1.37b ± 0.1 1.60a ± 0.1 1.5ab ± 0.07 1.5ab ± 0.07 1.41b ± 0.22 1.4ab ± 0.05
Heart (g) 0.19ab.± 0.02 0.21a ± 0.03 0.20ab ± 0.02 0.20ab ± 0.01 0.17b ± 0.01 0.19ab ± 0.03
Kidney (g) 0.45a ± 0.05 0.50a ± 0.05 0.48a ± 0.05 0.47a ± 0.04 0.45a ± 0.03 0.44a ± 0.06
Brain (g) 0.28ab ± 0.03 0.19b ± 0.04 0.30ab ± 0.05 0.31a ± 0.08 0.32a ± 0.13 0.34a ± 0.11
Spleen (g) 0.11a ± 0.02 0.15a ± 0.03 0.14a ± 0.04 0.14a ± 0.03 0.13a ± 0.05 0.10a ± 0.04 Mean ± Standard deviation (n = 6) values with the different superscripts within the row were significant at (p ≤ 0.05).
differed from each other, but the overall group of HF-diet gain more body weight compared to others and showed significantly differed at (p ≤ 0.05). [26] reported that there is no effect in body weight on the basis of short-term walnut consumption. However, in [27] [28] reported that loss in weight could be due to the increasing of walnut consumption.
[image:10.595.58.540.372.578.2]DOI: 10.4236/fns.2019.107057 786 Food and Nutrition Sciences HF-diet along with 30% walnut meal were shown non-significant result. Meanwhile, the animals fed with HF-diet along with 10%, 20% and 40% walnut meal were also non-significant from each other and significantly differed (p ≤ 0.05) from other groups. The present results indicate the liver weight was significantly in-creased with a HF-diet which the agreement of [29] as compared to the animals those who were treated with their normal diet. It can also be observed that the animals fed with HF-diet along with walnut meal were also given the lowest weight of the liver. Heart weight of HF rats was also reported high (0.218 g), however, lowest weight was observed in HF-diet along with 30% walnut meal and showed significant different result (p ≤ 0.05) from all other groups. The re-sults indicate that the weight of liver and heart of HF fed animals decreased with increasing the percentage of walnut meal. It could be due to deposition of lipids especially saturated fatty acids (SFAs) in HF-diet. Whereas no significant differ-ence (p ≤ 0.05) in kidney and spleen weight. The weight of the brain of HF rats was observed less (0.195 g) and highest in 40% walnut consumption (0.346 g) followed by 30% walnut meal (0.326 g). The weight of brain was increased with the increasing the intake of walnut in HF-fed animals. This could be due to the abundant amount of Omega-6 and saturated fats together with unsaturated fatty acids which affect the blood circulation towards the brain and leads to the har-dening of the arteries. It could also increase the risk of an ischemic stroke.
[image:11.595.57.542.536.710.2]Serum lipid profile: TC, LDL-C, TG and HDL-C levels shown in Table 4. TC in animals of HF supplement with 1% cholesterol in the food was higher expec-tedly compared to other groups who fed with walnuts of different composition. Lower levels of TC, LDL-C and TG were observed in animal fed with 40% wal-nut followed by 30% walwal-nut at (p ≤ 0.05). LDL-C and TG showed significant difference (p ≤ 0.05) between the HF and other 5 groups, however, lower values were observed in normal and 40% walnut consumption groups respectively. While HDL-C was increased significantly in 40% walnut fed animals followed by 30% walnut consumption. The subject in the normal group showed low value of
Table 4. Lipid profile of blood serum and liver.
Blood serum (mmol/l) Normal HF HF + 10% walnut HF + 20% walnut HF + 30% walnut HF + 40% walnut LDL-C 0.45b ± 0.09 1.27a ± 1 0.64b ± 0.14 0.62b ± 0.18 0.60b ± 0.09 0.59b ± 0.19
HDL-C 0.97c ± 0.15 1.09c ± 0.19 1.21c ± 0.27 1.40c ± 0.17 2.15b ± 0.64 3.02a ± 0.87
T-CHO 4.10b ± 0.45 6.33a ± 0.84 6.44a ± 0.96 5.93a ± 0.89 4.78b ± 0.58 4.30b ± 0.79
TG 0.75b ± 0.38 1.32a ± 0.19 0.91b ± 0.13 0.83b ± 0.14 0.86b ± 0.16 0.65b ± 0.31
Liver (mmol/mg prot)
LDL-C 2.60b ± 0.7 4.31a ± 1.89 2.40b ± 0.32 1.91b ± 0.24 1.77bc ± 0.17 0.751c ± 0.6
HDL-C 6.34c ± 0.95 6.06c ± 1.46 7.28bc ± 1.11 9.17abc ± 3.2 12.01a ± 3.8 9.87ab ± 2.75
T-CHO 11.67c ± 2.9 20.1a ± 2.56 17.9ab ± 3.3 15.6b ± 0.38 16.8ab ± 4.39 10.6c ± 2.15
DOI: 10.4236/fns.2019.107057 787 Food and Nutrition Sciences HDL-C (p ≤ 0.05) than HF group. Due to a high ratio of alpha-linolenic acid and linoleic acid, it could play a major role in decreasing the LDL-C and lowering the threat of coronary heart diseases.
Liver lipid profile: The statistical data of TC, LDL-C, HDL-C and TG were shown in Table 4. Rats fed with HF-diet observe the highest amount of TC, LDL-C and TG compared to the normal group. The values of TC, LDL-C and TG were decreased with increasing walnut consumption from 10% - 40%. The lowest level of LDL-C was obtained in 40% walnut consumption followed by 30% and showed significant difference from other groups at (p ≤ 0.05). HDL-C levels were not significantly different in normal and HF fed animal, meanwhile animal fed by 30% walnut diet along with HF-diet showed the highest level and the results significantly differed from other groups at (p ≤ 0.05). The present study concludes and meets with the agreement of previous findings that positive effects of walnut ingestion on lipid profile [30] [31]. High levels of TC in HF-diet could be due to high content of saturated fatty acid and seems to be lipid deposi-tion in liver tissue. Excessive lipid deposideposi-tion in the liver leads to the steatosis and source of disproportion in triacylglycerol synthesis in liver and its secretion [32].
[image:12.595.60.539.507.711.2]Total Anti-oxidant Capacity (T-AOC): The T-AOC values of rat’s blood serum, liver and brain tissue has been listed in Table 5. In blood serum and liver, the rats fed with HF along with 40% walnut consumption showed the highest T-AOC, however, the lowest value was observed in HF fed rats and sig-nificant from each other at (p ≤ 0.05). The groups of normal diet and HF-diet along with 10% - 30% walnut consumption were showed significant difference to each other at (p ≤ 0.05), however significant to other groups (HF-diet and 40% walnut consumption). Rats fed with 40% walnut along with HF-diet were also reported a maximum amount of T-AOC in (Serum, Liver and Brain). In conclusion
Table 5. Total anit-oxidant and enzymatic anit-oxidant (SOD and GSH-Px) in blood, liver and brain.
Blood serum Normal HF HF + 10% walnut HF + 20% walnut HF + 30% walnut HF + 40% walnut Total anti-oxidant (mM/l) 0.83ab ± 0.02 0.77c ± 0.04 0.79bc ± 0.04 0.82bc ± 0.005 0.83ab ±.007 0.87a ± 0.06
SOD (U/ml) 56.3bc ± 8.03 50.2c ± 6.2 57.66bc ± 12.1 60.12abc ± 6.3 66.24ab ± 9.9 71.08a ± 6.6
GSH-Px (U) 334.4b ± 44.1 266.6c ± 43 256.9cd ± 36.7 244.6cd ± 39.1 205.8d ± 52.4 399.1a ± 50.2
Liver
Total anti-oxidant (mM/mg protein) 30.1ab ± 3.4 26.8b ± 4.7 29.02ab ± 4.5 28.13ab ± 2.5 30.8ab ± 3.8 33.09a ± 5.6
SOD (U/mg protein) 195.2d ± 44 227.4cd ± 44 292abc ± 82 261bcd ± 42.9 332.9ab ± 67.6 341.3a ± 49
GSH-Px (U) 241d ± 10.4 474.4c ± 22 461.7c ± 25.1 480.8c ± 11 542.3b ± 28 613.6a ± 23.8
Brain
Total anti-oxidant (mM/mg protein) 5.32b ± 1.9 5.64b ± 1.3 6.62ab ± 0.9 6.5ab ± 0.8 6.3ab ± 0.5 7.9a ± 1.7
SOD (U/mg protein) 100.8b ± 20 105.8b ± 31 124.8ab ± 21.1 127.7ab ± 44 133.5ab ± 14.8 164.9a ± 42.2
DOI: 10.4236/fns.2019.107057 788 Food and Nutrition Sciences to the above outcomes indicated that walnut consumption could contribute the anti-oxidant capacity [33] [34] compared to other nuts, walnuts have a good source of polyphenols and the least amount of vitamins E.
Enzyme anti-oxidant activity: SOD and GSH-Px activity of rat blood serum, liver and brain shown in Table 5. Animals fed by HF-diet along with 40% wal-nut consumption SOD activity observed the highest amount (71.08 U/ml, 341.31 U/mg protein, 164.92 U/mg protein) in blood serum, liver and brain. The lowest amount of SOD in blood serum was reported in HF-fed animals, however, liver and brain SOD activity were reduced in the normal fed diet animals followed by HF. GSH-Px of blood serum was observed highest (399.14 U) in 40% walnut consumption along with HF-diet followed by normal group, however, the lowest in 30% walnut consumption. In liver and brain, the lowest GSH-Px activity was reported in normal group of animals (241.01 and 24.03 U) respectively followed by HF group. The maximum amount of GSH-Px activity in liver and brain was observed among the group of 40% walnut consumption (613.65 and 117.48 U) respectively. Meanwhile, the GSH-Px activity in HF, 10% and 20% walnut con-sumption did not show any significant difference to each other at (p ≤ 0.05) in liver sample. The group of (normal and HF) diet animals was also non-significant to each other. In conclusion to the indicated results the enzymatic anti-oxidant (SOD, GSH-Px) activity is increased with increasing walnut consumption in high fat fed animal and lower in HF-fed animals, it could be due to the presence of more free radicals [35]. Enzymatic reactions, SOD converts superoxide anions (
O
2−) to hydrogen peroxide (H2O2), and therefore hydrogen peroxide could bedegraded promptly by catalase and GSH-Px to H2O [36]. In the previous study,
it has been reported that gallic acid leads to a reduction in body weight gain and hepatic oxidative stress by increasing the action of the GSH-Px enzyme that re-claims peroxides in animals of high fat intake [37].
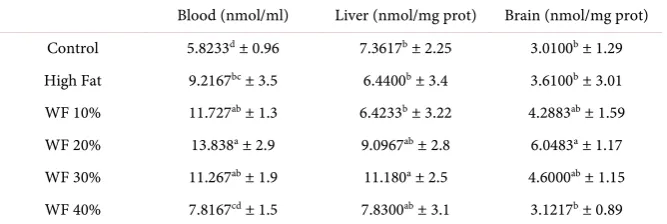
[image:13.595.207.541.587.699.2]Lipid peroxidation: The melondialdehyde (MDA) of blood serum, liver and brain has been articulated in Table 6. In blood serum, MDA content of normal diet group was shown the lowest (5.82 nmol/ml) followed by HF-diet along with 40% consumption and significantly different at (p ≤ 0.05), while highest (13.83 nmol/ml) was in 20% walnut consumption. In the liver, the group of animal fed
Table 6. Lipid peroxidation in blood, liver and brain.
Blood (nmol/ml) Liver (nmol/mg prot) Brain (nmol/mg prot) Control 5.8233d ± 0.96 7.3617b ± 2.25 3.0100b ± 1.29
High Fat 9.2167bc ± 3.5 6.4400b ± 3.4 3.6100b ± 3.01
WF 10% 11.727ab ± 1.3 6.4233b ± 3.22 4.2883ab ± 1.59
WF 20% 13.838a ± 2.9 9.0967ab ± 2.8 6.0483a ± 1.17
WF 30% 11.267ab ± 1.9 11.180a ± 2.5 4.6000ab ± 1.15
DOI: 10.4236/fns.2019.107057 789 Food and Nutrition Sciences by normal, HF and 10% walnut showed lowest MDA content (7.36, 6.44 and 6.42 nmol/mg protein) and have not significant difference, however, the highest MDA content (11.18 nmol/mg protein) was observed in 30% walnut intake. Whereas the maximum (6.04 nmol/mg protein) MDA content in the brain was observed in 20% walnut intake followed by group of 30% walnut intake group (4.6 nmol/mg protein). However the group of normal, HF and 40% walnut in-take animals showd no significant difference to each other and results were ex-pressed as 3.01, 3.6, 3.12 nmol/mg protein respectively. In this present MDA as-say results indicated that lipid peroxidation in normal fed diet and HF-diet have no significant difference and show minimum lipid peroxidation, meanwhile li-pid peroxidation is significantly increased by 10% - 30% walnut intake, but at 40% walnut intake the lipid peroxidation significantly decreased in blood serum, liver and brain of rats. In oxidative stress antioxidant activities and lipid peroxi-dation vital indicator, however, increasing lipid peroxiperoxi-dation could be due to the production of free radicals especially in MUFA [38]. Meanwhile, cell increased the lipid peroxidation due to walnut consumption the animals defends itself against the oxidative stress by elevating the enzymatic antioxidant (SOD, GSH-Px) activity as a safety measure. According to [39] [40], walnut-enriched diet can decrease the MDA concentration.
5. Conclusion
In this present study, the results obtained that the fortification of wheat flour with walnut powder up to 40% walnut substitution could be enriched signifi-cantly with protein and fat content. However, due to maximum fat content, proper storage condition needs to avoid the rancidity. The viscoelastic attributes (G" and G') and pasting properties of flour composites had reduced, however, re-sults still within the range and could be used for product processing up to 40% walnut flour. We have demonstrated that the intake of walnut in a high fed animal could improve the lipid profile by reducing the amount of LDL-C, while HDL-C amount increased. Walnut has unique enzymatic anti-oxidant activity which is useful to improve the oxidative stress such as superoxide dismutase (SOD), gluta-thione peroxidase (GSH-Px) and lipid peroxidation (MDA) by modifying an-ti-oxidant defense system and could prevent the risk of obesity and heart-related diseases. Further studies need to conclude that if the larger amount and longtime walnuts consumption linked with improving lipid profile, oxidative stress and li-pid peroxidation can be sustained for a long time and diminish clinical points.
Acknowledgements
This work was supported by the National High Technology Research and De-velopment Program of China (863 Program) (Grant no. 2013AA102206-2).
Conflicts of Interest
DOI: 10.4236/fns.2019.107057 790 Food and Nutrition Sciences
References
[1] Lajolo, F.M. (2002) Functional Foods: Latin American Perspectives. British Journal of Nutrition, 88, S145-S150. https://doi.org/10.1079/BJN2002679
[2] Chen, Z.Y., Ma, K.Y., Liang, Y., Peng, C. and Zuo, Y. (2011) Role and Classification of Cholesterol-Lowering Functional Foods. Journal of Functional Foods, 3, 61-69.
https://doi.org/10.1016/j.jff.2011.02.003
[3] Davis, L., Stonehouse, W., Mukuddem-Petersen, J., van der Westhuizen, F.H., Ha-nekom, S.M. and Jerling, J.C. (2007) The Effects of High Walnut and Cashew Nut Diets on the Antioxidant Status of Subjects with Metabolic Syndrome. European Journal of Nutrition, 46, 155-164. https://doi.org/10.1007/s00394-007-0647-x
[4] US Food and Drug Administration (2003) Qualified Health Claims: Letter of En-forcement Discretion Nuts and Coronary Heart Disease. US Food and Drug Ad-ministration, Rockville, 1-4.
[5] Mexis, S.F., Badeka, A.V., Riganakos, K.A., Karakostas, K.X. and Kontominas, M.G. (2009) Effect of Packaging and Storage Conditions on Quality of Shelled Walnuts.
Food Control, 20, 743-751. https://doi.org/10.1016/j.foodcont.2008.09.022
[6] Offia-Olua, B.I. (2014) Chemical, Functional and Pasting Properties of Wheat ( Tri-ticumspp)-Walnut (Juglansregia) Flour. Food and Nutrition Sciences, 5, 1591.
https://doi.org/10.4236/fns.2014.516172
[7] Uchida, K. (2000) Role of Reactive Aldehyde in Cardiovascular Diseases. Free Rad-ical Biology and Medicine, 28, 1685-1696.
https://doi.org/10.1016/S0891-5849(00)00226-4
[8] Ceconi, C., Boraso, A., Cargnoni, A. and Ferrari, R. (2003) Oxidative Stress in Car-diovascular Disease: Myth or Fact? Archives of Biochemistry and Biophysics, 420, 217-221. https://doi.org/10.1016/j.abb.2003.06.002
[9] Sohal, R.S., Mockett, R.J. and Orr, W.C. (2002) Mechanisms of Aging: An Appraisal of the Oxidative Stress Hypothesis 1, 2. Free Radical Biology and Medicine, 33, 575-586. https://doi.org/10.1016/S0891-5849(02)00886-9
[10] Hayyan, M., Hashim, M.A. and Alnashef, I.M. (2016) Superoxide Ion: Generation and Chemical Implications. Chemical Reviews, 116, 3029-3085.
https://doi.org/10.1021/acs.chemrev.5b00407
[11] Flores-Mateo, G., Navas-Acien, A., Pastor-Barriuso, R. and Guallar, E. (2006) Sele-nium and Coronary Heart Disease: A Meta-Analysis. The American Journal of Clinical Nutrition, 84, 762-773. https://doi.org/10.1093/ajcn/84.4.762
[12] Iwe, M.O. (2002) Handbook of Sensory Methods and Analysis. Rojoint Communi-cation Services Ltd., Enugu, 7-12.
[13] AOAC (1990) Official Method of Analysis Association of Official Analytical Chem-ists. 15th Edition, AOAC International Publisher, Washington DC.
[14] Ikegwu, O.J., Nwobasi, V.N., Odoh, M.O. and Oledinma, N.U. (2009) Evaluation of the Pasting and Some Functional Properties of Starch Isolated from Some Improved Cassava Varieties in Nigeria. African Journal of Biotechnology, 8, 2310-2315. [15] Xiong, Y.L. (1992) A Comparison of the Rheological Characteristics of Different
Fractions of Chicken Myofibrillar Proteins 1. Journal of Food Biochemistry, 16, 217-227. https://doi.org/10.1111/j.1745-4514.1992.tb00447.x
Associa-DOI: 10.4236/fns.2019.107057 791 Food and Nutrition Sciences tion, 111, 1720-1729. https://doi.org/10.1016/j.jada.2011.08.009
[17] Kuo, K.L., Weng, M.S., Chiang, C.T., Tsai, Y.J., Lin-Shiau, S.Y. and Lin, J.K. (2005) Comparative Studies on the Hypolipidemic and Growth Suppressive Effects of Oo-long, Black, Pu-Erh, and Green Tea Leaves in Rats. Journal of Agricultural and Food Chemistry, 53, 480-489. https://doi.org/10.1021/jf049375k
[18] Eddy, N.O., Udofia, P.G. and Eyo, D. (2007) Sensory Evaluation of Wheat/Cassava Composite Bread and Effect of Label Information on Acceptance and Preference.
African Journal of Biotechnology, 6, 2415-2418.
https://doi.org/10.5897/AJB2007.000-2379
[19] Sze-Tao, K.W.C. and Sathe, S.K. (2000) Walnuts (Juglans regia L.): Proximate Composition, Protein Solubility, Protein Amino Acid Composition and Protein in Vitro Digestibility. Journal of the Science of Food and Agriculture, 80, 1393-1401.
https://doi.org/10.1002/1097-0010(200007)80:9<1393::AID-JSFA653>3.0.CO;2-F
[20] Kolapo, A.L. and Sanni, M.O. (2005) Processing and Characteristics of Soy-bean-Fortified Tapioca. Journal of Women in Technical Education, 4, 59-66. [21] Wallace, H.M. and Walton, D.A. (2011) Macadamia (Macadamia integrifolia,
Ma-cadamia tetraphylla and Hybrids). In: Yahia, E.M., Ed., Postharvest Biology and Technology of Tropical and Subtropical Fruits: Cocona to Mango, Springer, Berlin, 450-474. https://doi.org/10.1533/9780857092885.450
[22] Jimoh, K.O. and Olatidoye, O.P. (2009) Evaluation of Physicochemical and Rheo-logical Characteristics of Soybean Fortified Yam Flour. Journal of Applied Bios-ciences, 13, 703-706.
[23] Radley, J.A. (2012) Examination and Analysis of Starch and Starch Products. Sprin-ger Science & Business Media, Berlin.
[24] Rouillé, J., Della Valle, G., Lefebvre, J. and Sliwinski, E. (2005) Shear and Extension-al Properties of Bread Doughs Affected by Their Minor Components. Journal of Cereal Science, 42, 45-57. https://doi.org/10.1016/j.jcs.2004.12.008
[25] Kurimoto, Y. and Shelton, D.R. (1988) The Effect of Flour Particle Size on Baking Quality and Other Flour Attributes. Cereal Foods World, 38, 429-438.
[26] Banel, D.K. and Hu, F.B. (2009) Effects of Walnut Consumption on Blood Lipids and Other Cardiovascular Risk Factors: A Meta-Analysis and Systematic Review.
The American Journal of Clinical Nutrition, 90, 56-63.
https://doi.org/10.3945/ajcn.2009.27457
[27] Sabaté, J., Cordero-MacIntyre, Z., Siapco, G., Torabian, S. and Haddad, E. (2005) Does Regular Walnut Consumption Lead to Weight Gain? British Journal of Nutri-tion, 94, 859-864. https://doi.org/10.1079/BJN20051567
[28] Garcia-Lorda, P., Rangil, I.M. and Salas-Salvado, J. (2003) Nut Consumption, Body Weight and Insulin Resistance. European Journal of Clinical Nutrition, 57, S8.
https://doi.org/10.1038/sj.ejcn.1601802
[29] Luo, M., Mengos, A.E., Stubblefield, T.M. and Mandarino, L.J. (2012) High Fat Di-et-Induced Changes in Hepatic Protein Abundance in Mice. Journal of Proteomics and Bioinformatics, 5, 60-66. https://doi.org/10.4172/jpb.1000214
[30] Iwamoto, M., Imaizumi, K., Sato, M., Hirooka, Y., Sakai, K., Takeshita, A. and Ko-no, M. (2002) Serum Lipid Profiles in Japanese Women and Men during Consump-tion of Walnuts. European Journal of Clinical Nutrition, 56, 629.
https://doi.org/10.1038/sj.ejcn.1601400
DOI: 10.4236/fns.2019.107057 792 Food and Nutrition Sciences
Cardiovascular Risk Factors. International Journal for Vitamin and Nutrition Re-search, 72, 341-347. https://doi.org/10.1024/0300-9831.72.5.341
[32] Cintra, D.E., Costa, A.V., Maria do Carmo, G.P., Matta, S.L., Silva, M.T.C. and Costa, N.M. (2006) Lipid Profile of Rats Fed High-Fat Diets Based on Flaxseed, Peanut, Trout, or Chicken Skin. Nutrition, 22, 197-205.
https://doi.org/10.1016/j.nut.2005.09.003
[33] Jenkinson, A., Franklin, M.F., Wahle, K. and Duthie, G.G. (1999) Dietary Intakes of Polyunsaturated Fatty Acids and Indices of Oxidative Stress in Human Volunteers.
European Journal of Clinical Nutrition, 53, 523.
https://doi.org/10.1038/sj.ejcn.1600783
[34] Fukuda, T., Ito, H. and Yoshida, T. (2003) Antioxidative Polyphenols from Walnuts (Juglans regia L.). Phytochemistry, 63, 795-801.
https://doi.org/10.1016/S0031-9422(03)00333-9
[35] Rocha, K.K.R., Souza, G.A., Ebaid, G.X., Seiva, F.R.F., Cataneo, A.C. and Novelli, E.L.B. (2009) Resveratrol Toxicity: Effects on Risk Factors for Atherosclerosis and Hepatic Oxidative Stress in Standard and High-Fat Diets. Food and Chemical Tox-icology, 47, 1362-1367. https://doi.org/10.1016/j.fct.2009.03.010
[36] Lee, S.J., Choi, S.K. and Seo, J.S. (2009) Grape Skin Improves Antioxidant Capacity in Rats Fed a High Fat Diet. Nutrition Research and Practice, 3, 279-285.
https://doi.org/10.4162/nrp.2009.3.4.279
[37] Hsu, C.L. and Yen, G.C. (2007) Effect of Gallic Acid on High Fat Diet-Induced Dys-lipidaemia, Hepatosteatosis and Oxidative Stress in Rats. British Journal of Nutri-tion, 98, 727-735. https://doi.org/10.1017/S000711450774686X
[38] Cetinkaya, A., Kurutas, E.B., Buyukbese, M.A., Kantarceken, B. and Bulbuloglu, E. (2005) Levels of Malondialdehyde and Superoxide Dismutase in Subclinical Hyper-thyroidism. Mediators of Inflammation, 2005, 57-59.
https://doi.org/10.1155/MI.2005.57
[39] Canales, A., Benedí, J., Nus, M., Librelotto, J., Sánchez-Montero, J.M. and Sán-chez-Muniz, F.J. (2007) Effect of Walnut-Enriched Restructured Meat in the Anti-oxidant Status of Overweight/Obese Senior Subjects with at Least One Extra CHD-Risk Factor. Journal of the American College of Nutrition, 26, 225-232.
https://doi.org/10.1080/07315724.2007.10719605