doi:10.4236/jbpc.2011.24048
Buffer standards for the physiological pH of the
zwitterionic buffer
3-[N-tris(hydroxymethyl)methylamino]-2-hydroxypropan
esulfonic acid (TAPSO) from (278.15 to 328.15) K
Lakshmi N. Roy, Rabindra N. Roy*, Blake M. Bodendorfer, Zachary M. Downs,
Stephen D. Rocchio, Jessica M. Stegner, Isaac B. Henson
Hoffman Department of Chemistry, Drury University, Springfield, USA; *Corresponding Author: [email protected]
Received 22 June 2011; revised 3 August 2011; accepted 24 August 2011.
ABSTRACT
The second dissociation constant, pK2, and re- lated thermodynamic quantities for TAPSO have been previously determined and reported from the temperatures (278.15 to 328.15) K. In the current study there are five buffer solutions without NaCl and five buffer solutions with NaCl present which yield an ionic strength (I = 0.16 mol·kg–1) similar to that of blood plasma. These buffer solutions have been evaluated in the temperature range of (278.15 to 328.15) K using the extended Debye-Hückel equation, due to the limitations of the Bates-Guggenheim convention such that it is only valid when I 0.1 mol·kg–1. The liquid junction potential (Ej) values between the TAPSO solution and the saturated KCl ca- lomel electrode solution have been estimated at (298.15 and 310.15) K using a flowing junction cell measurement. The previously mentioned Ej values have been used in determining the op-erational pH values at (298.15 and 310.15) K. These TAPSO buffer solutions are recommended as reference solutions for pH measurements in saline media with an ionic strength of I = 0.16 mol·kg–1.
Keywords: Zwitterionic; Buffer; pH; Liquid Junction; Physiological
1. INTRODUCTION
Good and his associates [1,2]have suggested several useful zwitterionic amino acid buffer solutions used in measuring the pH of blood and having the pH constrained so it closely reflects that of the physiological range (pH = 7 - 9). Very recently, the authors have reported the pH
values of 3-(N-morpholino)-2-hydroxypropanesulfonic acid (MOPSO)[3] from (278.15 to 328.15) K, including 310.15 K. The zwitterionic buffer 3-[N,N-bis(2-hydroxy- methyl)amino]-2-hydroxypropanesulfonic acid (DIPSO) [4] is also recommended for physiological use at (278.15 to 328.15) K. Regarding the current experiment the goal of the authors is to provide staunch pH values for the ampholyte 3-[N-tris(hydroxymethyl)-methylamino]-2-hy- droxypropanesulfonic acid (TAPSO) depicted by the foll- owing structure:
This zwitterionic buffer, among others suggested by Bates and coworkers [5,10], may be used as biological buffers for biological media. The currently used NBS certified physiological phosphate primary standard buffer has recorded pH values of 7.415 and 7.395 at (298.15 and 310.15) K, respectively [5]. This phosphate buffer is comprised of KH2PO4 (0.008695 mol·kg–1) and Na2HPO4
(0.03043 mol·kg–1). Though it has been accepted by the NBS, problems still occur when using this particular phosphate buffer.
Some of the disadvantages concerning the phosphate buffer are: 1) phosphates precipitate some polyvalent ca- tions in the blood, such as the constituents Mg2+ and Ca2+; 2) the phosphate may also inhibit or unnecessarily acti- vate enzymatic processes such as some metabolic cycles; and 3) the phosphate buffer’s temperature coefficient (–0.0028 pH unit·K–1) does not accurately approximate that of whole blood (–0.015 pH unit·K–1) [6]. The zwit- terionic buffer compound TAPSO is not expected to yield such adverse effects, but the potential for complex formation with cations such as Mg2+ and Ca2+ does still exist. The likeliness of this occurring has been minimi- zed with a high NaCl: buffer concentration ratio for an isotonic saline solution of I = 0.16 mol·kg–1.
HN
O
O
HO
HO
OH
OH
S
[image:2.595.98.248.84.160.2]OH
Figure 1. 3-[N-tris(hydroxymethyl)methylamino]- 2-hydroxypropanesulfonic acid (TAPSO).
researchers for structurally related zwitterionic buffer compounds and their substituents for comparison of their pH and pK2 values. Wu and associates [7] have published
pH and pK2 values for N-(2-hydroxyethyl)piperazine-N-
2-ethanesulfonic acid (HEPES), another zwitterionic bu- ffer. Wu et al. [8] have also studied MOPSO using two point pH calibration measurements. Roy et al.[9] studied pK2 and pH values of 3-(N-morpholino)propanesulfonic
acid (MOPS) and reported the results in the temperature range of (278.15 to 328.15) K, including 310.15 K. The previously mentioned buffer solutions have yielded a pH similar to common biological media.
The following compositions were examined with solu-tions (a) to (e) lacking the NaCl and solusolu-tions (f) to (j) containing NaCl resulting in an ionic strength of I = 0.16 mol·kg–1:
(a) TAPSO (0.04 mol·kg–1) + NaTAPSO (0.02 mol·kg–1) (b) TAPSO (0.06 mol·kg–1) + NaTAPSO (0.03 mol·kg–1) (c) TAPSO (0.05 mol·kg–1) + NaTAPSO (0.05 mol·kg–1) (d) TAPSO (0.06 mol·kg–1) + NaTAPSO (0.06 mol·kg–1) (e) TAPSO (0.08 mol·kg–1) + NaTAPSO (0.08 mol·kg–1) (f) TAPSO (0.02 mol·kg–1) + NaTAPSO (0.04 mol·kg–1) + NaCl (0.12 mol·kg–1)
(g) TAPSO (0.03 mol·kg–1) + NaTAPSO (0.06 mol·kg–1) + NaCl (0.10 mol·kg–1)
(h) TAPSO (0.04 mol·kg–1) + NaTAPSO (0.02 mol·kg–1) + NaCl (0.14 mol·kg–1)
(i) TAPSO (0.06 mol·kg–1) + NaTAPSO (0.03 mol·kg–1) + NaCl (0.13 mol·kg–1)
(j) TAPSO (0.04 mol·kg–1) + NaTAPSO (0.04 mol·kg–1) + NaCl (0.12 mol·kg–1)
The detailed procedure for preparation of the afore-mentioned TAPSO buffer solutions is described in the Experimental Section below.
2. EXPERIMENTAL
TAPSO was obtained from Research Organics (Cleve- land, Ohio). Further crystallization was used for purifica- tion. This technique and the assay have been previously reported [8]. It was concluded from the assay that the TAPSO used was 99.99% pure. Buffer solutions (a) to (j) were prepared by massing the TAPSO buffer, ACS re- agent grade NaCl, a standard NaOH solution (which al-
lowed the NaTAPSO to be prepared), and finally care- fully calculated amounts of CO2-free doubly distilled
water. Buoyancy corrections were applied to all masses used during the preparation of the solutions.
In previous publications, the cell design and prepara- tion procedures for the chloroplatinic acid, hydrogen ele- ctrodes, purification using hydrogen gas, silver-silver chloride electrodes (of the thermal electrolytic type), and solution preparation have been described [9,12] Details about the equipment (including model numbers) and ex- perimental techniques have also been previously reported [12].
3. METHODS AND RESULTS
The cell voltage values for the paH calculations are
given in Tables 1 and 2 for cell A. Cell A contains five solutions lacking their Cl– component and five solutions with Cl– to give them an ionic strength of I = 0.16 mol·kg–1. The cell voltage values have been corrected to a hydrogen pressure of 101.325 kPa. At (298.15) K, cell voltage values are averaged from readings taken once at each portion of the reading (the beginning, middle, and end). Duplicate cells gave readings of ±0.04 mV on av-erage in the temperature range under study.
3.1. pH of the TAPSO Buffer
The Bates et al. [10,11,16-18] method has been used to evaluate the conventional standard pH values for solu- tions (a) to (j) described in the Introduction. For accurate calculations of the ten buffer solutions, the following cell A was used for the collection of cell potential data:
Pt(s), H2(g), 101.325 kPa | TAPSO (m1) +
NaTAPSO (m2) + NaCl (m3) | AgCl(s), Ag(s) (A)
where m1,m2 and m3 denote the molalities of the respec-
tive species at 1 atm = 101.325 kPa in SI units. Cell A is known as the Harned-type cell.
3.2. Evaluation of Liquid Junction Potential
Cell B, the flowing junction cell, was used to evaluate the liquid junction potential at the contact point between the buffer solution and the heavier, saturated KCl solu- tion shown with a double vertical line as follows:
Pt(s), H2(g), 101.325 kPa | TAPSO (m1) + NaTAPSO
(m2) + NaCl (m3) || KCl(satd), Hg2Cl2(s), Hg(l) (B)
where the abbreviations “s,” “l,” and “g” indicate the solid, liquid, and gaseous states, respectively. In routine laboratory measurements, a glass electrode commonly replaces the hydrogen electrode. For cell B, the values of the standard electrode potential, denoted as SCE, of the
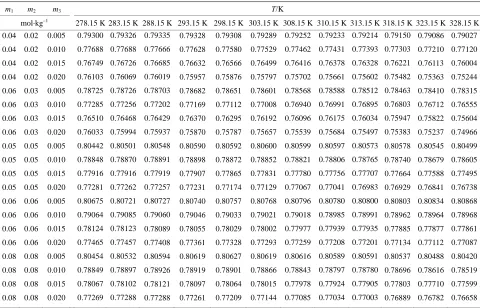
Table 1. Cell potential of cell A (in volts): Pt(s); H2(g), 101.325 kPa | TAPSO (m1), NaTAPSO (m2), NaCl (m3) | AgCl(s), Ag(s).
m1 m2 m3 T/K
mol·kg–1 278.15 K 283.15 K 288.15 K 293.15 K 298.15 K 303.15 K 308.15 K 310.15 K 313.15 K 318.15 K 323.15 K 328.15 K
[image:3.595.58.538.95.403.2]0.04 0.04 0.04 0.04 0.06 0.06 0.06 0.06 0.05 0.05 0.05 0.05 0.06 0.06 0.06 0.06 0.08 0.08 0.08 0.08 0.02 0.02 0.02 0.02 0.03 0.03 0.03 0.03 0.05 0.05 0.05 0.05 0.06 0.06 0.06 0.06 0.08 0.08 0.08 0.08 0.005 0.010 0.015 0.020 0.005 0.010 0.015 0.020 0.005 0.010 0.015 0.020 0.005 0.010 0.015 0.020 0.005 0.010 0.015 0.020 0.79300 0.77688 0.76749 0.76103 0.78725 0.77285 0.76510 0.76033 0.80442 0.78848 0.77916 0.77281 0.80675 0.79064 0.78124 0.77465 0.80454 0.78849 0.78067 0.77269 0.79326 0.77688 0.76726 0.76069 0.78726 0.77256 0.76468 0.75994 0.80501 0.78870 0.77916 0.77262 0.80721 0.79085 0.78123 0.77457 0.80532 0.78897 0.78102 0.77288 0.79335 0.77666 0.76685 0.76019 0.78703 0.77202 0.76429 0.75937 0.80548 0.78891 0.77919 0.77257 0.80727 0.79060 0.78089 0.77408 0.80594 0.78926 0.78121 0.77288 0.79328 0.77628 0.76632 0.75957 0.78682 0.77169 0.76370 0.75870 0.80590 0.78898 0.77907 0.77231 0.80740 0.79046 0.78055 0.77361 0.80619 0.78919 0.78097 0.77261 0.79308 0.77580 0.76566 0.75876 0.78651 0.77112 0.76295 0.75787 0.80592 0.78872 0.77865 0.77174 0.80757 0.79033 0.78029 0.77328 0.80627 0.78901 0.78064 0.77209 0.79289 0.77529 0.76499 0.75797 0.78601 0.77008 0.76192 0.75657 0.80600 0.78852 0.77831 0.77129 0.80768 0.79021 0.78002 0.77293 0.80619 0.78866 0.78015 0.77144 0.79252 0.77462 0.76416 0.75702 0.78568 0.76940 0.76096 0.75539 0.80599 0.78821 0.77780 0.77067 0.80796 0.79018 0.77977 0.77259 0.80616 0.78843 0.77978 0.77085 0.79233 0.77431 0.76378 0.75661 0.78588 0.76991 0.76175 0.75684 0.80597 0.78806 0.77756 0.77041 0.80780 0.78985 0.77939 0.77208 0.80589 0.78797 0.77924 0.77034 0.79214 0.77393 0.76328 0.75602 0.78512 0.76895 0.76034 0.75497 0.80573 0.78765 0.77707 0.76983 0.80800 0.78991 0.77935 0.77201 0.80591 0.78780 0.77905 0.77003 0.79150 0.77303 0.76221 0.75482 0.78463 0.76803 0.75947 0.75383 0.80578 0.78740 0.77664 0.76929 0.80803 0.78962 0.77885 0.77134 0.80537 0.78696 0.77803 0.76889 0.79086 0.77210 0.76113 0.75363 0.78410 0.76712 0.75822 0.75237 0.80545 0.78679 0.77588 0.76841 0.80834 0.78964 0.77877 0.77112 0.80488 0.78616 0.77710 0.76782 0.79027 0.77120 0.76004 0.75244 0.78315 0.76555 0.75604 0.74966 0.80499 0.78605 0.77495 0.76738 0.80868 0.78968 0.77861 0.77087 0.80420 0.78519 0.77599 0.76658
Table 2. Cell potential of cell A (in volts): Pt(s); H2(g), 101.325 kPa | TAPSO (m1), NaTAPSO (m2), NaCl (m3) | AgCl(s), Ag(s).
m1 m2 m3 T/K
mol·kg–1 278.15 K 283.15 K 288.15 K 293.15 K 298.15 K 303.15 K 308.15 K 310.15 K 313.15 K 318.15 K 323.15 K 328.15 K
0.02 0.03 0.04 0.06 0.04 0.04 0.06 0.02 0.03 0.04 0.12 0.10 0.14 0.13 0.12 0.75257 0.75278 0.71657 0.71759 0.73711 0.75197 0.75239 0.71536 0.71639 0.73637 0.75126 0.75184 0.71421 0.71530 0.73554 0.75044 0.75091 0.71291 0.71381 0.73443 0.74949 0.75017 0.71104 0.71221 0.73318 0.74843 0.74912 0.70929 0.71053 0.73192 0.74722 0.74824 0.70743 0.70870 0.73058 0.74676 0.74785 0.70656 0.70802 0.73003 0.74601 0.74689 0.70533 0.70687 0.72912 0.74465 0.74576 0.70336 0.70466 0.72746 0.74313 0.74428 0.70121 0.70263 0.72577 0.74157 0.74273 0.69912 0.70061 0.72400
3.4. Application of Liquid Junction Corrections
and –0.2335 V at (298.15 and 310.15) K, respectively. These values are periodically confirmed through experi- mentation.
The
E
SCE values of the saturated calomel electrode were recorded as –0.2415 and –0.2335 at (298.15 and 310.15) K, respectively [8,9]. The Ej values were alsoobtained by use of the flowing junction cell [9]. The Ej
values of the standard buffer solution, as well as others in cell B, were calculated using the following equation: 3.3. Application in Physiological Media
For cell C, the phosphate salts were NBS standard ref- erence materials whose compositions were mentioned in the Introduction. Its solutions are recommended for pH measurements in physiological media. Cell C’s cell dia-
gram is as follows: Ej = E + ESCE – kpH (1)
where k = 0.059156 and pH = 7.415 at (298.15) K and k = 0.061538 and pH = 7.395 at (310.15) K. The pH inputs are that of the standard phosphate buffer solution. The Pt(s), H2(g), 101.325 kPa | KH2PO4 + Na2HPO4 ||
operational definition of pH, denoted as pH(x), can be calculated by use of the subsequent equation:
pH x = pH s Ex Es E
k
j
(2)
where the subscript “x” refers to the unknown buffer (in this case, a solution of TAPSO + NaTAPSO), “s” is the NBS standard buffer solution of a known pH, and δEj = Ej(s) –Ej(x). The Ej value is of interest rather than the
ac-tual Ej value in mV.
To calculate the paH values for the buffer solutions
under investigation, the acidity function was calculated, denoted as p(aHCl), in the temperature range of (278.15
to 328.15) K. These calculations were made using the cell voltage (E) values listed in Tables 1 and 2, the mo- lality of the chloride ion, and the standard electrode po- tential of the silver-silver chloride electrode (E˚). The tool used to calculate p(aHCl), the Nernst equation [11,
12], is shown below:
H Cl Cl
p(a ) E E log
k
m (3)
where “k” is the Nernst slope.
3.5. Plotting of Results
When plotting p(aHCl) against the molality of the
chloride ion, linear regression analysis is used to deter-mine the y-intercept to give a p(aHCl)˚ value at mCl = 0.
These p(aHCl)˚ values for the five chloride-free buffer
solutions are listed in Table 3. The mean deviation from this linear regression technique was approximately 0.002 from the lines generated. The p(aHCl) values for the
buffer solutions containing Cl– are listed in Table 4 from (278.15 to 328.15) K.
3.6. Calculation of pH Results
Conventional paH values for solutions without a liquid
junction and a chloride ion were determined using the following equation:
H Cl Cl
paH p(a )log (4) where the single-ion activity coefficient, Cl
, cannot be experimentally measured. A previous publication de-scribes the method used for obtaining this figure [9]. The pH values obtained from the liquid junction cell are in-dicated by pH whereas the “conventional” pH, calculated from Eq.5, is denoted as paH. The “pH convention,”
commonly known as the Bates-Guggenheim convention [17] is expressed by the use of the successive equation:
Cl
log
1 1.5
A I I
(5)
The International Union of Pure and Applied Chemis-
try has recommended this convention. Eq.5 is assumed to be true for concentrations I < 0.1 mol·kg–1. For I > 0.1 mol·kg–1, there is no widely accepted convention. A more logical choice for solutions with I > 0.01 mol·kg–1 may need to include a linear-dependent “CI” term from Eq.6
with the ion size parameter as a function of temperature. Due to this need for alteration, a pH convention [7,9] based on an extended version of the Debye-Hückel equa-tion [7] has been selected as a more logical approach to calculate logCl
when (0.1 < I < 1.0) mol·kg–1 for all of the buffer solutions containing Cl–. This equation is shown below:
Cl
log
1
A I CI Ba I
(6)
where “I” is the ionic strength of the buffer solution, “A”
and “B” are slope parameters known as the Debye-
Hückel constants, and “C” is an adjustable parameter whose explanation will follow shortly. Ba˚ was assumed to be 1.38 kg1/2·mol–1/2 for all the experimental tempera- tures. This corresponded to an ion size parameter, a˚, of 4.2 Å [7,9]. The empirical equation that follows is used for the calculation of the adjustable parameter “C” and was obtained from a curve-fitting method [7,9].
4 298.15
2 6
6.2 10 298.15
8.7 10 298.15
C C T
T
(7)
where C298.15 = 0.032 kg·mol–1 at (298.15) K [7] and T is
the absolute temperature in Kelvin.
The paH values listed in Table 5 for the five TAPSO
buffer solutions without the presence of Cl– were calcu- lated using the following equations with their respective solution denotations:
(a)
2 H
2 5
p 7.280 2.23 10 298.15
8.32 10 298.15
a T
T
(8)
(b)
2 H
2 4
p 7.125 2.24 10 298.15
1.02 10 298.15
a T
T
(9)
(c)
2 H
2 5
p 7.471 2.19 10 298.15
7.92 10 298.15
a T
T
(10)
(d)
2 H
2 4
p 7.493 2.20 10 298.15
1.15 10 298.15
a T
T
(11)
(e)
2 H
2 5
p 7.460 2.21 10 298.15
6.51 10 298.15
a T
T
(12)
for the temperature range of (278.15 to 328.15) K. The standard deviations of regression for the paH of the
27 .15 K to 328.15 K obtained by extrapolation for chloride-free
T/K
0.04 m TAPSO +
[image:5.595.56.540.108.304.2]0.06 m TAPSO + 0.03 m 0.05 m TAPSO + 0.05 m 0.06 m TAPSO + 0.06 m 0.08 m TAPSO +
Table 3. p(aHγCl)° of (TAPSO + NaTAPSO) buffer solutions from 8
solutions.
0.02 m NaTAPSO
I = 0.02 m
NaTAPSO
I = 0.03 m
NaTAPSO
I = 0.05 m
NaTAPSO
I = 0.06 m
0.08 m NaTAPSO
I = 0.08 m 278.15
283.15
288.15
293.15
298.15
303.15
308.15
310.15
313.15
318.15
323.15
328.15
7.818
7.692
7.570
7.451
7.338
7.231
7.126
7.085
7.027
6.930
6.836
6.748
7.684
7.554
7.426
7.309
7.196
7.085
6.985
6.943
6.883
6.789
6.702
6.617
8.024
7.901
7.781
7.669
7.556
7.449
7.347
7.307
7.246
7.156
7.064
6.974
8.069
7.942
7.814
7.696
7.584
7.477
7.379
7.338
7.283
7.193
7.110
7.032
8.027
7.906
7.790
7.673
7.561
7.452
7.350
7.306
7.248
7.149
7.055
6.962
[image:5.595.55.539.341.499.2]am = 1 .
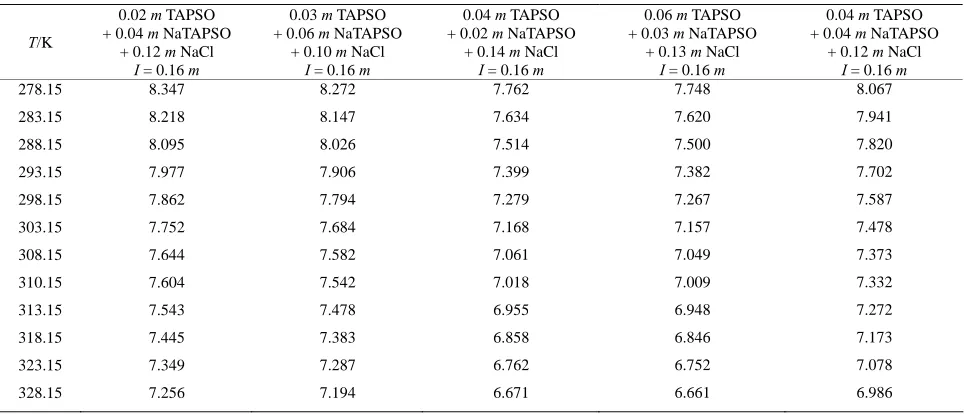
able 4. p(aHγCl) of (TAPSO + NaTAPSO) buffer solutions from 278.15 K to 328.15 K, computed using Eq.4a.
+ + + +
0.04 m TAPSO +
mol·kg–1
T
T/K 0.02 m TAPSO 0.03 m TAPSO 0.04 m TAPSO 0.06 m TAPSO
0.04 m NaTAPSO + 0.12 m NaCl
I = 0.16 m
0.06 m NaTAPSO + 0.10 m NaCl
I = 0.16 m
0.02 m NaTAPSO + 0.14 m NaCl
I = 0.16 m
0.03 m NaTAPSO + 0.13 m NaCl
I = 0.16 m
0.04 m NaTAPSO + 0.12 m NaCl
I = 0.16 m
278.15 283.15 288.15 293.15 298.15 303.15 308.15 310.15 313.15 318.15 323.15 328.15
8.473 8.344 8.220 8.102 7.989 7.879 7.772 7.732 7.671 7.574 7.479 7.387
8.397 8.272 8.151 8.031 7.921 7.811 7.710 7.670 7.606 7.513 7.418 7.326
7.887 7.759 7.640 7.524 7.406 7.295 7.188 7.146 7.084 6.987 6.892 6.802
7.873 7.745 7.626 7.507 7.393 7.284 7.177 7.137 7.076 6.975 6.882 6.793
8.192 8.066 7.945 7.827 7.713 7.605 7.500 7.460 7.400 7.302 7.208 7.117 am
g–1.
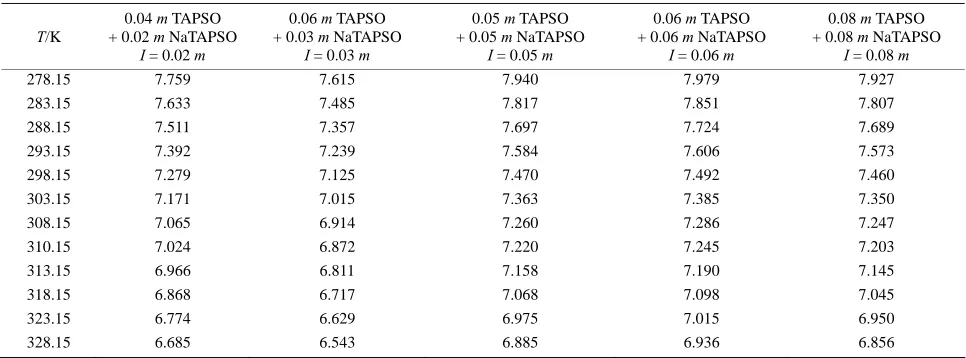
able 5. paH of (TAPSO + NaTAPSO) buffer solutions from 278.15 K to 328.15 K, computed using Eqs.4-7a.
T/K + + + +
0.08 m TAPSO +
= 1 mol·k
T
0.04 m TAPSO 0.06 m TAPSO 0.05 m TAPSO 0.06 m TAPSO 0.02 m NaTAPSO
I = 0.02 m
0.03 m NaTAPSO
I = 0.03 m
0.05 m NaTAPSO
I = 0.05 m
0.06 m NaTAPSO
I = 0.06 m
0.08 m NaTAPSO
I = 0.08 m
278.15 283.15 288.15 293.15 298.15 303.15 308.15 310.15 313.15 318.15 323.15 328.15
7.759 7.633 7.511 7.392 7.279 7.171 7.065 7.024 6.966 6.868 6.774 6.685
7.615 7.485 7.357 7.239 7.125 7.015 6.914 6.872 6.811 6.717 6.629 6.543
7.940 7.817 7.697 7.584 7.470 7.363 7.260 7.220 7.158 7.068 6.975 6.885
7.979 7.851 7.724 7.606 7.492 7.385 7.286 7.245 7.190 7.098 7.015 6.936
7.927 7.807 7.689 7.573 7.460 7.350 7.247 7.203 7.145 7.045 6.950 6.856
[image:5.595.56.539.530.709.2].3-7. These standard deviations are 0.0009,
with an is
(a) it using Eqs
f
0.0014, 0.0016, 0.0012 and 0.0012, respectively. For the five buffer solutions containing Cl–,
otonic saline media ionic strength of I = 0.16 mol·kg–1, the paH values were also calculated using Eqs.3-7. The
acidity function data from Table 4 was also used to gen-erate the paH data residing in Table 6. These values of
paH are expressed by use of the following equations:
2
H
5
2pa 7.863 2.26 10 T298.15
7.94 10 T 298.15
(13)
(b)
2 H
2 5
p 7.795 2.22 10 298.15
7.61 10 298.15
a
T
T
(14)
(c)
2 H
2 5
p 7.279 2.26 10 298.15
7.64 10 298.15
a
T
T
(15)
(d)
2 H
2 5
p 7.267 2.25 10 298.15
7.59 10 298.15
a
T
T
(16)
(e)
2 H
2 5
p 7.588 2.24 10 298.15
7.76 10 298.15
a
T
T
(17)
The observed standard deviations of regression from
E
SION
alues at (298.15 and 310.15) K w
and C) using the flowing junction cell [7,9]. The cell
qs.13-17 are 0.0012, 0.0019, 0.0019, 0.0011 and 0.0010, respectively.
4. DISCUS
The operational pH v
ere evaluated from cells with a liquid junction (cells B
voltage values of cells B and C at (298.15 and 310.15) K are given in Table 7. The values of Ej listed in Table 8
were obtained using Eq.1. The widely used equation for the calculation of logCl
is based on the Bates-Gug- genheim convention [3 ,10] and is valid for concen-trations of I <
,6,7
0.1 mol·kg–1. The total standard uncer-tainty for the paH values was accounted for by combining
various known sources of error: 1) extrapolation of the p(aHCl)˚ plot for Cl– free solutions (error is <±0.002 pH
unit); 2) assumption for the calculation of logCl
using
Eq.6 (error of ±0.004 pH unit); and 3) th in the experimental measurement from the multimeter (an error of ±0.02 mV). This yields an overall error of ±0.012 pH and ±0.006 pH unit for buffer solutions with and without the presence of Cl–, respectively. Errors in values of Ej
are irrelevant to the values of paH determined from cell A
without liquid junction; however, Ej of Eq.2 does affect
the operational paH values listed in Table 9 at (298.15
and 310.15) K.
5. CONCLUSIONS
e error
s listed in Tables 7-9 are rec-om
the National Institutes
H 15 to 328
T/K + 0. + 0. + 0. + 0.
0.04 m TAPSO + 0.
The four buffer solution
mended as useful secondary pH standards for cali-brating electrodes for pH measuring assembly in the physiological range. The consistency of the three sets of experiments listed in Table 9 leads credibility to the pH values of these TAPSO buffer solutions as primary stan-dards for physiological use.
6. ACKNOWLEDGEMENTS
[image:6.595.57.539.502.709.2]The authors are grateful for the funding from
able 6. pa of (TAPSO + NaTAPSO) buffer solutions from 278.
T .15 K, computed using Eqs.4-7a.
0.02 m TAPSO 0.03 m TAPSO 0.04 m TAPSO 0.06 m TAPSO 04 m NaTAPSO
+ 0.12 m NaCl
I = 0.16 m
06 m NaTAPSO + 0.10 m NaCl
I = 0.16 m
02 m NaTAPSO + 0.14 m NaCl
I = 0.16 m
03 m NaTAPSO + 0.13 m NaCl
I = 0.16 m
04 m NaTAPSO + 0.12 m NaCl
I = 0.16 m
278.15
283.15
288.15
293.15
298.15
303.15
308.15
310.15
313.15
318.15
323.15
328.15
8.347
8.218
8.095
7.977
7.862
7.752
7.644
7.604
7.543
7.445
7.349
7.256
8.272
8.147
8.026
7.906
7.794
7.684
7.582
7.542
7.478
7.383
7.287
7.194
7.762
7.634
7.514
7.399
7.279
7.168
7.061
7.018
6.955
6.858
6.762
6.671
7.748
7.620
7.500
7.382
7.267
7.157
7.049
7.009
6.948
6.846
6.752
6.661
8.067
7.941
7.820
7.702
7.587
7.478
7.373
7.332
7.272
7.173
7.078
6.986
am
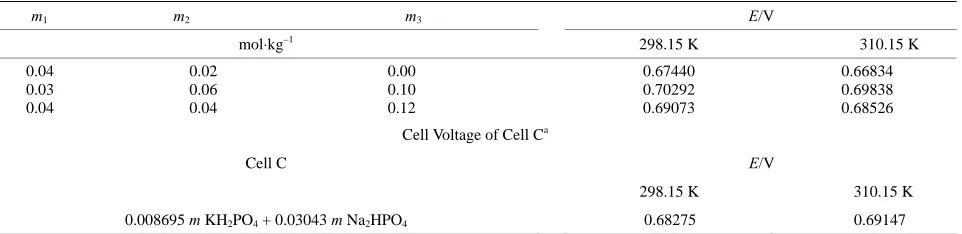
Ta ell voltag l B for TAPSO b
[image:7.595.60.541.95.212.2]m1 m2 m3 E/V
ble 7. C e of cel uffer.
mol·kg–1 298.15 K 310.15 K
0.04 0.03
0.02 0.06 0.04
0.00 0.10 0.12
0.67440 0.70292 0.69073
0.66834 0.69838 0.68526 0.04
Cell Voltage of Cell Ca
Cell C
0.008695 2PO4 + 0.03043 m Na2H
E/V
298.15 K 310.15 K
m KH PO4 0.68275 0.69147
[image:7.595.53.551.388.463.2]aCor hydrogen pressu 01.325 kPa for physiologic hate buffer solutions (primary refe rd buffer) at 298.15 15 K.
Table 8. Values of the liquid junction potentials for TAP nd 310.15) K.
/mV
rected to a re of 1 al phosp rence standa K and 310.
SO buffer at (298.15 a
a j E
Sys
310. tem
298.15 K 15 K
Physiological phos 03043 m NaCl)
0.03 m TAPSO + 0.06 m NaTAPSO + 0.10 m NaCl 0.4 .4
2.
0.8 0.6 phate (0.008695 m KH PO + 0.2 4
0.04 m TAPSO + 0.02 m NaTAPSO + 0.00 m NaCl 2.3 2.6
0.04 m TAPSO + 0.04 m NaTAPSO + 0.12 m NaCl 0
2.6 9
aE
j = E + k˚pH from Eq.1 is the Emf from Table 7, k = Nernst slope with values 0.059156 at 298.15 K, and 0.061538 a ; the pH of the pri-mary refe ndard phosphate buffer is 7. 7.395 at 298.15 K and 310.15 K, respectively; e potential of the lomel
elec-trode = –0. –1.
Table 9. Values of solutions.
Cell B K 310.15 K
SCE
E
–
rence sta
2415 a
t 310.15 K
415 and ESCE
= electrod saturated ca
nd –0.2335 at 298.15 K and 310.15 K, respectively; units of m, mol·kg
pH at (298.15 and 310.15) K for TAPSO buffer
298.15
m1 m2 m3
mol·kg–1
I WithoutaE j
corr With
bE
j corr Calcc WithoutaEj corr WithbEj corr Calcc
0.04 0.02 0.00 0.04 7.274 7.279
0.03 0.04
0.06 0.04
0.10 0.12
0.16 0.16
7.756 7.550
7.794 7.587
7.279 7.794 7.587
7.019 7.507 7.294
7.024 7.541 7.331
7.024 7.542 7.332
a
Values obtaine .2 and data in Table 7; bObtained from Eq.2 a in Table 8; cObtained om Tables 5 and 6.
of Health (A der the grant 2-R15 GM 0 d th
ver rant 3 GM 066866-03 S1. thors would
also like to thank Josie Y d Rhode Doriscar f dedicatio and hard work. onten s paper is the sole responsibility of th
/bi00866a011
d from Eq nd Ej values fr
REA), un m
66866-03 an e di-
sity supple ental g -R15 The au
ost an or their n
The c t of thi e
authors and does not necessarily represent the official views of the ational Institutes of Health or the National Institutes of General N
Medical Sciences.
REFERENCES
[1] Good, N.E., Winget, G.D., Winter, W., Connolly, T.N., Izawa, S. and Singh, R.M.M. (1966) Hydrogen ion buff-ers for biological research. Biochemistry, 5, 467-477.
doi:10.1021
[2] Ferguson, W.J., Braunschweiger, K.L., Braunschweiger, McCormick, J.J., Wasman, C.C., Jarvis nd Good, N.E. (1980) Hydrogen ion
, M.S., Wollen, J.T., Stegner,
J.M., Allen, .A Bu
an-dards for the biochemical pH of 3-(N -morpholino)-2-hy-dr panesulfoni from ( to 32 Journal of Chemical D , 1860
doi:10.1021/je80098
, W.R., Smith, J.R.,
N.P., Bell, D.H. a
buffers for biological research. Analytical Chemistry, 104, 300-310.
[3] Roy, L.N., Roy, R.N., Denton, C.E., LeNoue, S.R., Roy, C.N., Ashkenazi, S., Fuge
K . and Harmon, M.A. (2009) ffer st
oxypro c acid 278.15 8.15) K. Engineering ata, 54 -1864.
3y
[4] Roy, L.N., Roy, R.N., LeNoue, S.R., Denton, C.E., Fuge, M.S., Dunseth, C.D., Roy, C.N., Hayden, S.M., Wollen, J.T. and Sreepada, K. (2009) Buffer standards for the physiological pH of the zwitterionic compound, DIPSO, from 5˚C to 55˚C. Journal of Solution Chemistry, 38, 459-469. doi:10.1007/s10953-009-9379-2
[5] Bower, V.E., Paabo, M. and Bates, R.G. (1961) A standard
d Wu, Y.C. (1989) Second disso-for the measurement of the pH of blood and other phy- siological media. Journal of Research of the National Bureau of Standards, A65, 267-270.
[6] Durst, R.A. and Staples, B.R. (1972) Tris/Tris HCl: Stan-dard buffer for use in the physiological pH range. Clini- cal Chemistry, 18, 206-208.
[7] Feng, D., Koch, W.F. an
doi:10.1021/ac00188a019
[8] Wu, Y.C., Berezansky, P.A., Feng, D. and Koch, W.F. (1993) Second dissociation constant of 3-(N-morpholino) -2-hydroxypropanesulfonic acid and pH of its buffer so-lutions. Analytical Chemistry, 65, 1084-1087.
doi:10.1021/ac00056a023
[9] Roy, R.N., Mrad, D.R., Lord, P.A., Carlsten, J.A., Good,
for pH of 3-(N-morpholino) W.S., Allsup, P., Roy, L.N., Kuhler, K.M., Koch, W.F. and Wu, Y.C. (1998) Thermodynamics of the second dissocia-tion constant and standards
propanesulfonic acid (MOPS) from 5˚C to 55˚C. Journal of Solution Chemistry, 27, 73-87.
doi:10.1023/A:1022692629289
[10] Bates, R.G., Vega, C.A. and White, D.R. (1978) Standards for pH measurements in isotonic saline media of ionic strength I = 0.16. Analytical Chemistry, 50, 1295-1300.
doi:10.1021/ac50031a026
[11] Bates, R.G. (1973) Determination of pH. Wiley, New York.
[12] Roy, R.N., Roy, L.N., Denton, C.E., LeNoue, S.R.,
Ash-e]
, Wollen, J.T.,
Dun-kenazi, S., Fuge, M.S., Dunseth, C.D., Durden, J.L., Roy, C.N., Bwashi, A., Wollen, J.T. and De Armon, S.J. (2009) Buffer standards for the physiological pH of 3-[(1,1-di-methyl-2-hydroxmethyl)amino]-2-hydroxypropanesulfoni c acid from 278.15 K to 328.15 K. Journal of Chemical Engineering Data, 54, 428-435. [Part of the Special “Robin H. Stokes Festschrift” Issu
[13] Roy, R.N., Roy, L.N., Denton, C.E., LeNoue, S.R., Roy,
C.N., Ashkenazi, S., Williams, T.R., Church, D.R., Fuge, M.S. and Sreepada, K.N. (2006) Second dissociation constant of bis[(2-hydroxyethyl)amino]acetic acid (BI-CINE) and pH of its buffer solutions from 5˚C to 55˚C. Journal of Solution Chemistry, 35, 306-627.
[14] Roy, R.N., Roy, L.N., Ashkenazi, S.
seth, C.D., Fuge, M.S., Roy, C.N., Hughes, H.M., Morris, B.T. and Cline, K.L. (2009) Buffer standards for pH measurement of N-(2-hydroxyethyl)piperazine-N’-2-eth- anesulfonic acid (HEPES) for I = 0.16 mol·kg–1 from 5˚C to 55˚C. Journal of Solution Chemistry, 38, 449-458.
doi:10.1007/s10953-009-9378-3
[15] Latimer, W.M. (1952) Oxidation potentials. 2nd Edition, Prentice-Hall, New York.
[16] Vega, C.A. and Bates, R.G. (1976) Buffers for the physiological pH range: Thermodynamic constants of four substituted aminoethanesulfonic acid from 5˚C to 55˚C. Analytical Chemistry, 45, 1663-1666.
[17] Bates, R.G., Roy, T.N. and Robinson, R.A. (1973) Buffer
ge pH 7.2 to 8.5. Analytical standards of tris(hydroxymethyl) methylglycine (“Tricine”) for the physiological ran
Chemistry, 45, 1663-1666.
doi:10.1021/ac60331a022
[18] Bates, R.G. and Guggenheim, E.A. (1960) Report on the standardization of pH and related terminology. Pure and Applied Chemistry, 1, 163-168.
![Figure 1. 3-[N-tris(hydroxymethyl)methylamino]- 2-hydroxypropanesulfonic acid (TAPSO)](https://thumb-us.123doks.com/thumbv2/123dok_us/9227426.409925/2.595.98.248.84.160/figure-n-tris-hydroxymethyl-methylamino-hydroxypropanesulfonic-acid-tapso.webp)