ISSN Print: 2164-3164
DOI: 10.4236/ojce.2018.84037 Dec. 25, 2018 524 Open Journal of Civil Engineering
An Evaluation of the Water Absorption and
Density Properties of Expanded Polystyrene
Sanded Concrete
Johnson C. Abah
1*, Emmanuel E. Ndububa
2, Elias O. Ikpe
21Department of Civil Engineering, Federal Polytechnic, Kaura-Namoda, Nigeria 2Department of Civil Engineering, University of Abuja, Abuja, Nigeria
Abstract
In this paper, the evaluation of the mechanical and hygro-thermal properties of expanded polystyrene-sanded lightweight concrete (EPSLC) was ex-amined. Evaluated are the mechanical properties in terms of density; and the hygro-thermal property using water absorption (capillary absorption and total immersion) as measures. The research used 30% volume of EPS to replace natural coarse aggregate to produce a lightweight concrete, which is expected to be economical, serviceable and meet the required standards for lightweight concretes. The concrete bulk and oven dry densities were ob-tained as 1789 KN/m3 and 1674 kg/m3 respectively, while the total water and capillary water absorption increases with time of suction. The high rate of water absorption at the early periods of the test has corresponding capillary coefficient of steep slope within the same period. The relationship between the variables Q the water absorption per unit area of the specimen and K the capillary coefficient, is that as the water absorption gets higher, so does the capillary coefficient and the percentage of the variation is expressed by the correlation coefficient R2. Therefore, the values of R2 as depicted in the graphs shows a high percentage of variation. The moisture capacity is 6.9%. All the laboratory tests were, conducted in accordance with standard codes of prac-tice. The significance of the research is that innovative technology is em-ployed to modify and improve processes in construction industry, thus, enhancing sustainable environmental, management of industrial waste, and cheaper and economic construction. With the 30% replacement of coarse aggregate, the density and water absorption properties of concrete pro-duced are within acceptable limits. Therefore, EPS can be used to produce lightweight concrete that will perform the required function at this level of replacement.
How to cite this paper: Abah, J.C., Ndu-buba, E.E. and Ikpe, E.O. (2018) An Evalu-ation of the Water Absorption and Density Properties of Expanded Polystyrene Sanded Concrete. Open Journal of Civil Engineer-ing, 8, 524-532.
https://doi.org/10.4236/ojce.2018.84037
Received: June 19, 2018 Accepted: December 22, 2018 Published: December 25, 2018
Copyright © 2018 by authors and Scientific Research Publishing Inc. This work is licensed under the Creative Commons Attribution International License (CC BY 4.0).
http://creativecommons.org/licenses/by/4.0/
DOI: 10.4236/ojce.2018.84037 525 Open Journal of Civil Engineering
Keywords
Properties, Expanded Polystyrene, Sanded Concrete, Density, Water Absorption
1. Introduction
The continuous use of natural materials in construction especially in the pro-duction of concrete is having a devastating effect on bio-diversity and the eco-system. It is because of the environmental consequences of the continuous ex-ploitation of this natural resource that the professionals in the construction in-dustries and built environment have always emphasized on the need to employ alternative materials in place of cement and aggregates. The idea of using alter-native materials in replacing some of the natural materials in concrete production especially industrial agricultural and domestic wastes can continue to preserve our natural environment. The continuous exploitation of our natural environment in search of construction materials has adversely affected our environment such as pollution, and depletion of ozone layer through release of gases, etc.
The environmental impacts of the construction industry can be minimized through using waste and recycled materials to replace natural resources [1].
In this research, expanded polystyrene (EPS) was introduced as a partial re-placement of coarse aggregate to produce a lightweight concrete, which is ex-pected to be economical, serviceable and meet the required standards for lightweight concretes. In this case, 30% by volume of natural coarse aggregate is replaced with EPS. Laboratory experiments were conducted on the qualities of concrete produced with this material as lightweight aggregate based on accepted standard codes of practice for concrete.
This work evaluated the mechanical properties in terms of density; and an evaluation of the absorption property using water absorption (capillary absorp-tion and total immersion) as measures. Modeling of parameters using appropri-ate statistical/mathematical expressions was considered in order to predict and obtain necessary information for the appreciation of the use of this material.
This research work is limited to replacing only about 30% volume of natural coarse aggregate by equivalent volume of expanded polystyrene (EPS) to test for the density, and water absorption potentials. The essence of choosing 30% vo-lume as replacement is to ease the control of the mix consistency and bonding because the more the volume of the polystyrene is, the more difficult the cohe-sion of the concrete ingredients especially with manual batching is.
DOI: 10.4236/ojce.2018.84037 526 Open Journal of Civil Engineering Lightweight concrete includes aerated, lightweight aggregates and non-fines concretes; while dense concrete is the popular types for reinforced concrete works with average density of about 2400 kg/m3 [3]. Concrete is a very variable material having wide range of strengths and stress-strain curves, it is any prod-uct or mass made by the use of cementing medium, and it is a composite materi-al [4]. It is therefore possible to say that concrete comprise of mixing cement, aggregates, and often admixtures in appropriate proportions in the present of water; the mixture which undergo chemical reaction forming a paste, on allowed to cure become solid stone like substance. The compositions are natural mate-rials usually extracted from the immediate environment. One of the most im-portant properties of a good quality concrete is low water absorption [5].
It is important to note that one of the transport mechanisms of water into concrete is through the action of capillary absorption and water which flow against gravity is transported spontaneously through the pores or voids of the concrete constituents.
Absorption is the process by which concrete takes in a liquid such as water or aqueous solution by capillary action; and the rate at which water enters the con-crete is called absorptivity (or sorptivity) which depends on the size and inter-connection of the capillary pores in concrete, and the moisture gradient existing from the surface [6]. Capillary water absorption of concrete is the phenomenon by which water is absorbed into concrete by capillary action and that the fine-ness of the capillary pores in concrete causes absorption of water by capillary ac-tion, as such, a measure of the rate of absorption provides a valuable image of the pore structure of concrete. Capillary action is a more suitable test on water penetration to express the quality of concrete for structures aboveground such as building [7].
Density of concrete is one of the important parameters in structural behavior, and the density of concrete is a measure of its weight [8]. The higher the density of concrete the more is the dead load on structure. Most lightweight aggregate concrete used in structure, have equilibrium densities between 1760 - 1840 kg/m3 [9]. However, according to [10] [11] they have density range of 300 kg/m3 up to 1840 kg/m3, with dry density not exceeding 1840 kg/m3
DOI: 10.4236/ojce.2018.84037 527 Open Journal of Civil Engineering The use of high amount of EPS in concrete here means a high valuable waste disposal method, which provides solution for environmental problems and po-lymetric material is recycled. The high percentage of coarse aggregate replace-ment with EPS (i.e. 30%) means a high reduction in the dead load (self-weight) of the concrete elements, improvement of the properties of concrete and low costs, which translates to cheap and economic construction. This is an innova-tive technology using industrial based waste in a way of modification and im-provement in construction.
2. Materials and Methods
2.1. Materials
The materials for this research experiments were locally sourced from the im-mediate environment in Kaura-Namoda, Zamfara state.
Dangote brand of ordinary Portland cement (OPC) of grade 42.5R conform-ing to BS and ASTM standards commonly used in concrete, free from hard lumps and of uniform colour with medium rate of hardening used as the binder was bought from local cement market in kaura Namoda.
The coarse aggregate (natural stone) was obtained from a nearby local aggre-gate site along Kaura Namoda/Zurmi local government in zamfara state. The maximum size of coarse aggregate for this experiment was 19 mm. The fine ag-gregate (sharp sand) was obtained from river Gagale in Kaura Namoda.
The Water used for the mixture and curing of concrete in the experiment is potable water from drinking water tap confirmed to be free from impuri-ties/injurious amount of deleterious materials that can lead to concrete distress.
Expanded polystyrene (EPS) is obtained as waste from packaging container of workshops and laboratory equipment supplied to the Federal polytechnic, Kaura Namoda. The EPS was manually broken into approximately equal sizes of the natural coarse aggregate.
2.2. Batching and Mixing
The mix proportion which was obtained from the trail mix of water/cement ra-tio for the experiments was (1:2:4) by weight with a water/cement rara-tio of 0.5%. In this research, only 30% of the volume of the coarse aggregate was replaced by equivalent volume of EPS and mixing was manually done in the laboratory. The curing of concrete cubes was by total submerging inside water in a curing tank. The material mix proportion is as shown in Table 1.
3. Experimental Methods
3.1. Sieve Analysis
DOI: 10.4236/ojce.2018.84037 528 Open Journal of Civil Engineering determined from the test as shown in Table 2.
3.2. Total Water Absorption
The experimental process is the same as that of capillary absorption except that; in this case, the cubes are totally submerged in water inside a container. The lev-el of water above the face of concrete in the container is kept at nearly 50 mm. Increase in sample mass as water absorbed was measured by weighing each sam-ple at prescribed time intervals of 1, 3, 5, 15, 30 min, 1, 4, 24, and 48, and the av-erage of each set of two sample mass was computed as shown in Table 3.
Total mass of water absorbed at each time was obtained by subtracting the dry weight from the wet.
3.3. Capillary Water Absorption
Concrete specimens of 150 × 150 × 150 mm were casted from the mix. For the curing ages of 7 and 28 days, two specimens were produced and after 24 hours, they were demoulded and placed in water for curing under the same condition as those cubes for compression test until the required testing days.
The samples were, dried in an oven at 85˚C and at regular intervals removed and weighed to ensure constant dry weight before commencing the test and the maximum dry period was 72 hrs. The specimens were then, left to cool at nor-mal room temperature in the laboratory before the water absorption test com-menced. The capillary water absorption test was conducted by placing one face of each sample just in contact with water on supports in a shallow capillary tray and water was gradually added until the level rose above the contact surface by
Table 1. Concrete mix proportions for the experiment.
Ref. w/c ratio Water (kg) Cement (kg) Fine sand (kg) Coarse Aggt. (kg) EPS
[image:5.595.208.540.512.614.2]Values 0.5 12.5 25 50 100 30%
Table 2. Material properties.
Characteristics Coarse aggregate Sand aggregate
Max. Size (mm) 20 Retained in 4.75 mm sieve
Bulk density (kg/m3) 1523 1410
Water absorption % 2.3 5.2
Fineness modulus 1.42 2.67
Table 3. Total Absorption.
Mark Inertial wts. Time interval of weighing/individual specimen weights (gm.) Wet oven 1 min 3 min 5 min 15 min 30 min 1 hr 4 hr 24 hr 48 hr C1 5396 5030 65 90 105 135 180 210 290 355 360
DOI: 10.4236/ojce.2018.84037 529 Open Journal of Civil Engineering about (2 - 3) mm as depicted in Figure 1.
Increase in sample mass as water absorbed was measured by weighing each sample at prescribed time intervals of 1, 3, 5, 15, 30 min, 1, 4, 24, and 48, and the average of each set of two sample mass was computed as shown in Table 4. Total mass of water absorbed at each time, was obtained by subtracting the dry weight from the wet. The capillary water absorption was computed by the ratio of mass gained to the area of specimen in contact with water in (g/mm2) which was plot-ted against the square root of time, the initial slope of which was considered as water absorption coefficient. The area of concrete in contact with water is 150 mm × 150 mm = 22,500 mm2. Capillary water absorption coefficient is the slope of linear variation of absorbed water per unit area plotted against square root of time for the experiment.
3.4. Absorption Capacity (Moisture Content)
The absorption capacity is determined from the wet weight of cubes and their corresponding oven dry weights at specified period. If the initial wet weight is A, and the oven dried weight is B, the absorption capacity is then computed in per-centage as;
( )
MC % A B 100% B × − =
All the water absorption tests were, conducted in accordance with [15].
3.5. Density
Both the wet and dry densities of concrete cubes (150 × 150 × 150) size were performed.
Density,
mass volume
ρ= (1)
[image:6.595.224.529.476.593.2]Wet density,
Figure 1. Sample of capillary water test illustration.
Table 4. Capillary absorption.
Mark Inertial wts. Time interval of weighing/individual specimen weights (gm.) Wet oven 1 min 3 min 5 min 15 min 30 min 1 hr 4 hr 24 hr 48 hr
B1 5391 5025 15 20 25 40 55 75 135 250 290
[image:6.595.207.540.647.709.2]DOI: 10.4236/ojce.2018.84037 530 Open Journal of Civil Engineering wet mass
volume
b
ρ = (2)
Dry density,
oven dry weight . volume
d
ρ =
(3)
The density test was conducted in accordance with [16] specifications.
4. Results and Discussion
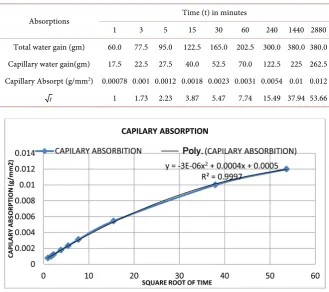
[image:7.595.208.538.406.698.2]The result of EPS concrete water absorption at 28 days of curing is presented in Table 5 and Figure 2 and Figure 3. These figures also showed that total water and capillary water absorption increases with time of suction. The modeled rela-tionship between the capillary absorption and square root of time showed strong polynomial correlation with high regression value of 0.9997 (99.9%). While the modeled relationship between the capillary water gain and total water gain with time showed strong polynomial and logarithm relationship with regression value of 0.9556 (95.5%) and 0.9733 (97.33%) respectively. These from the graphs, shows that the high rate of water absorption at the early periods of the test has corresponding capillary coefficient of steep slope within the same period. The relationship between the variables Q the water absorption per unit area of the specimen and K the capillary coefficient, is that as the water absorption gets
Table 5. Capillary Water absorption after 28 days of curing.
Absorptions Time (t) in minutes
1 3 5 15 30 60 240 1440 2880
Total water gain (gm) 60.0 77.5 95.0 122.5 165.0 202.5 300.0 380.0 380.0 Capillary water gain(gm) 17.5 22.5 27.5 40.0 52.5 70.0 122.5 225 262.5 Capillary Absorpt (g/mm2) 0.00078 0.001 0.0012 0.0018 0.0023 0.0031 0.0054 0.01 0.012
t 1 1.73 2.23 3.87 5.47 7.74 15.49 37.94 53.66
DOI: 10.4236/ojce.2018.84037 531 Open Journal of Civil Engineering Figure 3. Water gain vs Time (t).
higher, so does the capillary coefficient and the percentage of the variation is ex-pressed by the correlation coeffient R2. Therefore, the values of R2 as depicted in the graphs shows a high percentage of variation.
Average initial wet weight of cubes A = 6041 g and average oven dry weight of cubes B = 5650 g.
6041
Moisture ca 5650
5650
pacity MC= − ×100 6.9%=
The values for bulk and oven dry densities are computed using Equations (2) and (3) respectively and the results was found to be 1789 kg/m3 and 1674 kg/m3 for the bulk and oven dry density respectively. This is within the range for lightweight concrete as specified by [8] [9]. However, this result shows that the density of EPS modified concrete is less than the density of normal aggregate concrete.
5. Conclusion and Recommendations
5.1. Conclusions
The capillary absorption and square root of time showed a strong polynomial relationship with high regression while the capillary water gain and total water gain with time showed strong polynomial and logarithm relationship with high regression value.
The values for bulk density and dry density are found to be 1789 kg/m3 and 1674 kg/m3 respectively and this is within the acceptable range for lightweight concrete. The moisture absorption capacity of the EPS concrete was measured to be 6.9%.
5.2. Recommendations
DOI: 10.4236/ojce.2018.84037 532 Open Journal of Civil Engineering elements. Further studies in this area will be of important to add more values to the use of this material in concrete production and waste management.
Conflicts of Interest
The authors declare no conflicts of interest regarding the publication of this pa-per.
References
[1] Herki, B.M.A. (2017) Combined Effects of Densified Polystyrene and Unprocessed Fly Ash on Concrete Engineering Properties. Buildings.
http://www.mdpi.com/buildings
[2] Oyenuga, V.O. (2001) Reinforced Concrete Design. 2nd Edition, Asros Ltd., Lagos. [3] Neville, A.M. and Brooks, J.J. (2010) Concrete Technology. 2nd Edition, Pearson
Education Ltd., London.
[4] Mosley, W.H., Bungey J.H. and Husle, R. (2007) Reinforced Concrete Design. 6th Edition, Palgrave Publishers Ltd., New York.
[5] Herki, B.M.A. (2017) Absorption Characteristics of Lightweight Concrete Contain-ing Densified Polystyrene. Civil Engineering Journal, 3.
[6] Neil, J. and Dhir, R.K. (1996) Civil Engineering Materials. 5th Edition, Macmillan Education, Basingstoke.
[7] Khatib, J.M. and Clay, R.M. (2003) Absorption Characteristics of Metakaolin Con-crete. Cement and Concrete Research.
[8] Mulla, A. and Shelake, A. (2016) Lightweight Expanded Polystyrene Beads Con-crete. International Journal of Research in Advent Technology, E-ISSN: 2321-9637 Special Issue National Conference“VishwaCon’16”, 17-21.
[9] Joseph, F.L. and James, H.P. (2006) Significance of Tests and Properties of Concrete & Concrete-Making Materials. ASTM International, West Conshohocken. [10] Hjh, K.M.I., Mohamad, S.F. and Norpadzlihatun, bte. M. (2010) Study of Lightweight
Concrete Behavior.
[11] Kenneth, S. and Harmon, P.E. (2006) Engineering Properties of Structural Lightweight Concrete. Carolina Stalite Company,Salisbury.
[12] Mandlik, A., Sood, T.S., Karade, S., Naik, S. and Kulkarni, A. (2013) Lightweight Concrete Using EPS. ISSN (Online): 2319-7064, International Journal of Science and Research (IJSR), 4, 2007-2010.
[13] Mustafa Al Bakri, A.M., Zarina, Y., Norazian, M.N., Kamarudin, H., Ruzaidi, C.M. and Rafiza, A.R. (2013) Study of Concrete using Modified Polystyrene Coarse Ag-gregate. Advanced Materials Research, 740, 502-506.
https://doi.org/10.4028/www.scientific.net/AMR.740.502
[14] British Standards Institution (2012) Testing for Geometric Properties of Aggregates Part 1: Determination of Particle Size Distribution-Sieve Method. BS EN 933-1. [15] British Standards Institution (2011) Testing Concrete: Method for Determination of
Water Absorption. BS1881-122.