A STUDY ON OPTIMIZATION OF BIO
DESIGN OF EXPERIMENT
*Wan-Su Hyeon, Yong-GyunJin, Eun
Department of Environmental and Energy Engineering
ARTICLE INFO ABSTRACT
This study was
sludge as the main material. However, the sewage sludge has a high moisture content, so the energy cost of the drying process is considerable, and the calorific value is 3000 ~
low value to replace fossil fuels. In order to improve these problems and to secure competitiveness against fossil fuels, bio
mixing ratio was optimized. Th
optimize the composition of bio solid fuel by using mixture design which is one of the design of experiment (DOE). As a result, the moisture content was reduced by about 20% and the calo
of about 1000 kcal / kg could be improved.
Copyright©2017, Wan-Su Hyeon et al. This is an open access article distributed under the Creative Commons Att distribution, and reproduction in any medium, provided the original work is properly cited.
INTRODUCTION
Environmental pollution such as global warming due to rapid economic growth and urbanization is serious. At the same time, as the amount of sewage sludge generated by urban concentration of population has been increasing, the problem of sewage sludge treatment has begun to be raised.
2015) In some countries, landfilling of sewage sludge has been prohibited and has been treated with marine dumping. However, due to the prohibition of marine dumping by the London Convention 1996 Protocol, research and development related to sludge disposal and recycling are being actively
pursued. (Yoon et al., 2011) In addition, the use of fossil fuels
due to indiscriminate industrialization generated a large amount of greenhouse gases, which caused the average
the Earth to rise, causing problems such as abnormal climate and disease. As a result, the importance of research on renewable energy that can replace fossil fuels and utilize abandoned waste resources has increased internationally. and Lee, 2015) Accordingly, the use of sewage sludge as a raw material for biomass fuels is a positive approach to recycling sewage sludge as renewable energy and cope with global
warming. (Li et al., 2009) However, since the moisture content
of sewage sludge is greater than 80%, there is a problem that the amount of energy
*Corresponding author: Wan-Su Hyeon,
Department of Environmental and Energy Engineering University (INU), CO-22012, Rep. of Korea.
ISSN: 0975-833X
Article History:
Received 22nd April, 2017 Received in revised form 14th May, 2017
Accepted 16th June, 2017 Published online 31st July, 2017
Citation: Wan-Su Hyeon, Yong-GyunJin, Eun-Ji Jo, Hyun fuel composition with sewage sludge using design of experiment (DOE)
Key words:
Bio-SRF, Design of experiment (DOE), Mixture design, Sewage Sludge, Waste-to-energy, Waste Biomass.
Available online at http://www.journal
RESEARCH ARTICLE
A STUDY ON OPTIMIZATION OF BIO-SOLID FUEL COMPOSITION WITH SEWAGE SLUDGE
DESIGN OF EXPERIMENT (DOE)
GyunJin, Eun-Ji Jo, Hyun-Goo Han, Seon-Ung Min and Woon
Environmental and Energy Engineering, Incheon National University
Rep. of Korea
ABSTRACT
This study was performed to reduce greenhouse gas by producing the bio solid fuel with sewage sludge as the main material. However, the sewage sludge has a high moisture content, so the energy cost of the drying process is considerable, and the calorific value is 3000 ~
low value to replace fossil fuels. In order to improve these problems and to secure competitiveness against fossil fuels, bio - solid fuel was prepared by mixing sewage sludge and biomass, and then the mixing ratio was optimized. This study suggests a method to reduce the number of experiments and to optimize the composition of bio solid fuel by using mixture design which is one of the design of experiment (DOE). As a result, the moisture content was reduced by about 20% and the calo
of about 1000 kcal / kg could be improved.
is an open access article distributed under the Creative Commons Attribution License, which distribution, and reproduction in any medium, provided the original work is properly cited.
Environmental pollution such as global warming due to rapid economic growth and urbanization is serious. At the same time, as the amount of sewage sludge generated by urban concentration of population has been increasing, the problem of
ment has begun to be raised. (Jeong et al.,
In some countries, landfilling of sewage sludge has been prohibited and has been treated with marine dumping. However, due to the prohibition of marine dumping by the ch and development related to sludge disposal and recycling are being actively In addition, the use of fossil fuels due to indiscriminate industrialization generated a large amount of greenhouse gases, which caused the average temperature of the Earth to rise, causing problems such as abnormal climate and disease. As a result, the importance of research on renewable energy that can replace fossil fuels and utilize abandoned waste resources has increased internationally. (Ahn Accordingly, the use of sewage sludge as a raw material for biomass fuels is a positive approach to recycling sewage sludge as renewable energy and cope with global However, since the moisture content is greater than 80%, there is a problem that
Environmental and Energy Engineering, Incheon National
to be supplied to the drying process is large when the solid fuel is manufactured. In addition, the calorific value of the fuel generated after drying is 3000 ~ 4000 kcal / kg, so the calorifi value is lower than that of fossil fuels, so it is less competitive as an alternative fuel. Therefore, in order to solve these problems, this study intends to produce bio solid fuel by mixing waste biomass with sewage sludge. Design of experiment was carried out by using Mixture design which is used for the mixture composed of various complex samples and the sample was mixed according to the established experimental procedure. Samples used for mixing were waste wood and coffee grounds to reduce the moistu
improve the calorific value. The moisture content and calorific value of the mixture are measured and the optimum composition ratio of the mixture composed of waste biomass is determined by using a response optimizer.
2012)
MATERIALS AND METHODS
Samples
This study used materials which are distributed or produced in Korea. Sewage sludge as main raw material is raw sludge (moisture content 80%) generated in sewage treatment plant. In addition, based on the results of the physical properties analysis, waste wood was used for reducing moisture content
International Journal of Current Research
Vol. 9, Issue, 07, pp.54497-54501, July, 2017
Ji Jo, Hyun-Goo Han, Seon-Ung Min and Woon-Ho Yeo, 2017. “
with sewage sludge using design of experiment (DOE)”, International Journal of Current Research, 9, (07),
Available online at http://www.journalcra.com
SOLID FUEL COMPOSITION WITH SEWAGE SLUDGE USING
Ung Min and Woon-Ho Yeo
, Incheon National University (INU), CO-22012,
performed to reduce greenhouse gas by producing the bio solid fuel with sewage sludge as the main material. However, the sewage sludge has a high moisture content, so the energy cost of the drying process is considerable, and the calorific value is 3000 ~ 4000kcal / kg, which is low value to replace fossil fuels. In order to improve these problems and to secure competitiveness solid fuel was prepared by mixing sewage sludge and biomass, and then the is study suggests a method to reduce the number of experiments and to optimize the composition of bio solid fuel by using mixture design which is one of the design of experiment (DOE). As a result, the moisture content was reduced by about 20% and the calorific value
ribution License, which permits unrestricted use,
to be supplied to the drying process is large when the solid fuel is manufactured. In addition, the calorific value of the fuel generated after drying is 3000 ~ 4000 kcal / kg, so the calorific value is lower than that of fossil fuels, so it is less competitive as an alternative fuel. Therefore, in order to solve these problems, this study intends to produce bio solid fuel by mixing waste biomass with sewage sludge. Design of ried out by using Mixture design which is used for the mixture composed of various complex samples and the sample was mixed according to the established experimental procedure. Samples used for mixing were waste wood and coffee grounds to reduce the moisture content and to improve the calorific value. The moisture content and calorific value of the mixture are measured and the optimum composition ratio of the mixture composed of waste biomass is determined by using a response optimizer. (Kim and Jeon,
MATERIALS AND METHODS
This study used materials which are distributed or produced in Korea. Sewage sludge as main raw material is raw sludge (moisture content 80%) generated in sewage treatment plant. In addition, based on the results of the physical properties wood was used for reducing moisture content
INTERNATIONAL JOURNAL OF CURRENT RESEARCH
and coffee grounds was used for improving the heating value. Sampling was done by conical quartering according to the waste process test method (ES 06140). (Ministry of Environment in SOUTH KOREA, 2016)
Preparation Experiment
In this study, six kinds of experiments were conducted for proximate analysis, calorific value, ultimate analysis, biomass content, and aerobic activate respiration of raw samples. Optimization was performed after calculating the mixing ratio using the experimental design method. All experiments were repeated three times according to the waste process test method. (Ministry of Environment in SOUTH KOREA, 2016)
Moisture Content
This is an analysis that measures the moisture of the sample. The moisture is calculated by weight difference between the sample and the sample after drying at 105 ± 10 .
Calorific value
The calorific value is an important indicator of fuel quality. In Korea, Japan and other countries, it can be used as a fuel only if it satisfies the legal quality standards. A calorimeter (Parr6100, USA) was used to measure the calorific value. For the analysis, 0.5 ~ 1.5g of dry sample is quantitatively placed in a bomb and injected with 40psi of oxygen. Then, the difference in temperature of the distilled water in the outer tank is measured to measure the calorific value.
Design of Experiments (DOE)
A design of experiment (DOE) is a method to find out how to perform, how to collect data, and how to get the most information with minimal experimentation. (Park, 2008) The experimental design method consists of three basic principles of randomization, replication, and blocking. Randomization is a method for determining the unit of experiment or determining the order of experiment to be arbitrary, and to prevent the unselected factors from influencing the experimental results. Replication means that the experiment is performed more than once under the same conditions. Experimental results are not the same because experiments that were performed under the same conditions always involve uncontrollable errors. Blocking refers to dividing the entire experiment into as many blocks as possible and examining the
effect of each factor within each block. (Chun et al., 2015) A
design of experiment includes Factorial Design, Split-Plot Design, Confounding Method, Fractional Factorial Design, Incomplete Block Design, Response Surface Design, Mixture Design, and Robust Design. Among these eight categories, this study is carried out using the mixture experiment design
method. (Chun et al., 2015)
Mixture design
Most design of experiment aim to find out that one or more factors (x) have a significant effect on the response value (y) of interest or to find the optimal condition of the factors that maximize or minimize the response value. (Park, 2008) Mixture design is used to find out which components have a significant effect on the response variables and what the optimal mixing ratio satisfies the response variables (Cornell,
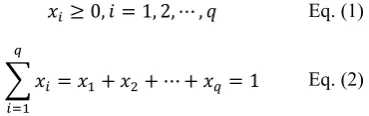
2011). Assuming that xi is the ratio of the i-th component in a mixture which has a number(q) of components, the component has the following constraint.
≥ 0, = 1, 2, ⋯ , Eq. (1)
= + + ⋯ + = 1 Eq. (2)
Due to the constraint of Eq. (2), is not independent of each other. And A experimental region which was undergone equation 1 and 2, will be a simplex with retaining a number(q)
of vertices as (q-1) dimensional polyhedron. (Byun et al.,
2014) Representative DOE methods for the mixture experiment include the simplex lattice arrangement method and the simplex center alignment method. However, the mixing component often has a lower limit and an upper limit in the actual mixture experiment. In this case, the vertices design
method considering the constraint is used. (Byun et al., 2014)
Establish an experimental plan
[image:2.595.353.538.112.170.2]The design and analysis of the experimental plan was performed using the statistical software MINITAB ver.17. The two response variables considered in the development experiment, their characteristics, the target value, and the upper and lower limits are shown in Table 1. Moisture content is the smaller the better characteristic. Therefore, the smallest value is a good value. As a result of the moisture content of the mixture by DOE, the moisture reduction ratio is at least 8 to 32% through biomass mixing. Therefore, this study sets a reduction ratio of 10% for the upper limit value and 20% for the target value which is the average of the moisture reduction ratio. On the other hand, the calorific value is the larger the better characteristic. Considering that the calorific value of sewage sludge is about 3,600 kcal/kg, aiming at stable improvement from 4100kcal / kg to about 4600 kcal/kg, the lower limit was 4100kcal/kg and the target value of the experiment was 4500 kcal/kg.
Table 1. Response Variables
Responses Objective Lower
Limit
Target Upper
Limit Unit
Y1 : Moisture Content
Smaller-the-better
- 60 70 %
Y2 : Calorific Value
Larger-the-better
4,100 4,500 - kcal/kg
Table 2. Components and Their Limits
Factor Lower Limit Upper Limit
X1 : Sewage Sludge 0.50 0.65
X2 : Coffee Grounds 0.00 0.50
X3 : Waste Wood 0.00 0.50
[image:2.595.318.547.561.641.2]optimize the correlation of each component. The sum of all components is 1 (100%). It was shown in Table 2.
Fig. 1 is a simplex design using the upper and lower limits of Table 2. Table. 3 is an experimental plan made with Minitab. In Point Type, 0 is the center point, and 1 and -1 are the vertices.
[image:3.595.39.285.397.504.2]Figure 1. Simplex design plot by mixture design
Table 3. Design table by the mixture design
Std order
Run order
Point
type Block X1 X2 X3
1 9 1 1 0.5 0 0.5
2 5 1 1 0.65 0 0.35
3 2 1 1 0.5 0.5 0
4 7 1 1 0.65 0.35 0
5 8 0 1 0.575 0.2125 0.2125
6 1 -1 1 0.5375 0.10625 0.35625
7 4 -1 1 0.6125 0.10625 0.28125
8 3 -1 1 0.5375 0.35625 0.10625
9 6 -1 1 0.6125 0.28125 0.10625
RESULTS AND DISCUSSION
Characteristics of Biomass Raw Material
The results of the physical properties analysis of the sampled sewage sludge, coffee grounds, and waste wood are shown in Table. 4. The moisture content of sewage sludge and coffee bean was 81.8% and 64.6%, respectively. On the other hand, the moisture content of the waste wood is as low as 18.1%. In addition, the calorific value of sewage sludge is 3636.1 kcal / kg, which is lower than that of coffee grounds and waste wood showing 5817.86 kcal / kg and 4459.50 kcal / kg. As a result, coffee grounds and waste wood have suitable values as materials to reinforcing sewage sludge fuel. The biomass is composed of elements such as oxygen and carbon, which are shown in Table 5.
Physical properties measurement
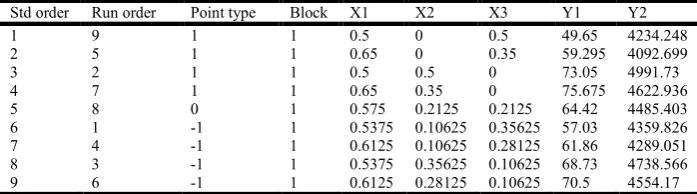
[image:3.595.51.547.539.592.2]Mixed samples were prepared according to the experimental plan prepared by Minitab. The moisture content and calorific value of the sample were measured. The results are shown in Table 6.
Analysis of Mixture Design
The moisture content and the calorific value of the mixture obtained from the analysis results of the mixed samples made according to the experimental plan were used as the response variables. And X1, X2, and X3 are independent variables. The correlation between this response variable and each independent variable was analyzed through mixture design. Model fitting methods of Minitab include mixture regression, stepwise, forward selection, and backward elimination. Basically, mixture regression is used. This study chooses a model that fits the data well (with a high R-squared value) and a method that obtains a significant regression equation (a low
p-value) according to each response variable. (Park et al.,
2010) The results of analysis for each response variable are shown in the next section.
X1
0.5 1.0
X2
0.5
0.0
X3
0.5 0.0
Table 4. The content analysis of the properties of waste biomass
Material Proximate Analysis Calorific Value
(kcal/kg)
AT4 (mgO2/gDM)
Biomass Contents (%)
Moisture(%) Ash (%) Volatile matter (%) Fixed Carbon (%)
Sewage Sludge (n=3) 81.8 6.38±0.2 9.5±0.98 2.32±1.06 3636.1±32.13 11.5±0.53 63.8±1.49
Coffee Grounds (n=3) 64.6±0.5 0.17±0.1 29.2±0.9 6.01±0.5 5817.86±73.5 2.60±1.6 99.43±0.2
Waste Wood (n=3) 18.1±1.4 7.5±1.96 60.0±3.43 14.45±2.66 4459.40±75.20 4.23±0.14 90.75±2.44
Table 5. Ultimate analysis of waste biomass
Material C H O N S Cl
Sewage Sludge (n=3) 33.9±0.36 5.0±0.12 46.5±0.48 6.0±0.42 2.2±0.26 N/D
Coffee Grounds (n=3) 55.59±1.7 8.32±0.4 29.19±2.3 6.53±0.3 0.21±0.1 N/D
[image:3.595.121.470.695.792.2]Waste Wood (n=3) 45.57±0.57 6.26±0.8 1.81±0.14 0.01±0.002 37.25±2.50 N/D
Table 6. Measuring results of Moisture content and Calorific Value
Std order Run order Point type Block X1 X2 X3 Y1 Y2
1 9 1 1 0.5 0 0.5 49.65 4234.248
2 5 1 1 0.65 0 0.35 59.295 4092.699
3 2 1 1 0.5 0.5 0 73.05 4991.73
4 7 1 1 0.65 0.35 0 75.675 4622.936
5 8 0 1 0.575 0.2125 0.2125 64.42 4485.403
6 1 -1 1 0.5375 0.10625 0.35625 57.03 4359.826
7 4 -1 1 0.6125 0.10625 0.28125 61.86 4289.051
8 3 -1 1 0.5375 0.35625 0.10625 68.73 4738.566
Moisture content
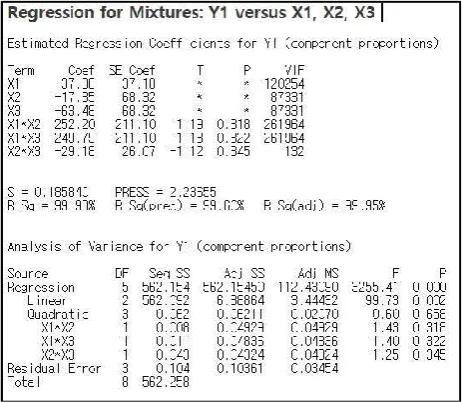
[image:4.595.320.546.110.305.2] [image:4.595.47.279.238.439.2]The analysis of the experimental results was carried out using Minitab's mixture design. The results of the mixture analysis on the moisture content of the biofuel solid fuel are shown in Fig. 2 and Fig. 3. Respectively. The coefficients of X2 and X3 are negative, while the coefficients of X1 are positive in the estimated regression coefficients. It can be seen that the content of waste wood (X3) and coffee residue (X2) must be increased to lower the moisture content. Especially, it is expected that the moisture content reduction effect of waste wood is great. The regression results for the moisture content of bio-solid fuel show high reliability with R-squared = 99.98%. Regression analysis showed P = 0.000 and linear coefficient P = 0.002, which is significant.
Figure 2. Analysis result of the regression and variance for moisture content
Figure 3. 3D surface plot for moisture content result
Calorific value
The analysis results and the surface diagram are shown in Fig. 4 and Fig. 5. Regression analysis shows that the data fit of the linear model is R-squared =99.54%, which is significant in the linear model. And regression analysis result is P = 0.001 and linear coefficient is P = 0.109. This is a significant figure. The estimated regression coefficients show that the values of X2
[image:4.595.321.546.348.538.2]be seen that the coffee grounds(X2) and the waste wood(X3) greatly affect the heating value of the mixed fuel. Especially, coffee grounds is expected to greatly contribute to the improvement of the calorific value.
Figure 4. Analysis result of the regression and variance for Calorific Value
[image:4.595.53.273.483.668.2]Figure 5. 3D surface plot for Calorific Value result
[image:4.595.312.554.569.776.2]Mixture optimization
One of the DOE's purposes is to find the optimal level of independent factors. The Optimization Technique of the mixture design is to find the response variables for the experimental points at each step and then to find the optimum level of the factors while moving in the direction of
optimization. (Park et al., 2005) The moisture content of the
bio solid fuel showed the smaller the better characteristic and the minimum moisture content was 49.65% as a result of the basic test according to the experimental plan. On the other hand, the calorific value shows the larger the better characteristic. And the maximum calorific value was 4991.73kcal / kg as a result of the basic test according to the experimental plan. Based on this, the target value, upper limit and lower limit value of bio solid fuel were selected. It is shown in Table 1. As a result of using the response optimizer, optimum conditions were obtained as sewage sludge (X1) = 0.5, coffee grounds (X2) = 0.25 and waste wood (X3) = 0.25. It is estimated that the moisture content of the mixed sample made with this mixing condition is 59.5348%, and the calorific value is estimated to reach 4655.9126 kcal / kg. The results obtained by the response optimization showed high satisfaction with the total satisfaction function as D = 1.00.The results are shown in Fig. 6.
Conclusion
The mixture design of the DOE was used to reduce the moisture content of the bio solid fuel using sewage sludge and to optimize it to increase the calorific value. The effect of factors on response variables was analyzed and the following conclusions were obtained.
1. The moisture contents of the raw materials (sewage
sludge, coffee bean, and waste wood) were 81.8%, 64.6% and 18.07%, respectively. The calorific values were 3636.1kcal / kg, 5817.86kcal / kg and 4459.4kcal / kg .
2. The optimum mixing composition was obtained to
reduce the energy of the drying process in the production of fuel using sewage sludge and to secure a high calorific value to replace fossil fuels. This was obtained by means of a response optimizer and the results are sewage sludge (X1) = 0.50, coffee bean (X2) = 0.25 and waste wood (X3) = 0.25.
3. As a analysis result of the effects of each factor on the
mixture, the waste wood (X3) had the greatest effect on the moisture content and the coffee grounds (X2) had the greatest effect on the calorific value. Therefore, it is thought that the influence of each is reflected in the optimum composition.
4. As a result of the confirmation test for the optimum
composition, the moisture content was found to be 59.87% and the calorific value was 4653.33 kcal / kg.It coincides with the predicted value.
This study reduce the number of experiments by using the vertices design of the mixture design and suggests a methodology for designing the optimal composition of bio
solid fuel. Based on this, it is necessary to apply to various
biomass in future research, and methodological
complementation of physical, biological and chemical reaction of biomass is needed.
Acknowledgements
This work (No. C0395625) was supported by Business for Cooperative R&D between Industry, Academy, and Research Institute funded Korea Small and Medium Business Administration in 2016.
REFERENCES
Ahn, H., & Lee, Y. 2015. A study on optimum conditions for
molding sewage sludge. Journal of the Korea Organic
Resource Recycling Association, 23(1), 29-37.
Byun, J., Seo, P. S., Shin, J. E., Lee, L. G., &Yeom, J. H. 2014. A case study of developing rapid-hardening ultra-low temperature adhesives by mixture design and multiple
response optimization. Journal of the Korean Society for
Quality Management, 42(4), 757-768.
Chun, K. J., JinSeon, A., Yeo, N. S., & Dong, L. H. 2015. Information visualization for the manufacturing process optimization based on design of experiment and data analysis. KIPS Transactions on Software and Data Engineering, 4(9), 9.
Cornell, J. A. 2011. Experiments with mixtures: Designs, models, and the analysis of mixture data John Wiley & Sons.
Jeong, H., Lee, K., Chung, H., Kim, D., Kim, H., Choi, Y., et
al. 2015. Optimization mixture ratio of petasitesjaponicus,
luffa cylindrica and houttuyniacordata to develop a functional drink by mixture design. Journal of Life Science, 25(3), 329-335.
Kim, J., & Jeon, E. 2012. Optimization of ingredients for
vacuum glazing pillar using DOE. Journal of the Korea
Academia-Industrial Cooperation Society, 13(3), 1002-1007.
Li, X., Lim, W., Iwata, Y. & Koseki, H. 2009. Safety evaluation of sewage-sludge-derived fuels by comparison
with other fuels. Fire Mater, 33, 187-200.
Ministry of Environment in SOUTH KOREA. 2016. Resource Conservation and Recycling Promotion Act
Ministry of Environment in SOUTH KOREA. 2016. WASTE PRECESS TEST METHOD.
Park, H., Lee, H., Ji, S., Choi, H., & Jeon, O. Design of covering shelf in car interior by using DOE of tacuchi method. Spring Conference Proceedings, 2. pp. 765-770. Park, S. H. 2008. Design of experiments. Minyongsa, Seoul,
121-140.
Park, S., Lim, D., Kim, K., Bae, J., & Jeon, O. 2010. A study of the optimization of the compounded PP using the DOE.
Transactions of the Korean Society of Automotive Engineers, 18(1), 74-85.
Yoon, H., Cho, S., Kang, S., Kim, J., Kim, K., Ko, D., et al.
Fuel production using sewage sludge and the utilization of co-firing fuel in coal-fired power plant. The Korean Society for New and Renewable Energy.